

Key Insights
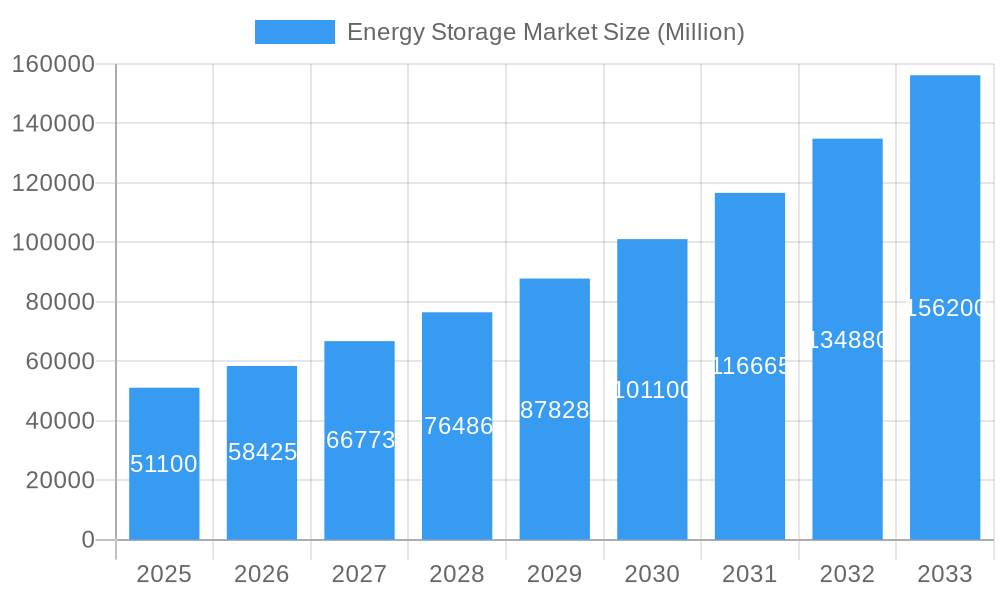
The global energy storage market, valued at $51.10 billion in 2025, is poised for significant growth, exhibiting a Compound Annual Growth Rate (CAGR) of 14.31% from 2025 to 2033. This expansion is driven by several key factors. The increasing adoption of renewable energy sources, such as solar and wind power, necessitates efficient energy storage solutions to address their intermittent nature. Furthermore, rising electricity prices and growing concerns about energy security are compelling governments and businesses to invest in energy storage infrastructure. Technological advancements in battery technologies, particularly lithium-ion batteries, are also contributing to market growth, offering improved performance, longer lifespans, and reduced costs. The diverse applications across residential, commercial, and industrial sectors further fuel this market expansion. Specific growth drivers include the electrification of transportation, the development of smart grids, and the increasing demand for backup power systems during grid outages. While challenges such as high initial investment costs and concerns regarding battery lifecycle management and recycling exist, the long-term benefits of energy storage are undeniable, positioning this market for sustained growth throughout the forecast period.
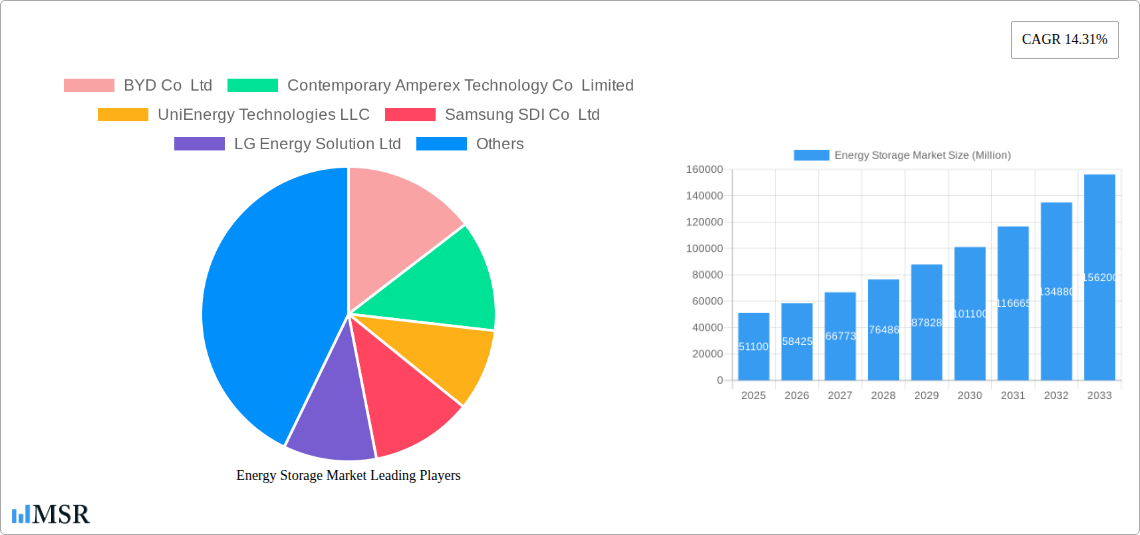
Energy Storage Market Market Size (In Billion)
Market segmentation reveals that batteries dominate the energy storage type market, followed by pumped-storage hydroelectricity (PSH), thermal energy storage (TES), and flywheel energy storage (FES). The commercial and industrial sectors represent the largest application segments, driven by the need for reliable and cost-effective energy solutions for businesses. Geographically, North America, Asia Pacific, and Europe are leading the market, with China and the United States as key players. However, developing economies in regions like Asia Pacific and South America are also witnessing increasing energy storage adoption, driven by rapid urbanization and industrialization. The competition in the energy storage market is intense, with major players such as BYD, CATL, Tesla, Samsung SDI, and LG Energy Solution vying for market share through technological innovations and strategic partnerships. The forecast period anticipates continued innovation in battery chemistry, improved energy density, and enhanced safety features to further propel market growth.
Energy Storage Market Company Market Share
Dive Deep into the Booming Energy Storage Market: A Comprehensive Report (2019-2033)
This comprehensive report offers an in-depth analysis of the global Energy Storage Market, providing critical insights for investors, industry stakeholders, and strategic decision-makers. Spanning the period from 2019 to 2033, with a focus on the 2025-2033 forecast period, this report meticulously examines market dynamics, key segments, leading players, and emerging trends shaping the future of energy storage. The study period is 2019-2033, with 2025 as the base and estimated year.
Energy Storage Market Market Concentration & Dynamics
This section analyzes the competitive landscape of the energy storage market, encompassing market concentration, innovation ecosystems, regulatory frameworks, substitute products, end-user trends, and mergers & acquisitions (M&A) activities. The market is characterized by a moderately concentrated structure, with a few dominant players holding significant market share. However, the emergence of innovative startups and the increasing diversification of technologies are driving competition.
- Market Share: Top 5 players account for approximately xx% of the global market share in 2025.
- M&A Activity: A total of xx M&A deals were recorded in the energy storage sector between 2019 and 2024, indicating a high level of consolidation and strategic investment. The average deal size was approximately $xx Million.
- Regulatory Frameworks: Government policies promoting renewable energy integration and grid modernization are significantly influencing market growth, with varying regulations across different geographies creating diverse opportunities and challenges.
- Substitute Products: The market faces competition from alternative energy sources and storage technologies, notably conventional fossil fuels and other forms of energy storage like pumped hydro. This competition influences pricing and technology adoption.
- End-User Trends: Growing demand for reliable and sustainable energy solutions, particularly in the residential and commercial & industrial sectors, is a key driver for market expansion. The increasing adoption of renewable energy sources is further fueling this demand.
Energy Storage Market Industry Insights & Trends
The global energy storage market is experiencing robust growth, driven by several key factors. The market size in 2025 is estimated at $xx Million and is projected to reach $xx Million by 2033, exhibiting a Compound Annual Growth Rate (CAGR) of xx% during the forecast period. This growth is primarily fueled by increasing demand for renewable energy integration, the need for grid stabilization and resilience, and the declining cost of energy storage technologies. Technological advancements, particularly in battery chemistry and energy management systems, are continuously improving the efficiency and cost-effectiveness of energy storage solutions. Furthermore, evolving consumer preferences toward sustainable and environmentally friendly energy solutions are further driving market adoption. Government initiatives, subsidies, and tax incentives are creating a conducive environment for market expansion.
Key Markets & Segments Leading Energy Storage Market
The Asia-Pacific region is currently the dominant market for energy storage, followed by North America and Europe. Within the various segments, batteries currently hold the largest market share in terms of type, driven by advancements in lithium-ion technology and cost reductions. However, other technologies such as pumped-storage hydroelectricity (PSH) and thermal energy storage (TES) are also experiencing significant growth, particularly in specific niche applications.
Leading Segments (by Type):
- Batteries: Dominated by lithium-ion batteries, witnessing continuous advancements in energy density and lifespan. This segment is expected to maintain its dominant position throughout the forecast period.
- Pumped-storage Hydroelectricity (PSH): A mature technology with significant capacity, particularly suited for large-scale grid-level applications.
- Thermal Energy Storage (TES): Gaining traction for industrial and commercial applications, offering cost-effective solutions for thermal energy management.
- Flywheel Energy Storage (FES): Finding niche applications in grid stabilization and microgrids.
- Other Types: Includes emerging technologies like flow batteries and compressed air energy storage.
Leading Segments (by Application):
- Residential: Driven by increasing adoption of rooftop solar panels and the desire for energy independence.
- Commercial and Industrial: Fueled by cost savings, improved grid reliability, and the ability to integrate renewable energy sources.
Drivers:
- Rapid economic growth in emerging economies.
- Increasing investments in renewable energy infrastructure.
- Government policies and incentives supporting energy storage deployment.
- Stringent environmental regulations aiming to reduce carbon emissions.
Energy Storage Market Product Developments
Recent years have witnessed significant advancements in energy storage technologies, including improved battery chemistries (e.g., solid-state batteries), more efficient energy management systems, and innovative hybrid storage solutions. These developments are driving down costs, enhancing performance, and expanding the applications of energy storage across various sectors. The focus on longer lifespan and improved safety features further increases the market appeal. This increased efficiency and reduced cost is translating into significant competitive advantages for manufacturers.
Challenges in the Energy Storage Market Market
The energy storage market faces several challenges including:
- High initial capital costs: The upfront investment required for energy storage systems can be substantial, particularly for large-scale deployments.
- Supply chain disruptions: The reliance on specific materials for battery production creates vulnerability to supply chain disruptions, impacting manufacturing and pricing.
- Regulatory uncertainty: Inconsistency in government policies and regulations across different regions creates uncertainty for investors and developers.
- Competition from established energy sources: Existing energy sources pose a significant challenge, particularly in terms of cost competitiveness. This competition requires continual innovation and efficiency improvements.
Forces Driving Energy Storage Market Growth
Several factors are driving market growth including:
- Declining battery costs: The continuous reduction in battery costs is making energy storage solutions more affordable and accessible.
- Government policies supporting renewable energy: Many governments are providing incentives to encourage the adoption of renewable energy and energy storage.
- Increased grid stability requirements: The need for reliable and stable power grids is driving the demand for energy storage.
- Growing demand for off-grid and microgrid solutions: Remote areas and regions with limited access to the main grid are increasingly relying on energy storage solutions.
Long-Term Growth Catalysts in the Energy Storage Market
Long-term growth will be catalyzed by ongoing technological innovation, strategic partnerships between energy storage companies and renewable energy developers, and expansion into new geographic markets, especially in developing countries with high renewable energy potential and rapidly expanding electricity demands. Furthermore, development of more sustainable and ethical sourcing of raw materials will strengthen the industry's overall appeal.
Emerging Opportunities in Energy Storage Market
Emerging opportunities include:
- Integration with smart grids: Energy storage is playing a critical role in enabling the development of smart grids.
- Demand-side management: Energy storage can help manage energy demand, particularly during peak hours.
- Vehicle-to-grid (V2G) technology: The ability to use electric vehicle batteries to provide grid services offers new revenue streams.
- Expansion into new markets: Developing countries present significant growth potential for energy storage.
Leading Players in the Energy Storage Market Sector
- BYD Co Ltd
- Contemporary Amperex Technology Co Limited
- UniEnergy Technologies LLC
- Samsung SDI Co Ltd
- LG Energy Solution Ltd
- NGK Insulators Ltd
- Tesla Inc
- Clarios (Formerly Johnson Controls International PLC)
- GS Yuasa Corporation
Key Milestones in Energy Storage Market Industry
- February 2022: FIMER and Vega Solar partnered to supply 14 PVS-100 inverters to Albania, enhancing decentralized solar systems. This highlights the growing integration of energy storage with renewable energy sources.
- May 2022: Salient Energy's partnership with Horton World Solutions to integrate zinc-ion batteries in residential construction demonstrates the increasing adoption of alternative battery technologies in the residential sector.
Strategic Outlook for Energy Storage Market Market
The future of the energy storage market is bright, driven by several key factors, including the increasing penetration of renewable energy, the need for grid modernization, and the declining cost of energy storage technologies. Strategic opportunities abound for companies that can innovate, develop efficient supply chains, and meet the evolving needs of a rapidly changing energy landscape. The market is poised for substantial growth, with significant opportunities for early adopters and innovative players.
Energy Storage Market Segmentation
-
1. Type
- 1.1. Batteries
- 1.2. Pumped-storage Hydroelectricity (PSH)
- 1.3. Thermal Energy Storage (TES)
- 1.4. Flywheel Energy Storage (FES)
- 1.5. Other Types
-
2. Application
- 2.1. Residential
- 2.2. Commercial and Industrial
Energy Storage Market Segmentation By Geography
-
1. North America
- 1.1. United States
- 1.2. Canada
- 1.3. Rest of North America
-
2. Asia Pacific
- 2.1. India
- 2.2. China
- 2.3. Australia
- 2.4. Rest of Asia Pacific
-
3. Europe
- 3.1. Germany
- 3.2. United Kingdom
- 3.3. Rest of Europe
-
4. South America
- 4.1. Brazil
- 4.2. Argentina
- 4.3. Rest of South America
-
5. Middle East and Africa
- 5.1. Saudi Arabia
- 5.2. Iraq
- 5.3. Jordan
- 5.4. Rest of Middle East and Africa
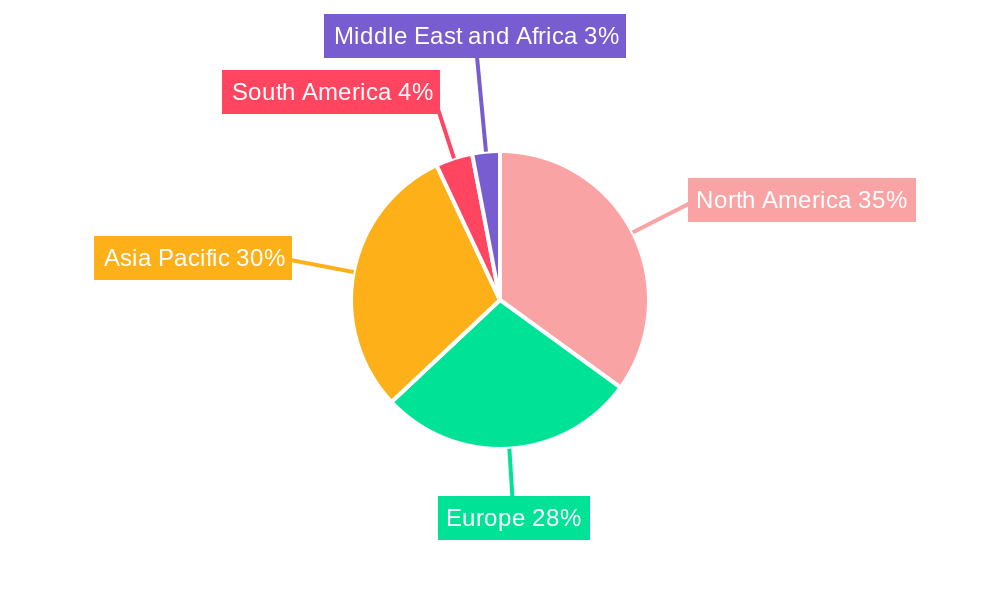
Energy Storage Market Regional Market Share
Geographic Coverage of Energy Storage Market
Energy Storage Market REPORT HIGHLIGHTS
| Aspects | Details |
|---|---|
| Study Period | 2020-2034 |
| Base Year | 2025 |
| Estimated Year | 2026 |
| Forecast Period | 2026-2034 |
| Historical Period | 2020-2025 |
| Growth Rate | CAGR of 14.31% from 2020-2034 |
| Segmentation |
|
Table of Contents
- 1. Introduction
- 1.1. Research Scope
- 1.2. Market Segmentation
- 1.3. Research Objective
- 1.4. Definitions and Assumptions
- 2. Executive Summary
- 2.1. Market Snapshot
- 3. Market Dynamics
- 3.1. Market Drivers
- 3.2. Market Restrains
- 3.3. Market Trends
- 3.4. Market Opportunities
- 4. Market Factor Analysis
- 4.1. Porters Five Forces
- 4.1.1. Bargaining Power of Suppliers
- 4.1.2. Bargaining Power of Buyers
- 4.1.3. Threat of New Entrants
- 4.1.4. Threat of Substitutes
- 4.1.5. Competitive Rivalry
- 4.2. PESTEL analysis
- 4.3. BCG Analysis
- 4.3.1. Stars (High Growth, High Market Share)
- 4.3.2. Cash Cows (Low Growth, High Market Share)
- 4.3.3. Question Mark (High Growth, Low Market Share)
- 4.3.4. Dogs (Low Growth, Low Market Share)
- 4.4. Ansoff Matrix Analysis
- 4.5. Supply Chain Analysis
- 4.6. Regulatory Landscape
- 4.7. Current Market Potential and Opportunity Assessment (TAM–SAM–SOM Framework)
- 4.8. MSR Analyst Note
- 4.1. Porters Five Forces
- 5. Market Analysis, Insights and Forecast 2021-2033
- 5.1. Market Analysis, Insights and Forecast - by Type
- 5.1.1. Batteries
- 5.1.2. Pumped-storage Hydroelectricity (PSH)
- 5.1.3. Thermal Energy Storage (TES)
- 5.1.4. Flywheel Energy Storage (FES)
- 5.1.5. Other Types
- 5.2. Market Analysis, Insights and Forecast - by Application
- 5.2.1. Residential
- 5.2.2. Commercial and Industrial
- 5.3. Market Analysis, Insights and Forecast - by Region
- 5.3.1. North America
- 5.3.2. Asia Pacific
- 5.3.3. Europe
- 5.3.4. South America
- 5.3.5. Middle East and Africa
- 5.1. Market Analysis, Insights and Forecast - by Type
- 6. Global Energy Storage Market Analysis, Insights and Forecast, 2021-2033
- 6.1. Market Analysis, Insights and Forecast - by Type
- 6.1.1. Batteries
- 6.1.2. Pumped-storage Hydroelectricity (PSH)
- 6.1.3. Thermal Energy Storage (TES)
- 6.1.4. Flywheel Energy Storage (FES)
- 6.1.5. Other Types
- 6.2. Market Analysis, Insights and Forecast - by Application
- 6.2.1. Residential
- 6.2.2. Commercial and Industrial
- 6.1. Market Analysis, Insights and Forecast - by Type
- 7. North America Energy Storage Market Analysis, Insights and Forecast, 2020-2032
- 7.1. Market Analysis, Insights and Forecast - by Type
- 7.1.1. Batteries
- 7.1.2. Pumped-storage Hydroelectricity (PSH)
- 7.1.3. Thermal Energy Storage (TES)
- 7.1.4. Flywheel Energy Storage (FES)
- 7.1.5. Other Types
- 7.2. Market Analysis, Insights and Forecast - by Application
- 7.2.1. Residential
- 7.2.2. Commercial and Industrial
- 7.1. Market Analysis, Insights and Forecast - by Type
- 8. Asia Pacific Energy Storage Market Analysis, Insights and Forecast, 2020-2032
- 8.1. Market Analysis, Insights and Forecast - by Type
- 8.1.1. Batteries
- 8.1.2. Pumped-storage Hydroelectricity (PSH)
- 8.1.3. Thermal Energy Storage (TES)
- 8.1.4. Flywheel Energy Storage (FES)
- 8.1.5. Other Types
- 8.2. Market Analysis, Insights and Forecast - by Application
- 8.2.1. Residential
- 8.2.2. Commercial and Industrial
- 8.1. Market Analysis, Insights and Forecast - by Type
- 9. Europe Energy Storage Market Analysis, Insights and Forecast, 2020-2032
- 9.1. Market Analysis, Insights and Forecast - by Type
- 9.1.1. Batteries
- 9.1.2. Pumped-storage Hydroelectricity (PSH)
- 9.1.3. Thermal Energy Storage (TES)
- 9.1.4. Flywheel Energy Storage (FES)
- 9.1.5. Other Types
- 9.2. Market Analysis, Insights and Forecast - by Application
- 9.2.1. Residential
- 9.2.2. Commercial and Industrial
- 9.1. Market Analysis, Insights and Forecast - by Type
- 10. South America Energy Storage Market Analysis, Insights and Forecast, 2020-2032
- 10.1. Market Analysis, Insights and Forecast - by Type
- 10.1.1. Batteries
- 10.1.2. Pumped-storage Hydroelectricity (PSH)
- 10.1.3. Thermal Energy Storage (TES)
- 10.1.4. Flywheel Energy Storage (FES)
- 10.1.5. Other Types
- 10.2. Market Analysis, Insights and Forecast - by Application
- 10.2.1. Residential
- 10.2.2. Commercial and Industrial
- 10.1. Market Analysis, Insights and Forecast - by Type
- 11. Middle East and Africa Energy Storage Market Analysis, Insights and Forecast, 2020-2032
- 11.1. Market Analysis, Insights and Forecast - by Type
- 11.1.1. Batteries
- 11.1.2. Pumped-storage Hydroelectricity (PSH)
- 11.1.3. Thermal Energy Storage (TES)
- 11.1.4. Flywheel Energy Storage (FES)
- 11.1.5. Other Types
- 11.2. Market Analysis, Insights and Forecast - by Application
- 11.2.1. Residential
- 11.2.2. Commercial and Industrial
- 11.1. Market Analysis, Insights and Forecast - by Type
- 12. Competitive Analysis
- 12.1. Company Profiles
- 12.1.1 BYD Co Ltd
- 12.1.1.1. Company Overview
- 12.1.1.2. Products
- 12.1.1.3. Company Financials
- 12.1.1.4. SWOT Analysis
- 12.1.2 Contemporary Amperex Technology Co Limited
- 12.1.2.1. Company Overview
- 12.1.2.2. Products
- 12.1.2.3. Company Financials
- 12.1.2.4. SWOT Analysis
- 12.1.3 UniEnergy Technologies LLC
- 12.1.3.1. Company Overview
- 12.1.3.2. Products
- 12.1.3.3. Company Financials
- 12.1.3.4. SWOT Analysis
- 12.1.4 Samsung SDI Co Ltd
- 12.1.4.1. Company Overview
- 12.1.4.2. Products
- 12.1.4.3. Company Financials
- 12.1.4.4. SWOT Analysis
- 12.1.5 LG Energy Solution Ltd
- 12.1.5.1. Company Overview
- 12.1.5.2. Products
- 12.1.5.3. Company Financials
- 12.1.5.4. SWOT Analysis
- 12.1.6 NGK Insulators Ltd
- 12.1.6.1. Company Overview
- 12.1.6.2. Products
- 12.1.6.3. Company Financials
- 12.1.6.4. SWOT Analysis
- 12.1.7 Tesla Inc *List Not Exhaustive
- 12.1.7.1. Company Overview
- 12.1.7.2. Products
- 12.1.7.3. Company Financials
- 12.1.7.4. SWOT Analysis
- 12.1.8 Clarios (Formerly Johnson Controls International PLC)
- 12.1.8.1. Company Overview
- 12.1.8.2. Products
- 12.1.8.3. Company Financials
- 12.1.8.4. SWOT Analysis
- 12.1.9 GS Yuasa Corporation
- 12.1.9.1. Company Overview
- 12.1.9.2. Products
- 12.1.9.3. Company Financials
- 12.1.9.4. SWOT Analysis
- 12.1.1 BYD Co Ltd
- 12.2. Market Entropy
- 12.2.1 Company's Key Areas Served
- 12.2.2 Recent Developments
- 12.3. Company Market Share Analysis 2025
- 12.3.1 Top 5 Companies Market Share Analysis
- 12.3.2 Top 3 Companies Market Share Analysis
- 12.4. List of Potential Customers
- 13. Research Methodology
List of Figures
- Figure 1: Global Energy Storage Market Revenue Breakdown (Million, %) by Region 2025 & 2033
- Figure 2: Global Energy Storage Market Volume Breakdown (K Unit, %) by Region 2025 & 2033
- Figure 3: North America Energy Storage Market Revenue (Million), by Type 2025 & 2033
- Figure 4: North America Energy Storage Market Volume (K Unit), by Type 2025 & 2033
- Figure 5: North America Energy Storage Market Revenue Share (%), by Type 2025 & 2033
- Figure 6: North America Energy Storage Market Volume Share (%), by Type 2025 & 2033
- Figure 7: North America Energy Storage Market Revenue (Million), by Application 2025 & 2033
- Figure 8: North America Energy Storage Market Volume (K Unit), by Application 2025 & 2033
- Figure 9: North America Energy Storage Market Revenue Share (%), by Application 2025 & 2033
- Figure 10: North America Energy Storage Market Volume Share (%), by Application 2025 & 2033
- Figure 11: North America Energy Storage Market Revenue (Million), by Country 2025 & 2033
- Figure 12: North America Energy Storage Market Volume (K Unit), by Country 2025 & 2033
- Figure 13: North America Energy Storage Market Revenue Share (%), by Country 2025 & 2033
- Figure 14: North America Energy Storage Market Volume Share (%), by Country 2025 & 2033
- Figure 15: Asia Pacific Energy Storage Market Revenue (Million), by Type 2025 & 2033
- Figure 16: Asia Pacific Energy Storage Market Volume (K Unit), by Type 2025 & 2033
- Figure 17: Asia Pacific Energy Storage Market Revenue Share (%), by Type 2025 & 2033
- Figure 18: Asia Pacific Energy Storage Market Volume Share (%), by Type 2025 & 2033
- Figure 19: Asia Pacific Energy Storage Market Revenue (Million), by Application 2025 & 2033
- Figure 20: Asia Pacific Energy Storage Market Volume (K Unit), by Application 2025 & 2033
- Figure 21: Asia Pacific Energy Storage Market Revenue Share (%), by Application 2025 & 2033
- Figure 22: Asia Pacific Energy Storage Market Volume Share (%), by Application 2025 & 2033
- Figure 23: Asia Pacific Energy Storage Market Revenue (Million), by Country 2025 & 2033
- Figure 24: Asia Pacific Energy Storage Market Volume (K Unit), by Country 2025 & 2033
- Figure 25: Asia Pacific Energy Storage Market Revenue Share (%), by Country 2025 & 2033
- Figure 26: Asia Pacific Energy Storage Market Volume Share (%), by Country 2025 & 2033
- Figure 27: Europe Energy Storage Market Revenue (Million), by Type 2025 & 2033
- Figure 28: Europe Energy Storage Market Volume (K Unit), by Type 2025 & 2033
- Figure 29: Europe Energy Storage Market Revenue Share (%), by Type 2025 & 2033
- Figure 30: Europe Energy Storage Market Volume Share (%), by Type 2025 & 2033
- Figure 31: Europe Energy Storage Market Revenue (Million), by Application 2025 & 2033
- Figure 32: Europe Energy Storage Market Volume (K Unit), by Application 2025 & 2033
- Figure 33: Europe Energy Storage Market Revenue Share (%), by Application 2025 & 2033
- Figure 34: Europe Energy Storage Market Volume Share (%), by Application 2025 & 2033
- Figure 35: Europe Energy Storage Market Revenue (Million), by Country 2025 & 2033
- Figure 36: Europe Energy Storage Market Volume (K Unit), by Country 2025 & 2033
- Figure 37: Europe Energy Storage Market Revenue Share (%), by Country 2025 & 2033
- Figure 38: Europe Energy Storage Market Volume Share (%), by Country 2025 & 2033
- Figure 39: South America Energy Storage Market Revenue (Million), by Type 2025 & 2033
- Figure 40: South America Energy Storage Market Volume (K Unit), by Type 2025 & 2033
- Figure 41: South America Energy Storage Market Revenue Share (%), by Type 2025 & 2033
- Figure 42: South America Energy Storage Market Volume Share (%), by Type 2025 & 2033
- Figure 43: South America Energy Storage Market Revenue (Million), by Application 2025 & 2033
- Figure 44: South America Energy Storage Market Volume (K Unit), by Application 2025 & 2033
- Figure 45: South America Energy Storage Market Revenue Share (%), by Application 2025 & 2033
- Figure 46: South America Energy Storage Market Volume Share (%), by Application 2025 & 2033
- Figure 47: South America Energy Storage Market Revenue (Million), by Country 2025 & 2033
- Figure 48: South America Energy Storage Market Volume (K Unit), by Country 2025 & 2033
- Figure 49: South America Energy Storage Market Revenue Share (%), by Country 2025 & 2033
- Figure 50: South America Energy Storage Market Volume Share (%), by Country 2025 & 2033
- Figure 51: Middle East and Africa Energy Storage Market Revenue (Million), by Type 2025 & 2033
- Figure 52: Middle East and Africa Energy Storage Market Volume (K Unit), by Type 2025 & 2033
- Figure 53: Middle East and Africa Energy Storage Market Revenue Share (%), by Type 2025 & 2033
- Figure 54: Middle East and Africa Energy Storage Market Volume Share (%), by Type 2025 & 2033
- Figure 55: Middle East and Africa Energy Storage Market Revenue (Million), by Application 2025 & 2033
- Figure 56: Middle East and Africa Energy Storage Market Volume (K Unit), by Application 2025 & 2033
- Figure 57: Middle East and Africa Energy Storage Market Revenue Share (%), by Application 2025 & 2033
- Figure 58: Middle East and Africa Energy Storage Market Volume Share (%), by Application 2025 & 2033
- Figure 59: Middle East and Africa Energy Storage Market Revenue (Million), by Country 2025 & 2033
- Figure 60: Middle East and Africa Energy Storage Market Volume (K Unit), by Country 2025 & 2033
- Figure 61: Middle East and Africa Energy Storage Market Revenue Share (%), by Country 2025 & 2033
- Figure 62: Middle East and Africa Energy Storage Market Volume Share (%), by Country 2025 & 2033
List of Tables
- Table 1: Global Energy Storage Market Revenue Million Forecast, by Type 2020 & 2033
- Table 2: Global Energy Storage Market Volume K Unit Forecast, by Type 2020 & 2033
- Table 3: Global Energy Storage Market Revenue Million Forecast, by Application 2020 & 2033
- Table 4: Global Energy Storage Market Volume K Unit Forecast, by Application 2020 & 2033
- Table 5: Global Energy Storage Market Revenue Million Forecast, by Region 2020 & 2033
- Table 6: Global Energy Storage Market Volume K Unit Forecast, by Region 2020 & 2033
- Table 7: Global Energy Storage Market Revenue Million Forecast, by Type 2020 & 2033
- Table 8: Global Energy Storage Market Volume K Unit Forecast, by Type 2020 & 2033
- Table 9: Global Energy Storage Market Revenue Million Forecast, by Application 2020 & 2033
- Table 10: Global Energy Storage Market Volume K Unit Forecast, by Application 2020 & 2033
- Table 11: Global Energy Storage Market Revenue Million Forecast, by Country 2020 & 2033
- Table 12: Global Energy Storage Market Volume K Unit Forecast, by Country 2020 & 2033
- Table 13: United States Energy Storage Market Revenue (Million) Forecast, by Application 2020 & 2033
- Table 14: United States Energy Storage Market Volume (K Unit) Forecast, by Application 2020 & 2033
- Table 15: Canada Energy Storage Market Revenue (Million) Forecast, by Application 2020 & 2033
- Table 16: Canada Energy Storage Market Volume (K Unit) Forecast, by Application 2020 & 2033
- Table 17: Rest of North America Energy Storage Market Revenue (Million) Forecast, by Application 2020 & 2033
- Table 18: Rest of North America Energy Storage Market Volume (K Unit) Forecast, by Application 2020 & 2033
- Table 19: Global Energy Storage Market Revenue Million Forecast, by Type 2020 & 2033
- Table 20: Global Energy Storage Market Volume K Unit Forecast, by Type 2020 & 2033
- Table 21: Global Energy Storage Market Revenue Million Forecast, by Application 2020 & 2033
- Table 22: Global Energy Storage Market Volume K Unit Forecast, by Application 2020 & 2033
- Table 23: Global Energy Storage Market Revenue Million Forecast, by Country 2020 & 2033
- Table 24: Global Energy Storage Market Volume K Unit Forecast, by Country 2020 & 2033
- Table 25: India Energy Storage Market Revenue (Million) Forecast, by Application 2020 & 2033
- Table 26: India Energy Storage Market Volume (K Unit) Forecast, by Application 2020 & 2033
- Table 27: China Energy Storage Market Revenue (Million) Forecast, by Application 2020 & 2033
- Table 28: China Energy Storage Market Volume (K Unit) Forecast, by Application 2020 & 2033
- Table 29: Australia Energy Storage Market Revenue (Million) Forecast, by Application 2020 & 2033
- Table 30: Australia Energy Storage Market Volume (K Unit) Forecast, by Application 2020 & 2033
- Table 31: Rest of Asia Pacific Energy Storage Market Revenue (Million) Forecast, by Application 2020 & 2033
- Table 32: Rest of Asia Pacific Energy Storage Market Volume (K Unit) Forecast, by Application 2020 & 2033
- Table 33: Global Energy Storage Market Revenue Million Forecast, by Type 2020 & 2033
- Table 34: Global Energy Storage Market Volume K Unit Forecast, by Type 2020 & 2033
- Table 35: Global Energy Storage Market Revenue Million Forecast, by Application 2020 & 2033
- Table 36: Global Energy Storage Market Volume K Unit Forecast, by Application 2020 & 2033
- Table 37: Global Energy Storage Market Revenue Million Forecast, by Country 2020 & 2033
- Table 38: Global Energy Storage Market Volume K Unit Forecast, by Country 2020 & 2033
- Table 39: Germany Energy Storage Market Revenue (Million) Forecast, by Application 2020 & 2033
- Table 40: Germany Energy Storage Market Volume (K Unit) Forecast, by Application 2020 & 2033
- Table 41: United Kingdom Energy Storage Market Revenue (Million) Forecast, by Application 2020 & 2033
- Table 42: United Kingdom Energy Storage Market Volume (K Unit) Forecast, by Application 2020 & 2033
- Table 43: Rest of Europe Energy Storage Market Revenue (Million) Forecast, by Application 2020 & 2033
- Table 44: Rest of Europe Energy Storage Market Volume (K Unit) Forecast, by Application 2020 & 2033
- Table 45: Global Energy Storage Market Revenue Million Forecast, by Type 2020 & 2033
- Table 46: Global Energy Storage Market Volume K Unit Forecast, by Type 2020 & 2033
- Table 47: Global Energy Storage Market Revenue Million Forecast, by Application 2020 & 2033
- Table 48: Global Energy Storage Market Volume K Unit Forecast, by Application 2020 & 2033
- Table 49: Global Energy Storage Market Revenue Million Forecast, by Country 2020 & 2033
- Table 50: Global Energy Storage Market Volume K Unit Forecast, by Country 2020 & 2033
- Table 51: Brazil Energy Storage Market Revenue (Million) Forecast, by Application 2020 & 2033
- Table 52: Brazil Energy Storage Market Volume (K Unit) Forecast, by Application 2020 & 2033
- Table 53: Argentina Energy Storage Market Revenue (Million) Forecast, by Application 2020 & 2033
- Table 54: Argentina Energy Storage Market Volume (K Unit) Forecast, by Application 2020 & 2033
- Table 55: Rest of South America Energy Storage Market Revenue (Million) Forecast, by Application 2020 & 2033
- Table 56: Rest of South America Energy Storage Market Volume (K Unit) Forecast, by Application 2020 & 2033
- Table 57: Global Energy Storage Market Revenue Million Forecast, by Type 2020 & 2033
- Table 58: Global Energy Storage Market Volume K Unit Forecast, by Type 2020 & 2033
- Table 59: Global Energy Storage Market Revenue Million Forecast, by Application 2020 & 2033
- Table 60: Global Energy Storage Market Volume K Unit Forecast, by Application 2020 & 2033
- Table 61: Global Energy Storage Market Revenue Million Forecast, by Country 2020 & 2033
- Table 62: Global Energy Storage Market Volume K Unit Forecast, by Country 2020 & 2033
- Table 63: Saudi Arabia Energy Storage Market Revenue (Million) Forecast, by Application 2020 & 2033
- Table 64: Saudi Arabia Energy Storage Market Volume (K Unit) Forecast, by Application 2020 & 2033
- Table 65: Iraq Energy Storage Market Revenue (Million) Forecast, by Application 2020 & 2033
- Table 66: Iraq Energy Storage Market Volume (K Unit) Forecast, by Application 2020 & 2033
- Table 67: Jordan Energy Storage Market Revenue (Million) Forecast, by Application 2020 & 2033
- Table 68: Jordan Energy Storage Market Volume (K Unit) Forecast, by Application 2020 & 2033
- Table 69: Rest of Middle East and Africa Energy Storage Market Revenue (Million) Forecast, by Application 2020 & 2033
- Table 70: Rest of Middle East and Africa Energy Storage Market Volume (K Unit) Forecast, by Application 2020 & 2033
Frequently Asked Questions
1. What is the projected Compound Annual Growth Rate (CAGR) of the Energy Storage Market?
The projected CAGR is approximately 14.31%.
2. Which companies are prominent players in the Energy Storage Market?
Key companies in the market include BYD Co Ltd, Contemporary Amperex Technology Co Limited, UniEnergy Technologies LLC, Samsung SDI Co Ltd, LG Energy Solution Ltd, NGK Insulators Ltd, Tesla Inc *List Not Exhaustive, Clarios (Formerly Johnson Controls International PLC), GS Yuasa Corporation.
3. What are the main segments of the Energy Storage Market?
The market segments include Type, Application.
4. Can you provide details about the market size?
The market size is estimated to be USD 51.10 Million as of 2022.
5. What are some drivers contributing to market growth?
Rising Supporting Government Policies for Solar Energy in South Africa4.; Increasing Investment in Renewable Energy Such as Solar. Wind. and Others.
6. What are the notable trends driving market growth?
Batteries Segment to Dominate the Market.
7. Are there any restraints impacting market growth?
Increasing Adoption of Alternate Renewable Technologies Such as Wind.
8. Can you provide examples of recent developments in the market?
February 2022: The partnership between FIMER and Vega Solar supplied 14 PVS-100 inverters, a three-phase string solution, to Albania. The PVS-100/120-TL is a cloud-connected three-phase string inverter by FIMER designed for cost-effective decentralized solar systems on both ground and rooftops.
9. What pricing options are available for accessing the report?
Pricing options include single-user, multi-user, and enterprise licenses priced at USD 4750, USD 5250, and USD 8750 respectively.
10. Is the market size provided in terms of value or volume?
The market size is provided in terms of value, measured in Million and volume, measured in K Unit.
11. Are there any specific market keywords associated with the report?
Yes, the market keyword associated with the report is "Energy Storage Market," which aids in identifying and referencing the specific market segment covered.
12. How do I determine which pricing option suits my needs best?
The pricing options vary based on user requirements and access needs. Individual users may opt for single-user licenses, while businesses requiring broader access may choose multi-user or enterprise licenses for cost-effective access to the report.
13. Are there any additional resources or data provided in the Energy Storage Market report?
While the report offers comprehensive insights, it's advisable to review the specific contents or supplementary materials provided to ascertain if additional resources or data are available.
14. How can I stay updated on further developments or reports in the Energy Storage Market?
To stay informed about further developments, trends, and reports in the Energy Storage Market, consider subscribing to industry newsletters, following relevant companies and organizations, or regularly checking reputable industry news sources and publications.
Methodology
Step 1 - Identification of Relevant Samples Size from Population Database


Step 2 - Approaches for Defining Global Market Size (Value, Volume* & Price*)

Note*: In applicable scenarios
Step 3 - Data Sources
Primary Research
- Web Analytics
- Survey Reports
- Research Institute
- Latest Research Reports
- Opinion Leaders
Secondary Research
- Annual Reports
- White Paper
- Latest Press Release
- Industry Association
- Paid Database
- Investor Presentations

Step 4 - Data Triangulation
Involves using different sources of information in order to increase the validity of a study
These sources are likely to be stakeholders in a program - participants, other researchers, program staff, other community members, and so on.
Then we put all data in single framework & apply various statistical tools to find out the dynamic on the market.
During the analysis stage, feedback from the stakeholder groups would be compared to determine areas of agreement as well as areas of divergence