

Key Insights
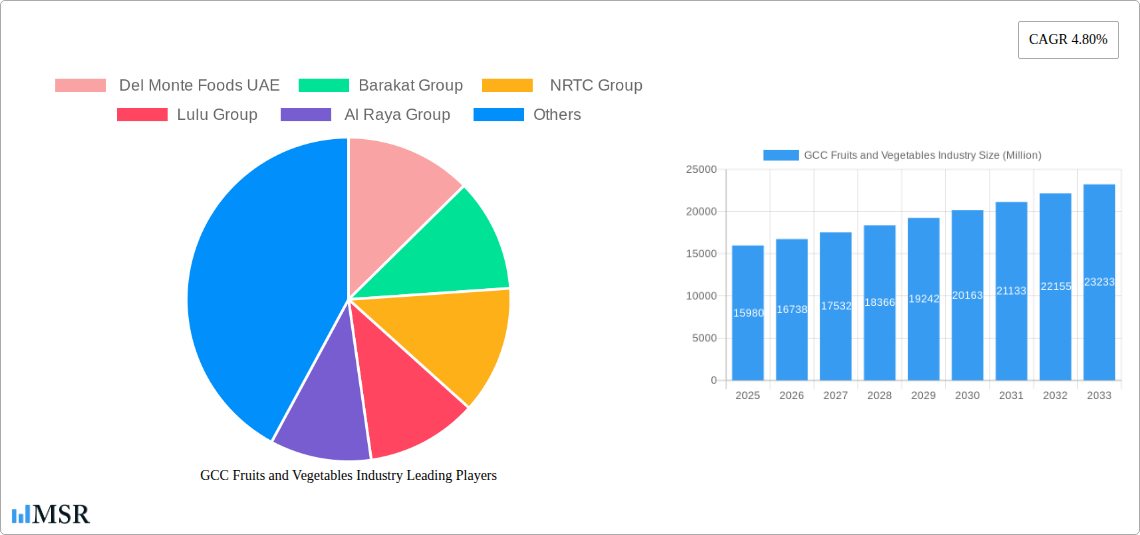
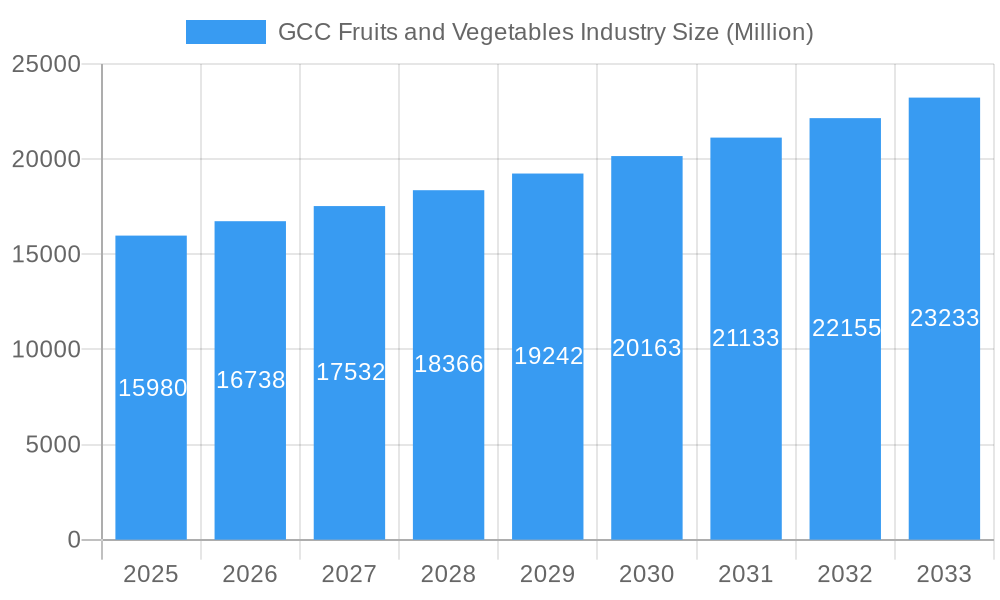
The GCC fruits and vegetables market, valued at $15.98 billion in 2025, is projected to experience robust growth, driven by a rising population, increasing disposable incomes, and a growing preference for healthy diets. The market's Compound Annual Growth Rate (CAGR) of 4.80% from 2025 to 2033 indicates a significant expansion opportunity. Key growth drivers include the increasing prevalence of supermarkets and hypermarkets offering a wider variety of fresh produce, coupled with the rapid expansion of e-commerce platforms providing convenient access to fruits and vegetables. The processed fruits and vegetables segment is expected to witness significant growth due to its convenience and longer shelf life, catering to busy lifestyles. However, challenges such as fluctuating prices due to seasonality and weather patterns, and potential supply chain disruptions, could pose restraints on market growth. Furthermore, maintaining product quality and addressing food safety concerns are critical for sustained growth. The segment breakdown highlights a strong contribution from household consumption, followed by the food processing and restaurant sectors. Major players like Del Monte Foods UAE, Barakat Group, and Lulu Group are strategically positioning themselves to capitalize on these trends, investing in improved supply chains and expanding product offerings.
GCC Fruits and Vegetables Industry Market Size (In Billion)
The diverse range of distribution channels, including traditional markets, supermarkets, e-commerce platforms, and wholesale markets, signifies the market's dynamism. Regional variations are expected, with high-growth potential in rapidly urbanizing areas. The increasing demand for organic and locally sourced produce presents a substantial opportunity for niche players. Furthermore, government initiatives promoting sustainable agriculture and food security are expected to support market growth. However, effective strategies are needed to minimize food waste, improve cold chain infrastructure, and address potential labor shortages within the agricultural sector. The market's continued success hinges on its ability to adapt to evolving consumer preferences, embrace innovative technologies, and maintain a robust and sustainable supply chain.
GCC Fruits and Vegetables Industry Company Market Share
GCC Fruits and Vegetables Industry: A Comprehensive Market Report (2019-2033)
This in-depth report provides a comprehensive analysis of the GCC fruits and vegetables industry, offering valuable insights for stakeholders, investors, and industry professionals. With a focus on market dynamics, key players, and future trends, this report covers the period from 2019 to 2033, with a base year of 2025. The study encompasses a detailed examination of market size, growth drivers, challenges, and opportunities within the GCC region. The report analyzes the historical period (2019-2024), the estimated year (2025), and forecasts the market's trajectory until 2033. Expect actionable insights into market segmentation, product developments, and competitive landscape. Discover the growth potential in fresh fruits, fresh vegetables, and processed fruits and vegetables across supermarkets, traditional markets, e-commerce, and wholesale channels. Understand the end-use dynamics across household consumption, food processing, and the restaurant and catering sectors. The market value for 2025 is estimated at xx Million, demonstrating significant growth potential.
GCC Fruits and Vegetables Industry Market Concentration & Dynamics
The GCC fruits and vegetables market exhibits a moderately concentrated landscape, with a few key players holding significant market share. Del Monte Foods UAE, Barakat Group, NRTC Group, Lulu Group, Al Raya Group, Al-Futtaim Group, Al Bakrawe Group, Fresh Fruits Company, SPAR, and Carrefour are among the prominent players, each with varying degrees of market penetration across different segments.
- Market Share: The top 5 players collectively account for approximately xx% of the total market share in 2025. Precise figures vary based on segment and product type.
- Innovation Ecosystems: The industry is witnessing increased innovation in areas like sustainable farming practices, packaging technology, and cold chain logistics.
- Regulatory Frameworks: Government regulations pertaining to food safety, labeling, and import/export processes significantly influence market dynamics. These regulations vary across the GCC countries.
- Substitute Products: Competition exists from imported fruits and vegetables, as well as domestically produced alternatives. The demand for organic and locally sourced produce is a growing factor.
- End-User Trends: Changing consumer preferences, including a growing preference for healthier, convenient, and sustainably produced food, are shaping market demand.
- M&A Activities: The number of mergers and acquisitions within the industry has been xx in the historical period, indicating a moderate level of consolidation.
GCC Fruits and Vegetables Industry Industry Insights & Trends
The GCC fruits and vegetables market is characterized by robust growth, driven by several key factors. The market size is projected to reach xx Million by 2033, representing a CAGR of xx% during the forecast period (2025-2033). This growth is fueled by factors including a rising population, increasing disposable incomes, rapid urbanization, and evolving dietary habits. Technological advancements in agriculture, supply chain management, and retail are further driving market expansion. Consumer behavior is shifting towards convenience, health consciousness, and a preference for ready-to-eat options. This is reflected in the increasing demand for processed fruits and vegetables and the expansion of e-commerce platforms for grocery shopping.
Key Markets & Segments Leading GCC Fruits and Vegetables Industry
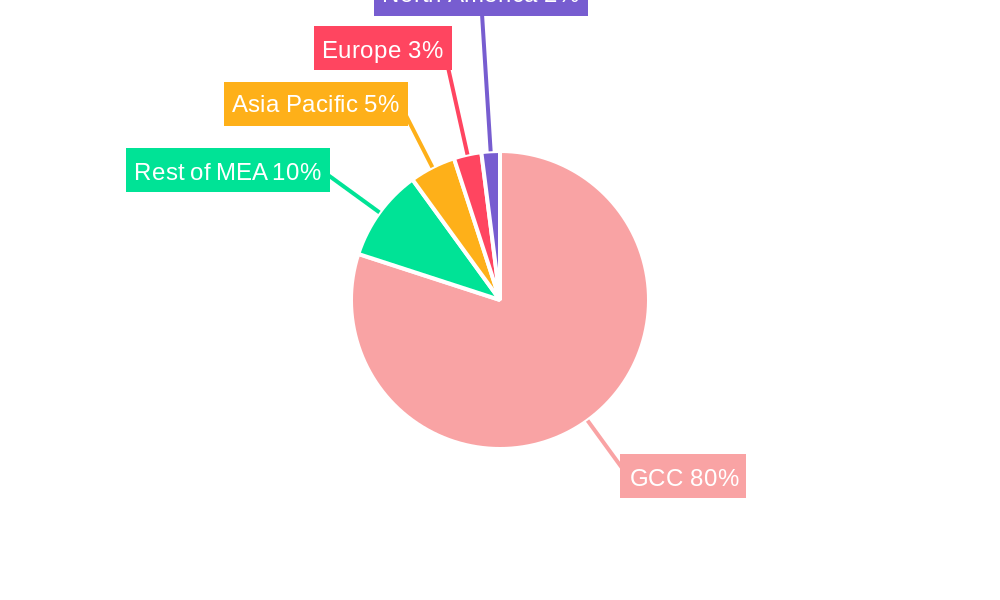
The UAE and Saudi Arabia represent the largest markets within the GCC region, driven by higher population densities, increased disposable incomes, and robust retail infrastructure.
Dominant Segments:
- Product Type: Fresh fruits and vegetables dominate the market, but the processed fruits and vegetables segment is experiencing rapid growth.
- Distribution Channel: Supermarkets and hypermarkets are the primary distribution channels, followed by traditional markets and wholesale markets. E-commerce is emerging as a significant channel.
- End-Use: Household consumption accounts for the largest share, while the food processing and restaurant and catering sectors are also growing.
Drivers:
- Economic Growth: Increasing disposable incomes across the GCC countries drive demand for higher-quality and diversified products.
- Infrastructure Development: Improved cold chain logistics and retail infrastructure are supporting the growth of the fresh produce market.
- Tourism: The growing tourism sector in the GCC is further boosting demand.
The dominance of supermarkets and hypermarkets is attributed to their organized retail formats, wide product selection, and convenient shopping experiences. Traditional markets remain significant, particularly for price-sensitive consumers. E-commerce is rapidly gaining traction, fueled by increasing internet penetration and the convenience of online shopping.
GCC Fruits and Vegetables Industry Product Developments
The industry is witnessing continuous innovation in product offerings, particularly in terms of packaging, shelf life extension, and value-added products. Technological advancements are enabling the development of innovative packaging solutions that enhance product freshness and reduce waste. The emphasis is shifting towards convenient, ready-to-eat options, catering to the busy lifestyles of consumers. Processed fruits and vegetables are gaining popularity due to their longer shelf life and convenience. The use of new preservation techniques also allows for a wider variety of produce.
Challenges in the GCC Fruits and Vegetables Industry Market
The GCC fruits and vegetables industry faces challenges related to supply chain management, including maintaining product freshness and preventing spoilage. Regulatory compliance, including food safety standards, can be complex and costly. Competition from imported products, particularly from countries with lower production costs, also poses a challenge. The impact of these challenges on market profitability can be significant, estimated at xx Million in losses annually.
Forces Driving GCC Fruits and Vegetables Industry Growth
Several factors contribute to the long-term growth of the GCC fruits and vegetables industry. These include increasing demand for healthy and convenient food options, technological advancements in agriculture and logistics, and supportive government policies. Growing tourism and a rising middle class also add to this positive growth trajectory. The economic diversification strategies adopted by GCC countries are also supportive to the sector.
Challenges in the GCC Fruits and Vegetables Industry Market
Despite facing current challenges, the long-term growth of the GCC fruits and vegetables market is promising. Continuous innovation in agriculture and post-harvest technologies, along with strategic partnerships between producers and retailers, are expected to drive future growth. The industry is well-positioned to capitalize on the increasing demand for healthy and convenient food options.
Emerging Opportunities in GCC Fruits and Vegetables Industry
Emerging opportunities exist in the organic and locally sourced produce segment, with growing consumer interest in sustainable and healthy food. The expansion of e-commerce platforms for grocery shopping presents further opportunities for growth, while innovative packaging and shelf-life extension technologies offer a chance to enhance product quality and reduce waste. The growing food processing industry also presents a promising area for expansion.
Leading Players in the GCC Fruits and Vegetables Industry Sector
- Del Monte Foods UAE
- Barakat Group
- NRTC Group
- Lulu Group
- Al Raya Group
- Al-Futtaim Group
- Al Bakrawe Group
- Fresh Fruits Company
- SPAR
- Carrefour
Key Milestones in GCC Fruits and Vegetables Industry Industry
- February 2024: Lulu Group opened its 23rd hypermarket in Doha Mall, Qatar, expanding its fresh produce offerings and launching the Lulu Happiness loyalty program. This significantly impacted market share and consumer loyalty in Qatar.
- February 2024: SPAR opened its 28th outlet in Al Muna Bousher, Oman, strengthening its presence in the local market and increasing its offerings of fresh fruits and vegetables. This expanded market reach in Oman.
- February 2024: Carrefour launched its 'Choose Better' program in Expo City, promoting healthier and sustainable choices, potentially influencing consumer preferences and market trends. This initiative aimed at improving brand image and attracting health-conscious shoppers.
Strategic Outlook for GCC Fruits and Vegetables Industry Market
The GCC fruits and vegetables industry holds significant growth potential, driven by increasing demand, technological advancements, and supportive government policies. Strategic partnerships, investments in sustainable agriculture, and the expansion of e-commerce channels will be critical to capitalizing on this potential. Focus on innovation, particularly in areas such as packaging technology, cold chain logistics and value-added products, will be key to maintaining a competitive edge.
GCC Fruits and Vegetables Industry Segmentation
- 1. Production Analysis
- 2. Consumption Analysis
- 3. Import Market Analysis (Value & Volume)
- 4. Export Market Analysis (Value & Volume)
- 5. Price Trend Analysis
GCC Fruits and Vegetables Industry Segmentation By Geography
-
1. United Arab Emirates
- 1.1. Fruits
- 1.2. Vegetables
-
2. Bahrain
- 2.1. Fruits
- 2.2. Vegetables
-
3. Kuwait
- 3.1. Fruits
- 3.2. Vegetables
-
4. Oman
- 4.1. Fruits
- 4.2. Vegetables
-
5. Qatar
- 5.1. Fruits
- 5.2. Vegetables
-
6. Saudi Arabia
- 6.1. Fruits
- 6.2. Vegetables
GCC Fruits and Vegetables Industry Regional Market Share
Geographic Coverage of GCC Fruits and Vegetables Industry
GCC Fruits and Vegetables Industry REPORT HIGHLIGHTS
| Aspects | Details |
|---|---|
| Study Period | 2020-2034 |
| Base Year | 2025 |
| Estimated Year | 2026 |
| Forecast Period | 2026-2034 |
| Historical Period | 2020-2025 |
| Growth Rate | CAGR of 4.80% from 2020-2034 |
| Segmentation |
|
Table of Contents
- 1. Introduction
- 1.1. Research Scope
- 1.2. Market Segmentation
- 1.3. Research Objective
- 1.4. Definitions and Assumptions
- 2. Executive Summary
- 2.1. Market Snapshot
- 3. Market Dynamics
- 3.1. Market Drivers
- 3.2. Market Restrains
- 3.3. Market Trends
- 3.4. Market Opportunities
- 4. Market Factor Analysis
- 4.1. Porters Five Forces
- 4.1.1. Bargaining Power of Suppliers
- 4.1.2. Bargaining Power of Buyers
- 4.1.3. Threat of New Entrants
- 4.1.4. Threat of Substitutes
- 4.1.5. Competitive Rivalry
- 4.2. PESTEL analysis
- 4.3. BCG Analysis
- 4.3.1. Stars (High Growth, High Market Share)
- 4.3.2. Cash Cows (Low Growth, High Market Share)
- 4.3.3. Question Mark (High Growth, Low Market Share)
- 4.3.4. Dogs (Low Growth, Low Market Share)
- 4.4. Ansoff Matrix Analysis
- 4.5. Supply Chain Analysis
- 4.6. Regulatory Landscape
- 4.7. Current Market Potential and Opportunity Assessment (TAM–SAM–SOM Framework)
- 4.8. MSR Analyst Note
- 4.1. Porters Five Forces
- 5. Market Analysis, Insights and Forecast 2021-2033
- 5.1. Market Analysis, Insights and Forecast - by Production Analysis
- 5.2. Market Analysis, Insights and Forecast - by Consumption Analysis
- 5.3. Market Analysis, Insights and Forecast - by Import Market Analysis (Value & Volume)
- 5.4. Market Analysis, Insights and Forecast - by Export Market Analysis (Value & Volume)
- 5.5. Market Analysis, Insights and Forecast - by Price Trend Analysis
- 5.6. Market Analysis, Insights and Forecast - by Region
- 5.6.1. United Arab Emirates
- 5.6.2. Bahrain
- 5.6.3. Kuwait
- 5.6.4. Oman
- 5.6.5. Qatar
- 5.6.6. Saudi Arabia
- 6. Global GCC Fruits and Vegetables Industry Analysis, Insights and Forecast, 2021-2033
- 6.1. Market Analysis, Insights and Forecast - by Production Analysis
- 6.2. Market Analysis, Insights and Forecast - by Consumption Analysis
- 6.3. Market Analysis, Insights and Forecast - by Import Market Analysis (Value & Volume)
- 6.4. Market Analysis, Insights and Forecast - by Export Market Analysis (Value & Volume)
- 6.5. Market Analysis, Insights and Forecast - by Price Trend Analysis
- 7. United Arab Emirates GCC Fruits and Vegetables Industry Analysis, Insights and Forecast, 2020-2032
- 7.1. Market Analysis, Insights and Forecast - by Production Analysis
- 7.2. Market Analysis, Insights and Forecast - by Consumption Analysis
- 7.3. Market Analysis, Insights and Forecast - by Import Market Analysis (Value & Volume)
- 7.4. Market Analysis, Insights and Forecast - by Export Market Analysis (Value & Volume)
- 7.5. Market Analysis, Insights and Forecast - by Price Trend Analysis
- 8. Bahrain GCC Fruits and Vegetables Industry Analysis, Insights and Forecast, 2020-2032
- 8.1. Market Analysis, Insights and Forecast - by Production Analysis
- 8.2. Market Analysis, Insights and Forecast - by Consumption Analysis
- 8.3. Market Analysis, Insights and Forecast - by Import Market Analysis (Value & Volume)
- 8.4. Market Analysis, Insights and Forecast - by Export Market Analysis (Value & Volume)
- 8.5. Market Analysis, Insights and Forecast - by Price Trend Analysis
- 9. Kuwait GCC Fruits and Vegetables Industry Analysis, Insights and Forecast, 2020-2032
- 9.1. Market Analysis, Insights and Forecast - by Production Analysis
- 9.2. Market Analysis, Insights and Forecast - by Consumption Analysis
- 9.3. Market Analysis, Insights and Forecast - by Import Market Analysis (Value & Volume)
- 9.4. Market Analysis, Insights and Forecast - by Export Market Analysis (Value & Volume)
- 9.5. Market Analysis, Insights and Forecast - by Price Trend Analysis
- 10. Oman GCC Fruits and Vegetables Industry Analysis, Insights and Forecast, 2020-2032
- 10.1. Market Analysis, Insights and Forecast - by Production Analysis
- 10.2. Market Analysis, Insights and Forecast - by Consumption Analysis
- 10.3. Market Analysis, Insights and Forecast - by Import Market Analysis (Value & Volume)
- 10.4. Market Analysis, Insights and Forecast - by Export Market Analysis (Value & Volume)
- 10.5. Market Analysis, Insights and Forecast - by Price Trend Analysis
- 11. Qatar GCC Fruits and Vegetables Industry Analysis, Insights and Forecast, 2020-2032
- 11.1. Market Analysis, Insights and Forecast - by Production Analysis
- 11.2. Market Analysis, Insights and Forecast - by Consumption Analysis
- 11.3. Market Analysis, Insights and Forecast - by Import Market Analysis (Value & Volume)
- 11.4. Market Analysis, Insights and Forecast - by Export Market Analysis (Value & Volume)
- 11.5. Market Analysis, Insights and Forecast - by Price Trend Analysis
- 12. Saudi Arabia GCC Fruits and Vegetables Industry Analysis, Insights and Forecast, 2020-2032
- 12.1. Market Analysis, Insights and Forecast - by Production Analysis
- 12.2. Market Analysis, Insights and Forecast - by Consumption Analysis
- 12.3. Market Analysis, Insights and Forecast - by Import Market Analysis (Value & Volume)
- 12.4. Market Analysis, Insights and Forecast - by Export Market Analysis (Value & Volume)
- 12.5. Market Analysis, Insights and Forecast - by Price Trend Analysis
- 13. Competitive Analysis
- 13.1. Company Profiles
- 13.1.1 Del Monte Foods UAE
- 13.1.1.1. Company Overview
- 13.1.1.2. Products
- 13.1.1.3. Company Financials
- 13.1.1.4. SWOT Analysis
- 13.1.2 Barakat Group
- 13.1.2.1. Company Overview
- 13.1.2.2. Products
- 13.1.2.3. Company Financials
- 13.1.2.4. SWOT Analysis
- 13.1.3 NRTC Group
- 13.1.3.1. Company Overview
- 13.1.3.2. Products
- 13.1.3.3. Company Financials
- 13.1.3.4. SWOT Analysis
- 13.1.4 Lulu Group
- 13.1.4.1. Company Overview
- 13.1.4.2. Products
- 13.1.4.3. Company Financials
- 13.1.4.4. SWOT Analysis
- 13.1.5 Al Raya Group
- 13.1.5.1. Company Overview
- 13.1.5.2. Products
- 13.1.5.3. Company Financials
- 13.1.5.4. SWOT Analysis
- 13.1.6 Al-Futtaim Group
- 13.1.6.1. Company Overview
- 13.1.6.2. Products
- 13.1.6.3. Company Financials
- 13.1.6.4. SWOT Analysis
- 13.1.7 Al Bakrawe Group
- 13.1.7.1. Company Overview
- 13.1.7.2. Products
- 13.1.7.3. Company Financials
- 13.1.7.4. SWOT Analysis
- 13.1.8 Fresh Fruits Company
- 13.1.8.1. Company Overview
- 13.1.8.2. Products
- 13.1.8.3. Company Financials
- 13.1.8.4. SWOT Analysis
- 13.1.9 SPAR
- 13.1.9.1. Company Overview
- 13.1.9.2. Products
- 13.1.9.3. Company Financials
- 13.1.9.4. SWOT Analysis
- 13.1.10 Carrefour
- 13.1.10.1. Company Overview
- 13.1.10.2. Products
- 13.1.10.3. Company Financials
- 13.1.10.4. SWOT Analysis
- 13.1.1 Del Monte Foods UAE
- 13.2. Market Entropy
- 13.2.1 Company's Key Areas Served
- 13.2.2 Recent Developments
- 13.3. Company Market Share Analysis 2025
- 13.3.1 Top 5 Companies Market Share Analysis
- 13.3.2 Top 3 Companies Market Share Analysis
- 13.4. List of Potential Customers
- 14. Research Methodology
List of Figures
- Figure 1: Global GCC Fruits and Vegetables Industry Revenue Breakdown (Million, %) by Region 2025 & 2033
- Figure 2: Global GCC Fruits and Vegetables Industry Volume Breakdown (Kiloton, %) by Region 2025 & 2033
- Figure 3: United Arab Emirates GCC Fruits and Vegetables Industry Revenue (Million), by Production Analysis 2025 & 2033
- Figure 4: United Arab Emirates GCC Fruits and Vegetables Industry Volume (Kiloton), by Production Analysis 2025 & 2033
- Figure 5: United Arab Emirates GCC Fruits and Vegetables Industry Revenue Share (%), by Production Analysis 2025 & 2033
- Figure 6: United Arab Emirates GCC Fruits and Vegetables Industry Volume Share (%), by Production Analysis 2025 & 2033
- Figure 7: United Arab Emirates GCC Fruits and Vegetables Industry Revenue (Million), by Consumption Analysis 2025 & 2033
- Figure 8: United Arab Emirates GCC Fruits and Vegetables Industry Volume (Kiloton), by Consumption Analysis 2025 & 2033
- Figure 9: United Arab Emirates GCC Fruits and Vegetables Industry Revenue Share (%), by Consumption Analysis 2025 & 2033
- Figure 10: United Arab Emirates GCC Fruits and Vegetables Industry Volume Share (%), by Consumption Analysis 2025 & 2033
- Figure 11: United Arab Emirates GCC Fruits and Vegetables Industry Revenue (Million), by Import Market Analysis (Value & Volume) 2025 & 2033
- Figure 12: United Arab Emirates GCC Fruits and Vegetables Industry Volume (Kiloton), by Import Market Analysis (Value & Volume) 2025 & 2033
- Figure 13: United Arab Emirates GCC Fruits and Vegetables Industry Revenue Share (%), by Import Market Analysis (Value & Volume) 2025 & 2033
- Figure 14: United Arab Emirates GCC Fruits and Vegetables Industry Volume Share (%), by Import Market Analysis (Value & Volume) 2025 & 2033
- Figure 15: United Arab Emirates GCC Fruits and Vegetables Industry Revenue (Million), by Export Market Analysis (Value & Volume) 2025 & 2033
- Figure 16: United Arab Emirates GCC Fruits and Vegetables Industry Volume (Kiloton), by Export Market Analysis (Value & Volume) 2025 & 2033
- Figure 17: United Arab Emirates GCC Fruits and Vegetables Industry Revenue Share (%), by Export Market Analysis (Value & Volume) 2025 & 2033
- Figure 18: United Arab Emirates GCC Fruits and Vegetables Industry Volume Share (%), by Export Market Analysis (Value & Volume) 2025 & 2033
- Figure 19: United Arab Emirates GCC Fruits and Vegetables Industry Revenue (Million), by Price Trend Analysis 2025 & 2033
- Figure 20: United Arab Emirates GCC Fruits and Vegetables Industry Volume (Kiloton), by Price Trend Analysis 2025 & 2033
- Figure 21: United Arab Emirates GCC Fruits and Vegetables Industry Revenue Share (%), by Price Trend Analysis 2025 & 2033
- Figure 22: United Arab Emirates GCC Fruits and Vegetables Industry Volume Share (%), by Price Trend Analysis 2025 & 2033
- Figure 23: United Arab Emirates GCC Fruits and Vegetables Industry Revenue (Million), by Country 2025 & 2033
- Figure 24: United Arab Emirates GCC Fruits and Vegetables Industry Volume (Kiloton), by Country 2025 & 2033
- Figure 25: United Arab Emirates GCC Fruits and Vegetables Industry Revenue Share (%), by Country 2025 & 2033
- Figure 26: United Arab Emirates GCC Fruits and Vegetables Industry Volume Share (%), by Country 2025 & 2033
- Figure 27: Bahrain GCC Fruits and Vegetables Industry Revenue (Million), by Production Analysis 2025 & 2033
- Figure 28: Bahrain GCC Fruits and Vegetables Industry Volume (Kiloton), by Production Analysis 2025 & 2033
- Figure 29: Bahrain GCC Fruits and Vegetables Industry Revenue Share (%), by Production Analysis 2025 & 2033
- Figure 30: Bahrain GCC Fruits and Vegetables Industry Volume Share (%), by Production Analysis 2025 & 2033
- Figure 31: Bahrain GCC Fruits and Vegetables Industry Revenue (Million), by Consumption Analysis 2025 & 2033
- Figure 32: Bahrain GCC Fruits and Vegetables Industry Volume (Kiloton), by Consumption Analysis 2025 & 2033
- Figure 33: Bahrain GCC Fruits and Vegetables Industry Revenue Share (%), by Consumption Analysis 2025 & 2033
- Figure 34: Bahrain GCC Fruits and Vegetables Industry Volume Share (%), by Consumption Analysis 2025 & 2033
- Figure 35: Bahrain GCC Fruits and Vegetables Industry Revenue (Million), by Import Market Analysis (Value & Volume) 2025 & 2033
- Figure 36: Bahrain GCC Fruits and Vegetables Industry Volume (Kiloton), by Import Market Analysis (Value & Volume) 2025 & 2033
- Figure 37: Bahrain GCC Fruits and Vegetables Industry Revenue Share (%), by Import Market Analysis (Value & Volume) 2025 & 2033
- Figure 38: Bahrain GCC Fruits and Vegetables Industry Volume Share (%), by Import Market Analysis (Value & Volume) 2025 & 2033
- Figure 39: Bahrain GCC Fruits and Vegetables Industry Revenue (Million), by Export Market Analysis (Value & Volume) 2025 & 2033
- Figure 40: Bahrain GCC Fruits and Vegetables Industry Volume (Kiloton), by Export Market Analysis (Value & Volume) 2025 & 2033
- Figure 41: Bahrain GCC Fruits and Vegetables Industry Revenue Share (%), by Export Market Analysis (Value & Volume) 2025 & 2033
- Figure 42: Bahrain GCC Fruits and Vegetables Industry Volume Share (%), by Export Market Analysis (Value & Volume) 2025 & 2033
- Figure 43: Bahrain GCC Fruits and Vegetables Industry Revenue (Million), by Price Trend Analysis 2025 & 2033
- Figure 44: Bahrain GCC Fruits and Vegetables Industry Volume (Kiloton), by Price Trend Analysis 2025 & 2033
- Figure 45: Bahrain GCC Fruits and Vegetables Industry Revenue Share (%), by Price Trend Analysis 2025 & 2033
- Figure 46: Bahrain GCC Fruits and Vegetables Industry Volume Share (%), by Price Trend Analysis 2025 & 2033
- Figure 47: Bahrain GCC Fruits and Vegetables Industry Revenue (Million), by Country 2025 & 2033
- Figure 48: Bahrain GCC Fruits and Vegetables Industry Volume (Kiloton), by Country 2025 & 2033
- Figure 49: Bahrain GCC Fruits and Vegetables Industry Revenue Share (%), by Country 2025 & 2033
- Figure 50: Bahrain GCC Fruits and Vegetables Industry Volume Share (%), by Country 2025 & 2033
- Figure 51: Kuwait GCC Fruits and Vegetables Industry Revenue (Million), by Production Analysis 2025 & 2033
- Figure 52: Kuwait GCC Fruits and Vegetables Industry Volume (Kiloton), by Production Analysis 2025 & 2033
- Figure 53: Kuwait GCC Fruits and Vegetables Industry Revenue Share (%), by Production Analysis 2025 & 2033
- Figure 54: Kuwait GCC Fruits and Vegetables Industry Volume Share (%), by Production Analysis 2025 & 2033
- Figure 55: Kuwait GCC Fruits and Vegetables Industry Revenue (Million), by Consumption Analysis 2025 & 2033
- Figure 56: Kuwait GCC Fruits and Vegetables Industry Volume (Kiloton), by Consumption Analysis 2025 & 2033
- Figure 57: Kuwait GCC Fruits and Vegetables Industry Revenue Share (%), by Consumption Analysis 2025 & 2033
- Figure 58: Kuwait GCC Fruits and Vegetables Industry Volume Share (%), by Consumption Analysis 2025 & 2033
- Figure 59: Kuwait GCC Fruits and Vegetables Industry Revenue (Million), by Import Market Analysis (Value & Volume) 2025 & 2033
- Figure 60: Kuwait GCC Fruits and Vegetables Industry Volume (Kiloton), by Import Market Analysis (Value & Volume) 2025 & 2033
- Figure 61: Kuwait GCC Fruits and Vegetables Industry Revenue Share (%), by Import Market Analysis (Value & Volume) 2025 & 2033
- Figure 62: Kuwait GCC Fruits and Vegetables Industry Volume Share (%), by Import Market Analysis (Value & Volume) 2025 & 2033
- Figure 63: Kuwait GCC Fruits and Vegetables Industry Revenue (Million), by Export Market Analysis (Value & Volume) 2025 & 2033
- Figure 64: Kuwait GCC Fruits and Vegetables Industry Volume (Kiloton), by Export Market Analysis (Value & Volume) 2025 & 2033
- Figure 65: Kuwait GCC Fruits and Vegetables Industry Revenue Share (%), by Export Market Analysis (Value & Volume) 2025 & 2033
- Figure 66: Kuwait GCC Fruits and Vegetables Industry Volume Share (%), by Export Market Analysis (Value & Volume) 2025 & 2033
- Figure 67: Kuwait GCC Fruits and Vegetables Industry Revenue (Million), by Price Trend Analysis 2025 & 2033
- Figure 68: Kuwait GCC Fruits and Vegetables Industry Volume (Kiloton), by Price Trend Analysis 2025 & 2033
- Figure 69: Kuwait GCC Fruits and Vegetables Industry Revenue Share (%), by Price Trend Analysis 2025 & 2033
- Figure 70: Kuwait GCC Fruits and Vegetables Industry Volume Share (%), by Price Trend Analysis 2025 & 2033
- Figure 71: Kuwait GCC Fruits and Vegetables Industry Revenue (Million), by Country 2025 & 2033
- Figure 72: Kuwait GCC Fruits and Vegetables Industry Volume (Kiloton), by Country 2025 & 2033
- Figure 73: Kuwait GCC Fruits and Vegetables Industry Revenue Share (%), by Country 2025 & 2033
- Figure 74: Kuwait GCC Fruits and Vegetables Industry Volume Share (%), by Country 2025 & 2033
- Figure 75: Oman GCC Fruits and Vegetables Industry Revenue (Million), by Production Analysis 2025 & 2033
- Figure 76: Oman GCC Fruits and Vegetables Industry Volume (Kiloton), by Production Analysis 2025 & 2033
- Figure 77: Oman GCC Fruits and Vegetables Industry Revenue Share (%), by Production Analysis 2025 & 2033
- Figure 78: Oman GCC Fruits and Vegetables Industry Volume Share (%), by Production Analysis 2025 & 2033
- Figure 79: Oman GCC Fruits and Vegetables Industry Revenue (Million), by Consumption Analysis 2025 & 2033
- Figure 80: Oman GCC Fruits and Vegetables Industry Volume (Kiloton), by Consumption Analysis 2025 & 2033
- Figure 81: Oman GCC Fruits and Vegetables Industry Revenue Share (%), by Consumption Analysis 2025 & 2033
- Figure 82: Oman GCC Fruits and Vegetables Industry Volume Share (%), by Consumption Analysis 2025 & 2033
- Figure 83: Oman GCC Fruits and Vegetables Industry Revenue (Million), by Import Market Analysis (Value & Volume) 2025 & 2033
- Figure 84: Oman GCC Fruits and Vegetables Industry Volume (Kiloton), by Import Market Analysis (Value & Volume) 2025 & 2033
- Figure 85: Oman GCC Fruits and Vegetables Industry Revenue Share (%), by Import Market Analysis (Value & Volume) 2025 & 2033
- Figure 86: Oman GCC Fruits and Vegetables Industry Volume Share (%), by Import Market Analysis (Value & Volume) 2025 & 2033
- Figure 87: Oman GCC Fruits and Vegetables Industry Revenue (Million), by Export Market Analysis (Value & Volume) 2025 & 2033
- Figure 88: Oman GCC Fruits and Vegetables Industry Volume (Kiloton), by Export Market Analysis (Value & Volume) 2025 & 2033
- Figure 89: Oman GCC Fruits and Vegetables Industry Revenue Share (%), by Export Market Analysis (Value & Volume) 2025 & 2033
- Figure 90: Oman GCC Fruits and Vegetables Industry Volume Share (%), by Export Market Analysis (Value & Volume) 2025 & 2033
- Figure 91: Oman GCC Fruits and Vegetables Industry Revenue (Million), by Price Trend Analysis 2025 & 2033
- Figure 92: Oman GCC Fruits and Vegetables Industry Volume (Kiloton), by Price Trend Analysis 2025 & 2033
- Figure 93: Oman GCC Fruits and Vegetables Industry Revenue Share (%), by Price Trend Analysis 2025 & 2033
- Figure 94: Oman GCC Fruits and Vegetables Industry Volume Share (%), by Price Trend Analysis 2025 & 2033
- Figure 95: Oman GCC Fruits and Vegetables Industry Revenue (Million), by Country 2025 & 2033
- Figure 96: Oman GCC Fruits and Vegetables Industry Volume (Kiloton), by Country 2025 & 2033
- Figure 97: Oman GCC Fruits and Vegetables Industry Revenue Share (%), by Country 2025 & 2033
- Figure 98: Oman GCC Fruits and Vegetables Industry Volume Share (%), by Country 2025 & 2033
- Figure 99: Qatar GCC Fruits and Vegetables Industry Revenue (Million), by Production Analysis 2025 & 2033
- Figure 100: Qatar GCC Fruits and Vegetables Industry Volume (Kiloton), by Production Analysis 2025 & 2033
- Figure 101: Qatar GCC Fruits and Vegetables Industry Revenue Share (%), by Production Analysis 2025 & 2033
- Figure 102: Qatar GCC Fruits and Vegetables Industry Volume Share (%), by Production Analysis 2025 & 2033
- Figure 103: Qatar GCC Fruits and Vegetables Industry Revenue (Million), by Consumption Analysis 2025 & 2033
- Figure 104: Qatar GCC Fruits and Vegetables Industry Volume (Kiloton), by Consumption Analysis 2025 & 2033
- Figure 105: Qatar GCC Fruits and Vegetables Industry Revenue Share (%), by Consumption Analysis 2025 & 2033
- Figure 106: Qatar GCC Fruits and Vegetables Industry Volume Share (%), by Consumption Analysis 2025 & 2033
- Figure 107: Qatar GCC Fruits and Vegetables Industry Revenue (Million), by Import Market Analysis (Value & Volume) 2025 & 2033
- Figure 108: Qatar GCC Fruits and Vegetables Industry Volume (Kiloton), by Import Market Analysis (Value & Volume) 2025 & 2033
- Figure 109: Qatar GCC Fruits and Vegetables Industry Revenue Share (%), by Import Market Analysis (Value & Volume) 2025 & 2033
- Figure 110: Qatar GCC Fruits and Vegetables Industry Volume Share (%), by Import Market Analysis (Value & Volume) 2025 & 2033
- Figure 111: Qatar GCC Fruits and Vegetables Industry Revenue (Million), by Export Market Analysis (Value & Volume) 2025 & 2033
- Figure 112: Qatar GCC Fruits and Vegetables Industry Volume (Kiloton), by Export Market Analysis (Value & Volume) 2025 & 2033
- Figure 113: Qatar GCC Fruits and Vegetables Industry Revenue Share (%), by Export Market Analysis (Value & Volume) 2025 & 2033
- Figure 114: Qatar GCC Fruits and Vegetables Industry Volume Share (%), by Export Market Analysis (Value & Volume) 2025 & 2033
- Figure 115: Qatar GCC Fruits and Vegetables Industry Revenue (Million), by Price Trend Analysis 2025 & 2033
- Figure 116: Qatar GCC Fruits and Vegetables Industry Volume (Kiloton), by Price Trend Analysis 2025 & 2033
- Figure 117: Qatar GCC Fruits and Vegetables Industry Revenue Share (%), by Price Trend Analysis 2025 & 2033
- Figure 118: Qatar GCC Fruits and Vegetables Industry Volume Share (%), by Price Trend Analysis 2025 & 2033
- Figure 119: Qatar GCC Fruits and Vegetables Industry Revenue (Million), by Country 2025 & 2033
- Figure 120: Qatar GCC Fruits and Vegetables Industry Volume (Kiloton), by Country 2025 & 2033
- Figure 121: Qatar GCC Fruits and Vegetables Industry Revenue Share (%), by Country 2025 & 2033
- Figure 122: Qatar GCC Fruits and Vegetables Industry Volume Share (%), by Country 2025 & 2033
- Figure 123: Saudi Arabia GCC Fruits and Vegetables Industry Revenue (Million), by Production Analysis 2025 & 2033
- Figure 124: Saudi Arabia GCC Fruits and Vegetables Industry Volume (Kiloton), by Production Analysis 2025 & 2033
- Figure 125: Saudi Arabia GCC Fruits and Vegetables Industry Revenue Share (%), by Production Analysis 2025 & 2033
- Figure 126: Saudi Arabia GCC Fruits and Vegetables Industry Volume Share (%), by Production Analysis 2025 & 2033
- Figure 127: Saudi Arabia GCC Fruits and Vegetables Industry Revenue (Million), by Consumption Analysis 2025 & 2033
- Figure 128: Saudi Arabia GCC Fruits and Vegetables Industry Volume (Kiloton), by Consumption Analysis 2025 & 2033
- Figure 129: Saudi Arabia GCC Fruits and Vegetables Industry Revenue Share (%), by Consumption Analysis 2025 & 2033
- Figure 130: Saudi Arabia GCC Fruits and Vegetables Industry Volume Share (%), by Consumption Analysis 2025 & 2033
- Figure 131: Saudi Arabia GCC Fruits and Vegetables Industry Revenue (Million), by Import Market Analysis (Value & Volume) 2025 & 2033
- Figure 132: Saudi Arabia GCC Fruits and Vegetables Industry Volume (Kiloton), by Import Market Analysis (Value & Volume) 2025 & 2033
- Figure 133: Saudi Arabia GCC Fruits and Vegetables Industry Revenue Share (%), by Import Market Analysis (Value & Volume) 2025 & 2033
- Figure 134: Saudi Arabia GCC Fruits and Vegetables Industry Volume Share (%), by Import Market Analysis (Value & Volume) 2025 & 2033
- Figure 135: Saudi Arabia GCC Fruits and Vegetables Industry Revenue (Million), by Export Market Analysis (Value & Volume) 2025 & 2033
- Figure 136: Saudi Arabia GCC Fruits and Vegetables Industry Volume (Kiloton), by Export Market Analysis (Value & Volume) 2025 & 2033
- Figure 137: Saudi Arabia GCC Fruits and Vegetables Industry Revenue Share (%), by Export Market Analysis (Value & Volume) 2025 & 2033
- Figure 138: Saudi Arabia GCC Fruits and Vegetables Industry Volume Share (%), by Export Market Analysis (Value & Volume) 2025 & 2033
- Figure 139: Saudi Arabia GCC Fruits and Vegetables Industry Revenue (Million), by Price Trend Analysis 2025 & 2033
- Figure 140: Saudi Arabia GCC Fruits and Vegetables Industry Volume (Kiloton), by Price Trend Analysis 2025 & 2033
- Figure 141: Saudi Arabia GCC Fruits and Vegetables Industry Revenue Share (%), by Price Trend Analysis 2025 & 2033
- Figure 142: Saudi Arabia GCC Fruits and Vegetables Industry Volume Share (%), by Price Trend Analysis 2025 & 2033
- Figure 143: Saudi Arabia GCC Fruits and Vegetables Industry Revenue (Million), by Country 2025 & 2033
- Figure 144: Saudi Arabia GCC Fruits and Vegetables Industry Volume (Kiloton), by Country 2025 & 2033
- Figure 145: Saudi Arabia GCC Fruits and Vegetables Industry Revenue Share (%), by Country 2025 & 2033
- Figure 146: Saudi Arabia GCC Fruits and Vegetables Industry Volume Share (%), by Country 2025 & 2033
List of Tables
- Table 1: Global GCC Fruits and Vegetables Industry Revenue Million Forecast, by Production Analysis 2020 & 2033
- Table 2: Global GCC Fruits and Vegetables Industry Volume Kiloton Forecast, by Production Analysis 2020 & 2033
- Table 3: Global GCC Fruits and Vegetables Industry Revenue Million Forecast, by Consumption Analysis 2020 & 2033
- Table 4: Global GCC Fruits and Vegetables Industry Volume Kiloton Forecast, by Consumption Analysis 2020 & 2033
- Table 5: Global GCC Fruits and Vegetables Industry Revenue Million Forecast, by Import Market Analysis (Value & Volume) 2020 & 2033
- Table 6: Global GCC Fruits and Vegetables Industry Volume Kiloton Forecast, by Import Market Analysis (Value & Volume) 2020 & 2033
- Table 7: Global GCC Fruits and Vegetables Industry Revenue Million Forecast, by Export Market Analysis (Value & Volume) 2020 & 2033
- Table 8: Global GCC Fruits and Vegetables Industry Volume Kiloton Forecast, by Export Market Analysis (Value & Volume) 2020 & 2033
- Table 9: Global GCC Fruits and Vegetables Industry Revenue Million Forecast, by Price Trend Analysis 2020 & 2033
- Table 10: Global GCC Fruits and Vegetables Industry Volume Kiloton Forecast, by Price Trend Analysis 2020 & 2033
- Table 11: Global GCC Fruits and Vegetables Industry Revenue Million Forecast, by Region 2020 & 2033
- Table 12: Global GCC Fruits and Vegetables Industry Volume Kiloton Forecast, by Region 2020 & 2033
- Table 13: Global GCC Fruits and Vegetables Industry Revenue Million Forecast, by Production Analysis 2020 & 2033
- Table 14: Global GCC Fruits and Vegetables Industry Volume Kiloton Forecast, by Production Analysis 2020 & 2033
- Table 15: Global GCC Fruits and Vegetables Industry Revenue Million Forecast, by Consumption Analysis 2020 & 2033
- Table 16: Global GCC Fruits and Vegetables Industry Volume Kiloton Forecast, by Consumption Analysis 2020 & 2033
- Table 17: Global GCC Fruits and Vegetables Industry Revenue Million Forecast, by Import Market Analysis (Value & Volume) 2020 & 2033
- Table 18: Global GCC Fruits and Vegetables Industry Volume Kiloton Forecast, by Import Market Analysis (Value & Volume) 2020 & 2033
- Table 19: Global GCC Fruits and Vegetables Industry Revenue Million Forecast, by Export Market Analysis (Value & Volume) 2020 & 2033
- Table 20: Global GCC Fruits and Vegetables Industry Volume Kiloton Forecast, by Export Market Analysis (Value & Volume) 2020 & 2033
- Table 21: Global GCC Fruits and Vegetables Industry Revenue Million Forecast, by Price Trend Analysis 2020 & 2033
- Table 22: Global GCC Fruits and Vegetables Industry Volume Kiloton Forecast, by Price Trend Analysis 2020 & 2033
- Table 23: Global GCC Fruits and Vegetables Industry Revenue Million Forecast, by Country 2020 & 2033
- Table 24: Global GCC Fruits and Vegetables Industry Volume Kiloton Forecast, by Country 2020 & 2033
- Table 25: Fruits GCC Fruits and Vegetables Industry Revenue (Million) Forecast, by Application 2020 & 2033
- Table 26: Fruits GCC Fruits and Vegetables Industry Volume (Kiloton) Forecast, by Application 2020 & 2033
- Table 27: Vegetables GCC Fruits and Vegetables Industry Revenue (Million) Forecast, by Application 2020 & 2033
- Table 28: Vegetables GCC Fruits and Vegetables Industry Volume (Kiloton) Forecast, by Application 2020 & 2033
- Table 29: Global GCC Fruits and Vegetables Industry Revenue Million Forecast, by Production Analysis 2020 & 2033
- Table 30: Global GCC Fruits and Vegetables Industry Volume Kiloton Forecast, by Production Analysis 2020 & 2033
- Table 31: Global GCC Fruits and Vegetables Industry Revenue Million Forecast, by Consumption Analysis 2020 & 2033
- Table 32: Global GCC Fruits and Vegetables Industry Volume Kiloton Forecast, by Consumption Analysis 2020 & 2033
- Table 33: Global GCC Fruits and Vegetables Industry Revenue Million Forecast, by Import Market Analysis (Value & Volume) 2020 & 2033
- Table 34: Global GCC Fruits and Vegetables Industry Volume Kiloton Forecast, by Import Market Analysis (Value & Volume) 2020 & 2033
- Table 35: Global GCC Fruits and Vegetables Industry Revenue Million Forecast, by Export Market Analysis (Value & Volume) 2020 & 2033
- Table 36: Global GCC Fruits and Vegetables Industry Volume Kiloton Forecast, by Export Market Analysis (Value & Volume) 2020 & 2033
- Table 37: Global GCC Fruits and Vegetables Industry Revenue Million Forecast, by Price Trend Analysis 2020 & 2033
- Table 38: Global GCC Fruits and Vegetables Industry Volume Kiloton Forecast, by Price Trend Analysis 2020 & 2033
- Table 39: Global GCC Fruits and Vegetables Industry Revenue Million Forecast, by Country 2020 & 2033
- Table 40: Global GCC Fruits and Vegetables Industry Volume Kiloton Forecast, by Country 2020 & 2033
- Table 41: Fruits GCC Fruits and Vegetables Industry Revenue (Million) Forecast, by Application 2020 & 2033
- Table 42: Fruits GCC Fruits and Vegetables Industry Volume (Kiloton) Forecast, by Application 2020 & 2033
- Table 43: Vegetables GCC Fruits and Vegetables Industry Revenue (Million) Forecast, by Application 2020 & 2033
- Table 44: Vegetables GCC Fruits and Vegetables Industry Volume (Kiloton) Forecast, by Application 2020 & 2033
- Table 45: Global GCC Fruits and Vegetables Industry Revenue Million Forecast, by Production Analysis 2020 & 2033
- Table 46: Global GCC Fruits and Vegetables Industry Volume Kiloton Forecast, by Production Analysis 2020 & 2033
- Table 47: Global GCC Fruits and Vegetables Industry Revenue Million Forecast, by Consumption Analysis 2020 & 2033
- Table 48: Global GCC Fruits and Vegetables Industry Volume Kiloton Forecast, by Consumption Analysis 2020 & 2033
- Table 49: Global GCC Fruits and Vegetables Industry Revenue Million Forecast, by Import Market Analysis (Value & Volume) 2020 & 2033
- Table 50: Global GCC Fruits and Vegetables Industry Volume Kiloton Forecast, by Import Market Analysis (Value & Volume) 2020 & 2033
- Table 51: Global GCC Fruits and Vegetables Industry Revenue Million Forecast, by Export Market Analysis (Value & Volume) 2020 & 2033
- Table 52: Global GCC Fruits and Vegetables Industry Volume Kiloton Forecast, by Export Market Analysis (Value & Volume) 2020 & 2033
- Table 53: Global GCC Fruits and Vegetables Industry Revenue Million Forecast, by Price Trend Analysis 2020 & 2033
- Table 54: Global GCC Fruits and Vegetables Industry Volume Kiloton Forecast, by Price Trend Analysis 2020 & 2033
- Table 55: Global GCC Fruits and Vegetables Industry Revenue Million Forecast, by Country 2020 & 2033
- Table 56: Global GCC Fruits and Vegetables Industry Volume Kiloton Forecast, by Country 2020 & 2033
- Table 57: Fruits GCC Fruits and Vegetables Industry Revenue (Million) Forecast, by Application 2020 & 2033
- Table 58: Fruits GCC Fruits and Vegetables Industry Volume (Kiloton) Forecast, by Application 2020 & 2033
- Table 59: Vegetables GCC Fruits and Vegetables Industry Revenue (Million) Forecast, by Application 2020 & 2033
- Table 60: Vegetables GCC Fruits and Vegetables Industry Volume (Kiloton) Forecast, by Application 2020 & 2033
- Table 61: Global GCC Fruits and Vegetables Industry Revenue Million Forecast, by Production Analysis 2020 & 2033
- Table 62: Global GCC Fruits and Vegetables Industry Volume Kiloton Forecast, by Production Analysis 2020 & 2033
- Table 63: Global GCC Fruits and Vegetables Industry Revenue Million Forecast, by Consumption Analysis 2020 & 2033
- Table 64: Global GCC Fruits and Vegetables Industry Volume Kiloton Forecast, by Consumption Analysis 2020 & 2033
- Table 65: Global GCC Fruits and Vegetables Industry Revenue Million Forecast, by Import Market Analysis (Value & Volume) 2020 & 2033
- Table 66: Global GCC Fruits and Vegetables Industry Volume Kiloton Forecast, by Import Market Analysis (Value & Volume) 2020 & 2033
- Table 67: Global GCC Fruits and Vegetables Industry Revenue Million Forecast, by Export Market Analysis (Value & Volume) 2020 & 2033
- Table 68: Global GCC Fruits and Vegetables Industry Volume Kiloton Forecast, by Export Market Analysis (Value & Volume) 2020 & 2033
- Table 69: Global GCC Fruits and Vegetables Industry Revenue Million Forecast, by Price Trend Analysis 2020 & 2033
- Table 70: Global GCC Fruits and Vegetables Industry Volume Kiloton Forecast, by Price Trend Analysis 2020 & 2033
- Table 71: Global GCC Fruits and Vegetables Industry Revenue Million Forecast, by Country 2020 & 2033
- Table 72: Global GCC Fruits and Vegetables Industry Volume Kiloton Forecast, by Country 2020 & 2033
- Table 73: Fruits GCC Fruits and Vegetables Industry Revenue (Million) Forecast, by Application 2020 & 2033
- Table 74: Fruits GCC Fruits and Vegetables Industry Volume (Kiloton) Forecast, by Application 2020 & 2033
- Table 75: Vegetables GCC Fruits and Vegetables Industry Revenue (Million) Forecast, by Application 2020 & 2033
- Table 76: Vegetables GCC Fruits and Vegetables Industry Volume (Kiloton) Forecast, by Application 2020 & 2033
- Table 77: Global GCC Fruits and Vegetables Industry Revenue Million Forecast, by Production Analysis 2020 & 2033
- Table 78: Global GCC Fruits and Vegetables Industry Volume Kiloton Forecast, by Production Analysis 2020 & 2033
- Table 79: Global GCC Fruits and Vegetables Industry Revenue Million Forecast, by Consumption Analysis 2020 & 2033
- Table 80: Global GCC Fruits and Vegetables Industry Volume Kiloton Forecast, by Consumption Analysis 2020 & 2033
- Table 81: Global GCC Fruits and Vegetables Industry Revenue Million Forecast, by Import Market Analysis (Value & Volume) 2020 & 2033
- Table 82: Global GCC Fruits and Vegetables Industry Volume Kiloton Forecast, by Import Market Analysis (Value & Volume) 2020 & 2033
- Table 83: Global GCC Fruits and Vegetables Industry Revenue Million Forecast, by Export Market Analysis (Value & Volume) 2020 & 2033
- Table 84: Global GCC Fruits and Vegetables Industry Volume Kiloton Forecast, by Export Market Analysis (Value & Volume) 2020 & 2033
- Table 85: Global GCC Fruits and Vegetables Industry Revenue Million Forecast, by Price Trend Analysis 2020 & 2033
- Table 86: Global GCC Fruits and Vegetables Industry Volume Kiloton Forecast, by Price Trend Analysis 2020 & 2033
- Table 87: Global GCC Fruits and Vegetables Industry Revenue Million Forecast, by Country 2020 & 2033
- Table 88: Global GCC Fruits and Vegetables Industry Volume Kiloton Forecast, by Country 2020 & 2033
- Table 89: Fruits GCC Fruits and Vegetables Industry Revenue (Million) Forecast, by Application 2020 & 2033
- Table 90: Fruits GCC Fruits and Vegetables Industry Volume (Kiloton) Forecast, by Application 2020 & 2033
- Table 91: Vegetables GCC Fruits and Vegetables Industry Revenue (Million) Forecast, by Application 2020 & 2033
- Table 92: Vegetables GCC Fruits and Vegetables Industry Volume (Kiloton) Forecast, by Application 2020 & 2033
- Table 93: Global GCC Fruits and Vegetables Industry Revenue Million Forecast, by Production Analysis 2020 & 2033
- Table 94: Global GCC Fruits and Vegetables Industry Volume Kiloton Forecast, by Production Analysis 2020 & 2033
- Table 95: Global GCC Fruits and Vegetables Industry Revenue Million Forecast, by Consumption Analysis 2020 & 2033
- Table 96: Global GCC Fruits and Vegetables Industry Volume Kiloton Forecast, by Consumption Analysis 2020 & 2033
- Table 97: Global GCC Fruits and Vegetables Industry Revenue Million Forecast, by Import Market Analysis (Value & Volume) 2020 & 2033
- Table 98: Global GCC Fruits and Vegetables Industry Volume Kiloton Forecast, by Import Market Analysis (Value & Volume) 2020 & 2033
- Table 99: Global GCC Fruits and Vegetables Industry Revenue Million Forecast, by Export Market Analysis (Value & Volume) 2020 & 2033
- Table 100: Global GCC Fruits and Vegetables Industry Volume Kiloton Forecast, by Export Market Analysis (Value & Volume) 2020 & 2033
- Table 101: Global GCC Fruits and Vegetables Industry Revenue Million Forecast, by Price Trend Analysis 2020 & 2033
- Table 102: Global GCC Fruits and Vegetables Industry Volume Kiloton Forecast, by Price Trend Analysis 2020 & 2033
- Table 103: Global GCC Fruits and Vegetables Industry Revenue Million Forecast, by Country 2020 & 2033
- Table 104: Global GCC Fruits and Vegetables Industry Volume Kiloton Forecast, by Country 2020 & 2033
- Table 105: Fruits GCC Fruits and Vegetables Industry Revenue (Million) Forecast, by Application 2020 & 2033
- Table 106: Fruits GCC Fruits and Vegetables Industry Volume (Kiloton) Forecast, by Application 2020 & 2033
- Table 107: Vegetables GCC Fruits and Vegetables Industry Revenue (Million) Forecast, by Application 2020 & 2033
- Table 108: Vegetables GCC Fruits and Vegetables Industry Volume (Kiloton) Forecast, by Application 2020 & 2033
Frequently Asked Questions
1. What is the projected Compound Annual Growth Rate (CAGR) of the GCC Fruits and Vegetables Industry?
The projected CAGR is approximately 4.80%.
2. Which companies are prominent players in the GCC Fruits and Vegetables Industry?
Key companies in the market include Del Monte Foods UAE , Barakat Group , NRTC Group, Lulu Group , Al Raya Group , Al-Futtaim Group , Al Bakrawe Group , Fresh Fruits Company, SPAR , Carrefour .
3. What are the main segments of the GCC Fruits and Vegetables Industry?
The market segments include Production Analysis, Consumption Analysis, Import Market Analysis (Value & Volume), Export Market Analysis (Value & Volume), Price Trend Analysis.
4. Can you provide details about the market size?
The market size is estimated to be USD 15.98 Million as of 2022.
5. What are some drivers contributing to market growth?
Increasing Adoption of Technology in Horticulture; Government Initiatives for Self-reliance in Vegetable and Fruit Farming.
6. What are the notable trends driving market growth?
Increasing Adoption of Technology in Horticulture.
7. Are there any restraints impacting market growth?
Limited Resource Availability and Unfavourable Climatic Condition; Increasing Reliance on Imports for Domestic Supply.
8. Can you provide examples of recent developments in the market?
February 2024: Lulu Group opened its 23rd hypermarket in the new Doha Mall, Qatar. The hypermarket is a two-floor space of 80,000 square feet that features a modern design aligned with the latest shopping trends. The new hypermarket introduces an extensive range of fresh produce worldwide. Also, to help shoppers save more and get loyalty rewards, Lulu launched its innovative loyalty reward program, Lulu Happiness. By joining this program, shoppers get exclusive offers, additional discounts, and redeemable points whenever they shop at any Lulu Hypermarket.
9. What pricing options are available for accessing the report?
Pricing options include single-user, multi-user, and enterprise licenses priced at USD 4750, USD 5250, and USD 8750 respectively.
10. Is the market size provided in terms of value or volume?
The market size is provided in terms of value, measured in Million and volume, measured in Kiloton.
11. Are there any specific market keywords associated with the report?
Yes, the market keyword associated with the report is "GCC Fruits and Vegetables Industry," which aids in identifying and referencing the specific market segment covered.
12. How do I determine which pricing option suits my needs best?
The pricing options vary based on user requirements and access needs. Individual users may opt for single-user licenses, while businesses requiring broader access may choose multi-user or enterprise licenses for cost-effective access to the report.
13. Are there any additional resources or data provided in the GCC Fruits and Vegetables Industry report?
While the report offers comprehensive insights, it's advisable to review the specific contents or supplementary materials provided to ascertain if additional resources or data are available.
14. How can I stay updated on further developments or reports in the GCC Fruits and Vegetables Industry?
To stay informed about further developments, trends, and reports in the GCC Fruits and Vegetables Industry, consider subscribing to industry newsletters, following relevant companies and organizations, or regularly checking reputable industry news sources and publications.
Methodology
Step 1 - Identification of Relevant Samples Size from Population Database


Step 2 - Approaches for Defining Global Market Size (Value, Volume* & Price*)

Note*: In applicable scenarios
Step 3 - Data Sources
Primary Research
- Web Analytics
- Survey Reports
- Research Institute
- Latest Research Reports
- Opinion Leaders
Secondary Research
- Annual Reports
- White Paper
- Latest Press Release
- Industry Association
- Paid Database
- Investor Presentations

Step 4 - Data Triangulation
Involves using different sources of information in order to increase the validity of a study
These sources are likely to be stakeholders in a program - participants, other researchers, program staff, other community members, and so on.
Then we put all data in single framework & apply various statistical tools to find out the dynamic on the market.
During the analysis stage, feedback from the stakeholder groups would be compared to determine areas of agreement as well as areas of divergence