

Key Insights
The grid-scale battery market is experiencing robust growth, driven by the increasing need for reliable and sustainable energy solutions. A compound annual growth rate (CAGR) exceeding 15% signifies a rapidly expanding market, projected to reach significant value within the forecast period (2025-2033). This expansion is fueled by several key factors. The rising integration of renewable energy sources, such as solar and wind power, necessitates effective energy storage solutions to address their intermittent nature. Grid stability and frequency regulation are also significant drivers, as grid-scale batteries offer crucial support for maintaining consistent power supply. Furthermore, the increasing focus on smart grid technologies and efficient bill management is propelling market growth. The market is segmented by application (frequency regulation, bill management, load shifting, and others including renewable integration, transmission and distribution services, and black start capabilities), battery type (lead-acid, lithium-ion, and others), and geography. While lithium-ion batteries currently dominate due to their higher energy density and longer lifespan, lead-acid batteries maintain a presence in specific applications due to their lower initial cost.
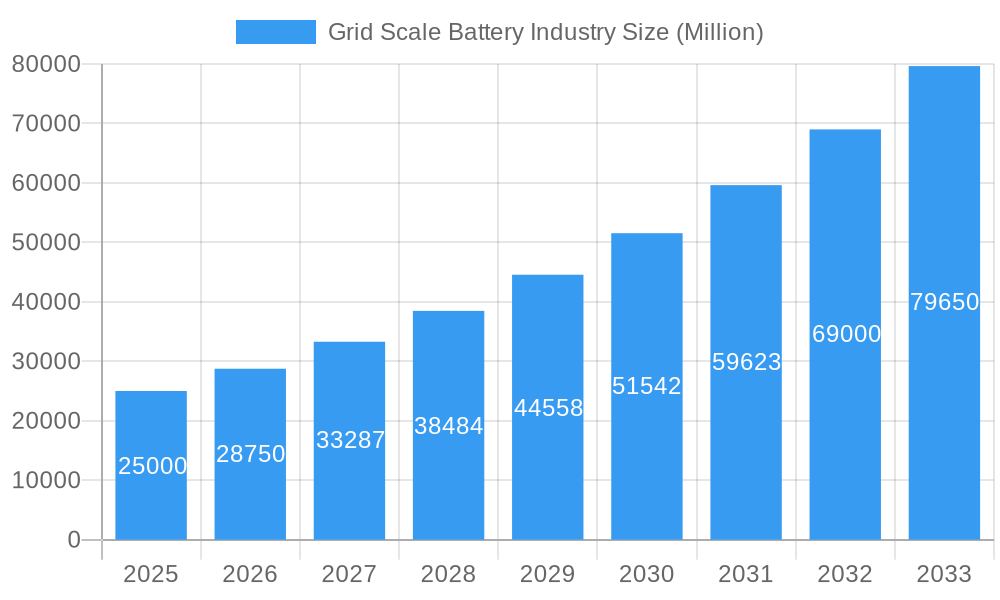
Grid Scale Battery Industry Market Size (In Billion)
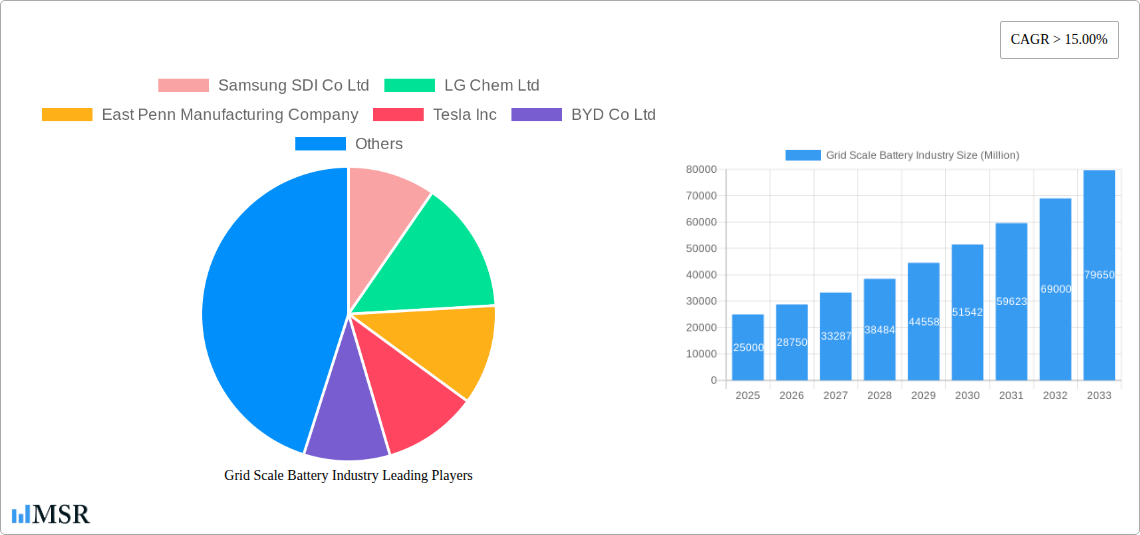
The geographical distribution of the market reveals strong growth potential across various regions. North America, with its advanced energy infrastructure and significant renewable energy investments, is a key market. Europe and Asia-Pacific are also significant contributors, driven by government policies supporting renewable energy adoption and grid modernization. The market faces some restraints, including the high initial investment costs associated with grid-scale battery systems and concerns around battery lifecycle management and recycling. However, technological advancements, economies of scale, and supportive government policies are mitigating these challenges. The competitive landscape is dynamic, with major players like Samsung SDI, LG Chem, Tesla, and BYD leading the market. Ongoing innovations in battery technology, improved energy storage efficiency, and the decreasing cost of battery systems are poised to further accelerate market expansion in the coming years.
Grid Scale Battery Industry Company Market Share
Grid Scale Battery Industry Market Report: 2019-2033 Forecast
This comprehensive report provides an in-depth analysis of the global grid-scale battery industry, projecting robust growth from $XX Million in 2025 to $XX Million by 2033, exhibiting a CAGR of XX%. This detailed study covers the historical period (2019-2024), base year (2025), and forecast period (2025-2033), offering actionable insights for industry stakeholders, investors, and businesses seeking to navigate this rapidly evolving market.
Grid Scale Battery Industry Market Concentration & Dynamics
The grid-scale battery market is characterized by a moderately concentrated landscape, with key players like Samsung SDI Co Ltd, LG Chem Ltd, Tesla Inc, BYD Co Ltd, and Contemporary Amperex Technology Co Ltd holding significant market share. The market share of the top five players is estimated at XX% in 2025. However, the industry is witnessing increased competition from emerging players and diversification of technologies.
Innovation ecosystems are crucial, with continuous advancements in battery chemistry (Lithium-ion, Lead-acid, and others), energy storage systems (ESS), and power electronics driving improvements in efficiency, lifespan, and cost-effectiveness. Stringent regulatory frameworks, focused on grid stability and renewable energy integration, are shaping market dynamics, while government incentives and subsidies significantly influence investment and deployment.
Substitute products, such as pumped hydro storage, are facing challenges in terms of geographical limitations and environmental impact, providing a significant competitive advantage to grid-scale batteries. End-user trends showcase a growing preference for renewable energy sources and improved grid reliability, fostering demand for grid-scale energy storage. M&A activity has been significant, with XX major deals recorded in the past five years, indicating consolidation and strategic expansion within the industry. This trend is expected to continue, driving further market concentration and innovation.
Grid Scale Battery Industry Insights & Trends
The grid-scale battery market is experiencing exponential growth driven by the increasing penetration of renewable energy sources (solar and wind), the need for grid modernization and stabilization, and stringent environmental regulations. The market size is projected to reach $XX Million by 2033. Technological disruptions, particularly advancements in battery chemistry (e.g., solid-state batteries) and energy management systems, are enabling higher energy density, faster charging times, and improved safety, further accelerating market expansion. Evolving consumer behaviors, including a growing awareness of environmental sustainability and the desire for reliable power, are underpinning the demand for grid-scale battery solutions.
Key Markets & Segments Leading Grid Scale Battery Industry
The North American and European regions are currently leading the grid-scale battery market, driven by supportive government policies, robust renewable energy integration targets, and aging grid infrastructure. Within applications, Frequency Regulation is the dominant segment, followed by Load Shifting and Bill Management. Lithium-ion batteries hold the largest market share among battery types due to their superior energy density and performance characteristics.
Key Market Drivers:
- Robust Renewable Energy Integration: Increasing solar and wind power necessitates effective energy storage solutions.
- Grid Modernization and Reliability: Upgrading aging grid infrastructure to improve stability and resilience.
- Government Policies and Incentives: Subsidies and regulations supporting renewable energy and grid-scale storage deployment.
- Economic Growth and Industrialization: Increased energy demand and industrial activity in developing economies.
- Environmental Concerns: Growing awareness of climate change and the need to reduce carbon emissions.
Dominance Analysis: The dominance of North America and Europe is attributed to their advanced grid infrastructure, higher renewable energy penetration, and supportive regulatory frameworks. The frequency regulation application segment leads due to its critical role in maintaining grid stability and enhancing power quality. The lithium-ion battery segment dominates due to superior energy density and performance.
Grid Scale Battery Industry Product Developments
Significant advancements in battery chemistry, thermal management systems, and power electronics are driving product innovation. New battery chemistries, such as solid-state batteries, offer the potential for higher energy density, improved safety, and longer lifespans. Improved battery management systems (BMS) optimize battery performance and extend operational life, enhancing overall system efficiency. These advancements are providing competitive advantages to manufacturers, allowing them to offer superior products with enhanced performance and reliability.
Challenges in the Grid Scale Battery Industry Market
The grid-scale battery industry faces challenges including regulatory hurdles for permitting and interconnection, volatile raw material prices (e.g., lithium, cobalt) impacting supply chain stability, and intense competition among established and emerging players. These factors contribute to uncertainty in project development and deployment timelines, ultimately influencing market growth and profitability.
Forces Driving Grid Scale Battery Industry Growth
Key growth drivers include the increasing adoption of renewable energy, the need for grid modernization and stability, and government incentives promoting energy storage deployment. Technological advancements, such as improved battery chemistries and energy management systems, are further accelerating market expansion.
Long-Term Growth Catalysts in the Grid Scale Battery Industry
Long-term growth is fueled by ongoing innovations in battery technology, strategic partnerships between energy storage companies and grid operators, and expansion into new geographical markets. The development of advanced grid-scale energy storage solutions is expected to drive substantial growth in the coming years.
Emerging Opportunities in Grid Scale Battery Industry
Emerging opportunities include the integration of grid-scale batteries with smart grids, advancements in battery recycling and reuse, and the expansion into new applications, such as microgrids and off-grid power solutions. These trends create significant potential for market expansion and innovation.
Leading Players in the Grid Scale Battery Industry Sector
- Samsung SDI Co Ltd
- LG Chem Ltd
- East Penn Manufacturing Company
- Tesla Inc
- BYD Co Ltd
- GS Yuasa Corporation
- Clarios
- Contemporary Amperex Technology Co Ltd
- Panasonic Corporation
Key Milestones in Grid Scale Battery Industry Industry
- 2020: Significant increase in government investments in grid-scale battery storage projects globally.
- 2021: Launch of several large-scale battery storage projects by major energy companies.
- 2022: Several key partnerships formed between battery manufacturers and energy providers.
- 2023: Introduction of advanced battery chemistries with improved energy density and lifecycle.
Strategic Outlook for Grid Scale Battery Industry Market
The grid-scale battery market is poised for significant growth, driven by technological advancements, supportive government policies, and increasing demand for renewable energy integration. Strategic partnerships and investments in research and development will be crucial for manufacturers to maintain a competitive edge in this rapidly expanding market. The long-term outlook is exceptionally positive, indicating strong potential for sustained growth and market expansion.
Grid Scale Battery Industry Segmentation
-
1. Battery Type
- 1.1. Lead-Acid Battery
- 1.2. Lithium-ion Battery
- 1.3. Others
-
2. Application
- 2.1. Frequency Regulation
- 2.2. Bill Management
- 2.3. Load Shifting
- 2.4. Others (
Grid Scale Battery Industry Segmentation By Geography
- 1. North America
- 2. Europe
- 3. Asia Pacific
- 4. South America
- 5. Middle East and Africa
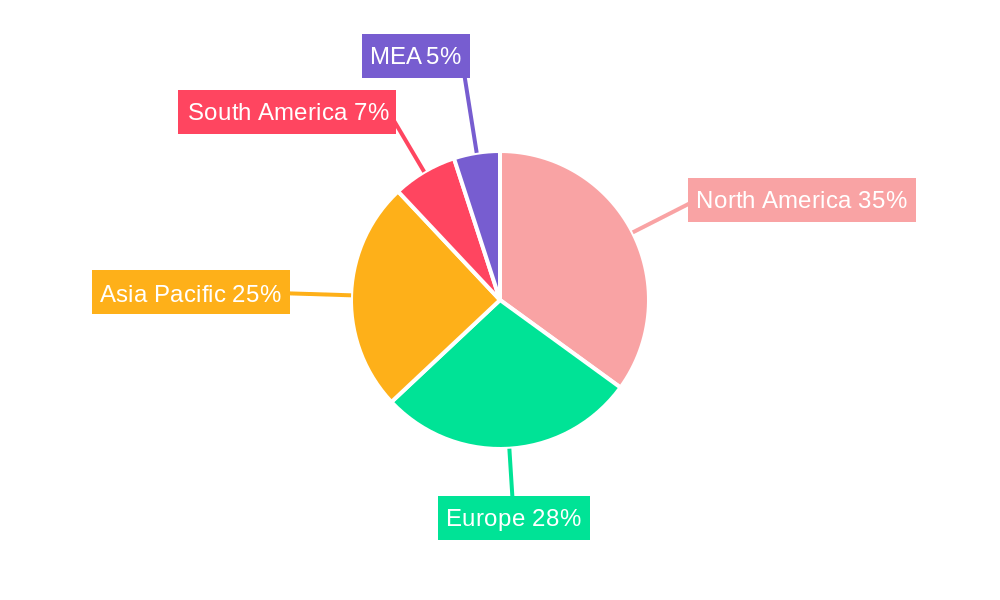
Grid Scale Battery Industry Regional Market Share
Geographic Coverage of Grid Scale Battery Industry
Grid Scale Battery Industry REPORT HIGHLIGHTS
| Aspects | Details |
|---|---|
| Study Period | 2020-2034 |
| Base Year | 2025 |
| Estimated Year | 2026 |
| Forecast Period | 2026-2034 |
| Historical Period | 2020-2025 |
| Growth Rate | CAGR of > 15.00% from 2020-2034 |
| Segmentation |
|
Table of Contents
- 1. Introduction
- 1.1. Research Scope
- 1.2. Market Segmentation
- 1.3. Research Objective
- 1.4. Definitions and Assumptions
- 2. Executive Summary
- 2.1. Market Snapshot
- 3. Market Dynamics
- 3.1. Market Drivers
- 3.2. Market Restrains
- 3.3. Market Trends
- 3.4. Market Opportunities
- 4. Market Factor Analysis
- 4.1. Porters Five Forces
- 4.1.1. Bargaining Power of Suppliers
- 4.1.2. Bargaining Power of Buyers
- 4.1.3. Threat of New Entrants
- 4.1.4. Threat of Substitutes
- 4.1.5. Competitive Rivalry
- 4.2. PESTEL analysis
- 4.3. BCG Analysis
- 4.3.1. Stars (High Growth, High Market Share)
- 4.3.2. Cash Cows (Low Growth, High Market Share)
- 4.3.3. Question Mark (High Growth, Low Market Share)
- 4.3.4. Dogs (Low Growth, Low Market Share)
- 4.4. Ansoff Matrix Analysis
- 4.5. Supply Chain Analysis
- 4.6. Regulatory Landscape
- 4.7. Current Market Potential and Opportunity Assessment (TAM–SAM–SOM Framework)
- 4.8. MSR Analyst Note
- 4.1. Porters Five Forces
- 5. Market Analysis, Insights and Forecast 2021-2033
- 5.1. Market Analysis, Insights and Forecast - by Battery Type
- 5.1.1. Lead-Acid Battery
- 5.1.2. Lithium-ion Battery
- 5.1.3. Others
- 5.2. Market Analysis, Insights and Forecast - by Application
- 5.2.1. Frequency Regulation
- 5.2.2. Bill Management
- 5.2.3. Load Shifting
- 5.2.4. Others (
- 5.3. Market Analysis, Insights and Forecast - by Region
- 5.3.1. North America
- 5.3.2. Europe
- 5.3.3. Asia Pacific
- 5.3.4. South America
- 5.3.5. Middle East and Africa
- 5.1. Market Analysis, Insights and Forecast - by Battery Type
- 6. Global Grid Scale Battery Industry Analysis, Insights and Forecast, 2021-2033
- 6.1. Market Analysis, Insights and Forecast - by Battery Type
- 6.1.1. Lead-Acid Battery
- 6.1.2. Lithium-ion Battery
- 6.1.3. Others
- 6.2. Market Analysis, Insights and Forecast - by Application
- 6.2.1. Frequency Regulation
- 6.2.2. Bill Management
- 6.2.3. Load Shifting
- 6.2.4. Others (
- 6.1. Market Analysis, Insights and Forecast - by Battery Type
- 7. North America Grid Scale Battery Industry Analysis, Insights and Forecast, 2020-2032
- 7.1. Market Analysis, Insights and Forecast - by Battery Type
- 7.1.1. Lead-Acid Battery
- 7.1.2. Lithium-ion Battery
- 7.1.3. Others
- 7.2. Market Analysis, Insights and Forecast - by Application
- 7.2.1. Frequency Regulation
- 7.2.2. Bill Management
- 7.2.3. Load Shifting
- 7.2.4. Others (
- 7.1. Market Analysis, Insights and Forecast - by Battery Type
- 8. Europe Grid Scale Battery Industry Analysis, Insights and Forecast, 2020-2032
- 8.1. Market Analysis, Insights and Forecast - by Battery Type
- 8.1.1. Lead-Acid Battery
- 8.1.2. Lithium-ion Battery
- 8.1.3. Others
- 8.2. Market Analysis, Insights and Forecast - by Application
- 8.2.1. Frequency Regulation
- 8.2.2. Bill Management
- 8.2.3. Load Shifting
- 8.2.4. Others (
- 8.1. Market Analysis, Insights and Forecast - by Battery Type
- 9. Asia Pacific Grid Scale Battery Industry Analysis, Insights and Forecast, 2020-2032
- 9.1. Market Analysis, Insights and Forecast - by Battery Type
- 9.1.1. Lead-Acid Battery
- 9.1.2. Lithium-ion Battery
- 9.1.3. Others
- 9.2. Market Analysis, Insights and Forecast - by Application
- 9.2.1. Frequency Regulation
- 9.2.2. Bill Management
- 9.2.3. Load Shifting
- 9.2.4. Others (
- 9.1. Market Analysis, Insights and Forecast - by Battery Type
- 10. South America Grid Scale Battery Industry Analysis, Insights and Forecast, 2020-2032
- 10.1. Market Analysis, Insights and Forecast - by Battery Type
- 10.1.1. Lead-Acid Battery
- 10.1.2. Lithium-ion Battery
- 10.1.3. Others
- 10.2. Market Analysis, Insights and Forecast - by Application
- 10.2.1. Frequency Regulation
- 10.2.2. Bill Management
- 10.2.3. Load Shifting
- 10.2.4. Others (
- 10.1. Market Analysis, Insights and Forecast - by Battery Type
- 11. Middle East and Africa Grid Scale Battery Industry Analysis, Insights and Forecast, 2020-2032
- 11.1. Market Analysis, Insights and Forecast - by Battery Type
- 11.1.1. Lead-Acid Battery
- 11.1.2. Lithium-ion Battery
- 11.1.3. Others
- 11.2. Market Analysis, Insights and Forecast - by Application
- 11.2.1. Frequency Regulation
- 11.2.2. Bill Management
- 11.2.3. Load Shifting
- 11.2.4. Others (
- 11.1. Market Analysis, Insights and Forecast - by Battery Type
- 12. Competitive Analysis
- 12.1. Company Profiles
- 12.1.1 Samsung SDI Co Ltd
- 12.1.1.1. Company Overview
- 12.1.1.2. Products
- 12.1.1.3. Company Financials
- 12.1.1.4. SWOT Analysis
- 12.1.2 LG Chem Ltd
- 12.1.2.1. Company Overview
- 12.1.2.2. Products
- 12.1.2.3. Company Financials
- 12.1.2.4. SWOT Analysis
- 12.1.3 East Penn Manufacturing Company
- 12.1.3.1. Company Overview
- 12.1.3.2. Products
- 12.1.3.3. Company Financials
- 12.1.3.4. SWOT Analysis
- 12.1.4 Tesla Inc
- 12.1.4.1. Company Overview
- 12.1.4.2. Products
- 12.1.4.3. Company Financials
- 12.1.4.4. SWOT Analysis
- 12.1.5 BYD Co Ltd
- 12.1.5.1. Company Overview
- 12.1.5.2. Products
- 12.1.5.3. Company Financials
- 12.1.5.4. SWOT Analysis
- 12.1.6 GS Yuasa Corporation
- 12.1.6.1. Company Overview
- 12.1.6.2. Products
- 12.1.6.3. Company Financials
- 12.1.6.4. SWOT Analysis
- 12.1.7 Clarios*List Not Exhaustive
- 12.1.7.1. Company Overview
- 12.1.7.2. Products
- 12.1.7.3. Company Financials
- 12.1.7.4. SWOT Analysis
- 12.1.8 Contemporary Amperex Technology Co Ltd
- 12.1.8.1. Company Overview
- 12.1.8.2. Products
- 12.1.8.3. Company Financials
- 12.1.8.4. SWOT Analysis
- 12.1.9 Panasonic Corporation
- 12.1.9.1. Company Overview
- 12.1.9.2. Products
- 12.1.9.3. Company Financials
- 12.1.9.4. SWOT Analysis
- 12.1.1 Samsung SDI Co Ltd
- 12.2. Market Entropy
- 12.2.1 Company's Key Areas Served
- 12.2.2 Recent Developments
- 12.3. Company Market Share Analysis 2025
- 12.3.1 Top 5 Companies Market Share Analysis
- 12.3.2 Top 3 Companies Market Share Analysis
- 12.4. List of Potential Customers
- 13. Research Methodology
List of Figures
- Figure 1: Global Grid Scale Battery Industry Revenue Breakdown (Million, %) by Region 2025 & 2033
- Figure 2: Global Grid Scale Battery Industry Volume Breakdown (K Units, %) by Region 2025 & 2033
- Figure 3: North America Grid Scale Battery Industry Revenue (Million), by Battery Type 2025 & 2033
- Figure 4: North America Grid Scale Battery Industry Volume (K Units), by Battery Type 2025 & 2033
- Figure 5: North America Grid Scale Battery Industry Revenue Share (%), by Battery Type 2025 & 2033
- Figure 6: North America Grid Scale Battery Industry Volume Share (%), by Battery Type 2025 & 2033
- Figure 7: North America Grid Scale Battery Industry Revenue (Million), by Application 2025 & 2033
- Figure 8: North America Grid Scale Battery Industry Volume (K Units), by Application 2025 & 2033
- Figure 9: North America Grid Scale Battery Industry Revenue Share (%), by Application 2025 & 2033
- Figure 10: North America Grid Scale Battery Industry Volume Share (%), by Application 2025 & 2033
- Figure 11: North America Grid Scale Battery Industry Revenue (Million), by Country 2025 & 2033
- Figure 12: North America Grid Scale Battery Industry Volume (K Units), by Country 2025 & 2033
- Figure 13: North America Grid Scale Battery Industry Revenue Share (%), by Country 2025 & 2033
- Figure 14: North America Grid Scale Battery Industry Volume Share (%), by Country 2025 & 2033
- Figure 15: Europe Grid Scale Battery Industry Revenue (Million), by Battery Type 2025 & 2033
- Figure 16: Europe Grid Scale Battery Industry Volume (K Units), by Battery Type 2025 & 2033
- Figure 17: Europe Grid Scale Battery Industry Revenue Share (%), by Battery Type 2025 & 2033
- Figure 18: Europe Grid Scale Battery Industry Volume Share (%), by Battery Type 2025 & 2033
- Figure 19: Europe Grid Scale Battery Industry Revenue (Million), by Application 2025 & 2033
- Figure 20: Europe Grid Scale Battery Industry Volume (K Units), by Application 2025 & 2033
- Figure 21: Europe Grid Scale Battery Industry Revenue Share (%), by Application 2025 & 2033
- Figure 22: Europe Grid Scale Battery Industry Volume Share (%), by Application 2025 & 2033
- Figure 23: Europe Grid Scale Battery Industry Revenue (Million), by Country 2025 & 2033
- Figure 24: Europe Grid Scale Battery Industry Volume (K Units), by Country 2025 & 2033
- Figure 25: Europe Grid Scale Battery Industry Revenue Share (%), by Country 2025 & 2033
- Figure 26: Europe Grid Scale Battery Industry Volume Share (%), by Country 2025 & 2033
- Figure 27: Asia Pacific Grid Scale Battery Industry Revenue (Million), by Battery Type 2025 & 2033
- Figure 28: Asia Pacific Grid Scale Battery Industry Volume (K Units), by Battery Type 2025 & 2033
- Figure 29: Asia Pacific Grid Scale Battery Industry Revenue Share (%), by Battery Type 2025 & 2033
- Figure 30: Asia Pacific Grid Scale Battery Industry Volume Share (%), by Battery Type 2025 & 2033
- Figure 31: Asia Pacific Grid Scale Battery Industry Revenue (Million), by Application 2025 & 2033
- Figure 32: Asia Pacific Grid Scale Battery Industry Volume (K Units), by Application 2025 & 2033
- Figure 33: Asia Pacific Grid Scale Battery Industry Revenue Share (%), by Application 2025 & 2033
- Figure 34: Asia Pacific Grid Scale Battery Industry Volume Share (%), by Application 2025 & 2033
- Figure 35: Asia Pacific Grid Scale Battery Industry Revenue (Million), by Country 2025 & 2033
- Figure 36: Asia Pacific Grid Scale Battery Industry Volume (K Units), by Country 2025 & 2033
- Figure 37: Asia Pacific Grid Scale Battery Industry Revenue Share (%), by Country 2025 & 2033
- Figure 38: Asia Pacific Grid Scale Battery Industry Volume Share (%), by Country 2025 & 2033
- Figure 39: South America Grid Scale Battery Industry Revenue (Million), by Battery Type 2025 & 2033
- Figure 40: South America Grid Scale Battery Industry Volume (K Units), by Battery Type 2025 & 2033
- Figure 41: South America Grid Scale Battery Industry Revenue Share (%), by Battery Type 2025 & 2033
- Figure 42: South America Grid Scale Battery Industry Volume Share (%), by Battery Type 2025 & 2033
- Figure 43: South America Grid Scale Battery Industry Revenue (Million), by Application 2025 & 2033
- Figure 44: South America Grid Scale Battery Industry Volume (K Units), by Application 2025 & 2033
- Figure 45: South America Grid Scale Battery Industry Revenue Share (%), by Application 2025 & 2033
- Figure 46: South America Grid Scale Battery Industry Volume Share (%), by Application 2025 & 2033
- Figure 47: South America Grid Scale Battery Industry Revenue (Million), by Country 2025 & 2033
- Figure 48: South America Grid Scale Battery Industry Volume (K Units), by Country 2025 & 2033
- Figure 49: South America Grid Scale Battery Industry Revenue Share (%), by Country 2025 & 2033
- Figure 50: South America Grid Scale Battery Industry Volume Share (%), by Country 2025 & 2033
- Figure 51: Middle East and Africa Grid Scale Battery Industry Revenue (Million), by Battery Type 2025 & 2033
- Figure 52: Middle East and Africa Grid Scale Battery Industry Volume (K Units), by Battery Type 2025 & 2033
- Figure 53: Middle East and Africa Grid Scale Battery Industry Revenue Share (%), by Battery Type 2025 & 2033
- Figure 54: Middle East and Africa Grid Scale Battery Industry Volume Share (%), by Battery Type 2025 & 2033
- Figure 55: Middle East and Africa Grid Scale Battery Industry Revenue (Million), by Application 2025 & 2033
- Figure 56: Middle East and Africa Grid Scale Battery Industry Volume (K Units), by Application 2025 & 2033
- Figure 57: Middle East and Africa Grid Scale Battery Industry Revenue Share (%), by Application 2025 & 2033
- Figure 58: Middle East and Africa Grid Scale Battery Industry Volume Share (%), by Application 2025 & 2033
- Figure 59: Middle East and Africa Grid Scale Battery Industry Revenue (Million), by Country 2025 & 2033
- Figure 60: Middle East and Africa Grid Scale Battery Industry Volume (K Units), by Country 2025 & 2033
- Figure 61: Middle East and Africa Grid Scale Battery Industry Revenue Share (%), by Country 2025 & 2033
- Figure 62: Middle East and Africa Grid Scale Battery Industry Volume Share (%), by Country 2025 & 2033
List of Tables
- Table 1: Global Grid Scale Battery Industry Revenue Million Forecast, by Battery Type 2020 & 2033
- Table 2: Global Grid Scale Battery Industry Volume K Units Forecast, by Battery Type 2020 & 2033
- Table 3: Global Grid Scale Battery Industry Revenue Million Forecast, by Application 2020 & 2033
- Table 4: Global Grid Scale Battery Industry Volume K Units Forecast, by Application 2020 & 2033
- Table 5: Global Grid Scale Battery Industry Revenue Million Forecast, by Region 2020 & 2033
- Table 6: Global Grid Scale Battery Industry Volume K Units Forecast, by Region 2020 & 2033
- Table 7: Global Grid Scale Battery Industry Revenue Million Forecast, by Battery Type 2020 & 2033
- Table 8: Global Grid Scale Battery Industry Volume K Units Forecast, by Battery Type 2020 & 2033
- Table 9: Global Grid Scale Battery Industry Revenue Million Forecast, by Application 2020 & 2033
- Table 10: Global Grid Scale Battery Industry Volume K Units Forecast, by Application 2020 & 2033
- Table 11: Global Grid Scale Battery Industry Revenue Million Forecast, by Country 2020 & 2033
- Table 12: Global Grid Scale Battery Industry Volume K Units Forecast, by Country 2020 & 2033
- Table 13: Global Grid Scale Battery Industry Revenue Million Forecast, by Battery Type 2020 & 2033
- Table 14: Global Grid Scale Battery Industry Volume K Units Forecast, by Battery Type 2020 & 2033
- Table 15: Global Grid Scale Battery Industry Revenue Million Forecast, by Application 2020 & 2033
- Table 16: Global Grid Scale Battery Industry Volume K Units Forecast, by Application 2020 & 2033
- Table 17: Global Grid Scale Battery Industry Revenue Million Forecast, by Country 2020 & 2033
- Table 18: Global Grid Scale Battery Industry Volume K Units Forecast, by Country 2020 & 2033
- Table 19: Global Grid Scale Battery Industry Revenue Million Forecast, by Battery Type 2020 & 2033
- Table 20: Global Grid Scale Battery Industry Volume K Units Forecast, by Battery Type 2020 & 2033
- Table 21: Global Grid Scale Battery Industry Revenue Million Forecast, by Application 2020 & 2033
- Table 22: Global Grid Scale Battery Industry Volume K Units Forecast, by Application 2020 & 2033
- Table 23: Global Grid Scale Battery Industry Revenue Million Forecast, by Country 2020 & 2033
- Table 24: Global Grid Scale Battery Industry Volume K Units Forecast, by Country 2020 & 2033
- Table 25: Global Grid Scale Battery Industry Revenue Million Forecast, by Battery Type 2020 & 2033
- Table 26: Global Grid Scale Battery Industry Volume K Units Forecast, by Battery Type 2020 & 2033
- Table 27: Global Grid Scale Battery Industry Revenue Million Forecast, by Application 2020 & 2033
- Table 28: Global Grid Scale Battery Industry Volume K Units Forecast, by Application 2020 & 2033
- Table 29: Global Grid Scale Battery Industry Revenue Million Forecast, by Country 2020 & 2033
- Table 30: Global Grid Scale Battery Industry Volume K Units Forecast, by Country 2020 & 2033
- Table 31: Global Grid Scale Battery Industry Revenue Million Forecast, by Battery Type 2020 & 2033
- Table 32: Global Grid Scale Battery Industry Volume K Units Forecast, by Battery Type 2020 & 2033
- Table 33: Global Grid Scale Battery Industry Revenue Million Forecast, by Application 2020 & 2033
- Table 34: Global Grid Scale Battery Industry Volume K Units Forecast, by Application 2020 & 2033
- Table 35: Global Grid Scale Battery Industry Revenue Million Forecast, by Country 2020 & 2033
- Table 36: Global Grid Scale Battery Industry Volume K Units Forecast, by Country 2020 & 2033
Frequently Asked Questions
1. What is the projected Compound Annual Growth Rate (CAGR) of the Grid Scale Battery Industry?
The projected CAGR is approximately > 15.00%.
2. Which companies are prominent players in the Grid Scale Battery Industry?
Key companies in the market include Samsung SDI Co Ltd, LG Chem Ltd, East Penn Manufacturing Company, Tesla Inc, BYD Co Ltd, GS Yuasa Corporation, Clarios*List Not Exhaustive, Contemporary Amperex Technology Co Ltd, Panasonic Corporation.
3. What are the main segments of the Grid Scale Battery Industry?
The market segments include Battery Type, Application.
4. Can you provide details about the market size?
The market size is estimated to be USD XX Million as of 2022.
5. What are some drivers contributing to market growth?
4.; The High Amount of Waste Generation in the Country4.; The growing Focus on Non-Fossil Fuel Sources.
6. What are the notable trends driving market growth?
Increasing Demand for Lithium-ion Battery.
7. Are there any restraints impacting market growth?
4.; The Recycling Rate of Waste in Germany.
8. Can you provide examples of recent developments in the market?
N/A
9. What pricing options are available for accessing the report?
Pricing options include single-user, multi-user, and enterprise licenses priced at USD 4750, USD 5250, and USD 8750 respectively.
10. Is the market size provided in terms of value or volume?
The market size is provided in terms of value, measured in Million and volume, measured in K Units.
11. Are there any specific market keywords associated with the report?
Yes, the market keyword associated with the report is "Grid Scale Battery Industry," which aids in identifying and referencing the specific market segment covered.
12. How do I determine which pricing option suits my needs best?
The pricing options vary based on user requirements and access needs. Individual users may opt for single-user licenses, while businesses requiring broader access may choose multi-user or enterprise licenses for cost-effective access to the report.
13. Are there any additional resources or data provided in the Grid Scale Battery Industry report?
While the report offers comprehensive insights, it's advisable to review the specific contents or supplementary materials provided to ascertain if additional resources or data are available.
14. How can I stay updated on further developments or reports in the Grid Scale Battery Industry?
To stay informed about further developments, trends, and reports in the Grid Scale Battery Industry, consider subscribing to industry newsletters, following relevant companies and organizations, or regularly checking reputable industry news sources and publications.
Methodology
Step 1 - Identification of Relevant Samples Size from Population Database


Step 2 - Approaches for Defining Global Market Size (Value, Volume* & Price*)

Note*: In applicable scenarios
Step 3 - Data Sources
Primary Research
- Web Analytics
- Survey Reports
- Research Institute
- Latest Research Reports
- Opinion Leaders
Secondary Research
- Annual Reports
- White Paper
- Latest Press Release
- Industry Association
- Paid Database
- Investor Presentations

Step 4 - Data Triangulation
Involves using different sources of information in order to increase the validity of a study
These sources are likely to be stakeholders in a program - participants, other researchers, program staff, other community members, and so on.
Then we put all data in single framework & apply various statistical tools to find out the dynamic on the market.
During the analysis stage, feedback from the stakeholder groups would be compared to determine areas of agreement as well as areas of divergence