

Key Insights
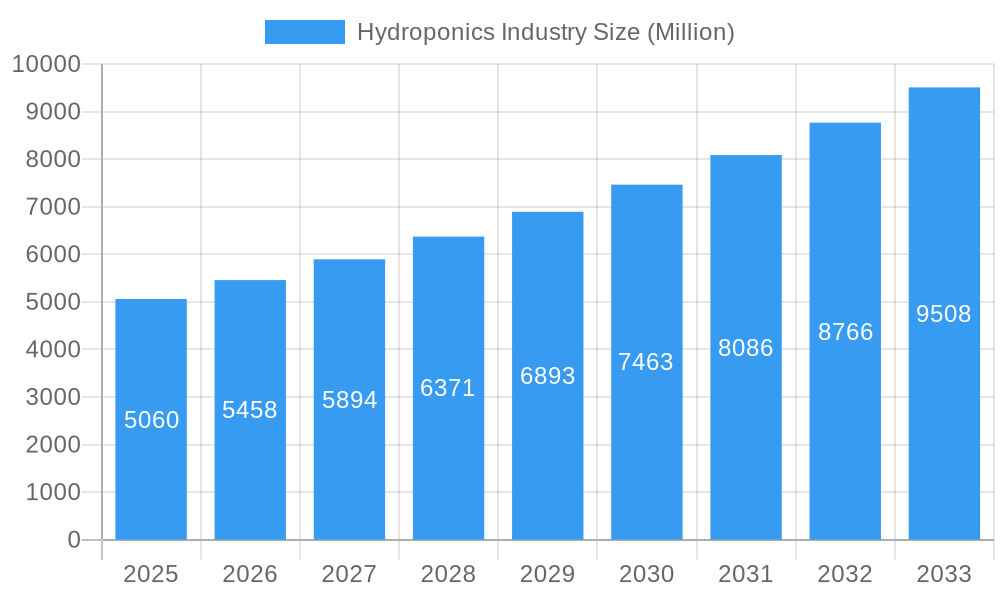
The global hydroponics market, valued at $5.06 billion in 2025, is projected to experience robust growth, driven by a Compound Annual Growth Rate (CAGR) of 7.80% from 2025 to 2033. This expansion is fueled by several key factors. Increasing urbanization and shrinking arable land are forcing a shift towards efficient, space-saving agricultural practices. Consumer demand for fresh, locally-sourced produce, coupled with growing awareness of the environmental benefits of hydroponics (reduced water usage and pesticide reliance), is further bolstering market growth. Technological advancements, such as automated systems and sophisticated nutrient delivery mechanisms, are enhancing productivity and yield, making hydroponics more attractive to both large-scale commercial operations and small-scale urban farms. The rising popularity of vertical farming, a key application of hydroponics, is also contributing significantly to this market's upward trajectory. Specific crop types like leafy greens (lettuce, microgreens), tomatoes, peppers, and cucumbers are leading the growth within the segment, owing to their suitability for hydroponic cultivation and high consumer demand. Major players like Village Farms International Inc., Bright Farms, and 4 FreshBox Farms are driving innovation and market penetration through strategic investments and expansion.
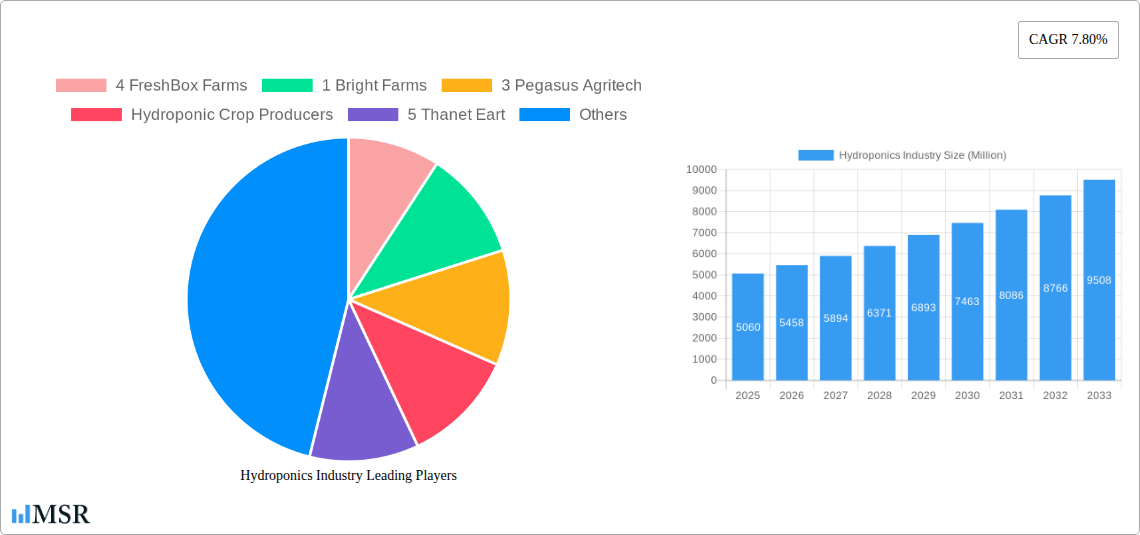
Hydroponics Industry Market Size (In Billion)
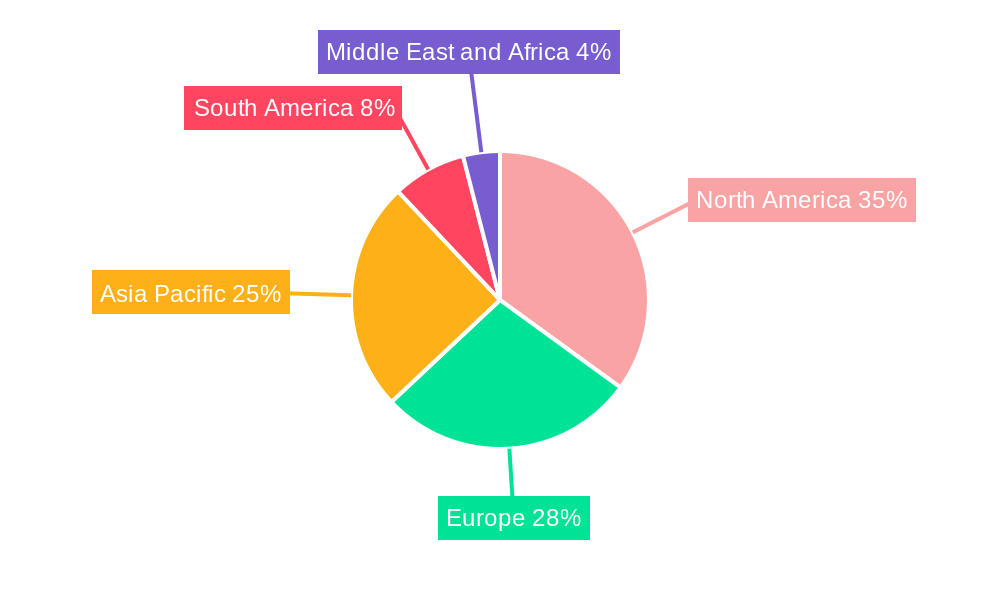
The market segmentation reveals a preference for aggregate hydroponic systems over open liquid systems, suggesting a trend towards more controlled and automated growing environments. Geographic distribution shows strong growth potential across North America and Europe, with Asia Pacific emerging as a rapidly expanding market, fueled by rising disposable incomes and increasing adoption in countries like China and India. However, initial high setup costs and the need for specialized expertise can act as restraints, particularly for smaller-scale operations. Nevertheless, ongoing technological advancements and government support for sustainable agriculture are likely to mitigate these challenges, paving the way for sustained market growth throughout the forecast period. Competition among established players and new entrants is expected to intensify, driving innovation and potentially lowering costs, thereby further expanding market access.
Hydroponics Industry Company Market Share
Hydroponics Industry: A Comprehensive Market Report (2019-2033)
This comprehensive report provides an in-depth analysis of the hydroponics industry, projecting a market valued at $XX Million by 2033. The study period covers 2019-2033, with 2025 as the base and estimated year. This report is crucial for industry stakeholders, investors, and researchers seeking actionable insights into this rapidly evolving sector. We examine market concentration, key trends, leading segments, and emerging opportunities, offering a strategic roadmap for future growth.
Hydroponics Industry Market Concentration & Dynamics
The global hydroponics market exhibits a moderately concentrated landscape, with a few major players commanding significant market share. While precise market share data for each company remains proprietary, estimates suggest that the top 6 players (4 FreshBox Farms, 1 Bright Farms, 3 Pegasus Agritech, Hydroponic Crop Producers, 5 Thanet Eart, 2 Village Farms International Inc) collectively account for approximately xx% of the market. The industry witnesses continuous innovation, driven by advancements in automation, sensor technology, and data analytics. Regulatory frameworks vary across regions, impacting market entry and expansion strategies. Substitute products, like traditional agriculture, present competition, but the inherent advantages of hydroponics—including increased yield and reduced water usage—are driving market growth. Consumer trends favour fresh, locally sourced produce, fueling the demand for hydroponically grown food. Mergers and acquisitions (M&A) activity is steadily rising, as larger companies seek to expand their market reach and consolidate their position. Over the historical period (2019-2024), there have been approximately xx M&A deals in the hydroponics industry, with an average deal value of $xx Million.
- Market Concentration: Moderately concentrated, top 6 players holding approximately xx% market share.
- Innovation Ecosystem: Strong, driven by advancements in automation, sensor technology, and data analytics.
- Regulatory Frameworks: Vary across regions, influencing market access.
- Substitute Products: Traditional agriculture presents competition.
- End-User Trends: Growing preference for fresh, locally sourced produce.
- M&A Activity: Increasing, with approximately xx deals between 2019-2024.
Hydroponics Industry Insights & Trends
The hydroponics industry is experiencing robust growth, driven by several key factors. The global market size was valued at $XX Million in 2024, and is projected to reach $XX Million by 2033, exhibiting a Compound Annual Growth Rate (CAGR) of xx% during the forecast period (2025-2033). Rising consumer demand for fresh produce, increasing awareness of sustainable agriculture practices, and technological advancements in hydroponic systems are primary growth drivers. Technological disruptions, such as the integration of artificial intelligence (AI) and Internet of Things (IoT) devices, are further optimizing production processes and enhancing efficiency. Evolving consumer behaviors, characterized by a preference for healthier and more sustainably produced food, are creating a favorable environment for the growth of the hydroponics industry. Challenges remain, but the overall trajectory points towards a significant expansion in the coming years. This growth is further fuelled by increasing investments in research and development, leading to innovations in nutrient solutions, lighting systems, and automation technologies.
Key Markets & Segments Leading Hydroponics Industry
The hydroponics market demonstrates strong regional variations. North America and Europe currently dominate the market, due to established infrastructure, higher consumer disposable income, and supportive government policies. However, Asia Pacific is anticipated to witness substantial growth in the coming years, driven by increasing population, rising urbanization, and growing adoption of advanced agricultural techniques.
Dominant Segments:
- Type: Liquid Hydroponic Systems currently hold a larger market share compared to Aggregate Hydroponic Systems due to its ease of use and scalability.
- Crop Type: Lettuce and leafy vegetables represent the largest segment, followed by tomatoes, peppers, and cucumbers. The microgreens segment is experiencing rapid growth, driven by consumer demand for nutrient-rich foods. Other crop types are also gaining traction, such as strawberries and herbs.
Drivers:
- Economic Growth: Rising disposable incomes in developed and emerging economies.
- Infrastructure Development: Investments in supporting infrastructure, including controlled-environment agriculture facilities.
- Government Policies: Supportive policies promoting sustainable agriculture and food security.
Detailed analysis reveals that while liquid hydroponic systems currently dominate, the aggregate hydroponic system market shows potential for faster growth. The large market share of lettuce and leafy vegetables is a result of efficient production, short growth cycles, and high consumer demand. However, other crop types, particularly microgreens and specialty crops, offer promising growth opportunities, driven by the trend of increased consumer awareness and rising demand for higher-nutrient foods.
Hydroponics Industry Product Developments
Recent years have witnessed significant advancements in hydroponic systems, including the integration of AI-powered automation, advanced sensors for environmental monitoring, and optimized nutrient delivery systems. These innovations are leading to improved yields, reduced resource consumption, and enhanced product quality. Furthermore, the development of modular and scalable hydroponic systems is making the technology more accessible to a wider range of users, from small-scale urban farmers to large-scale commercial operations. This adaptability and focus on sustainability are key factors driving the industry's competitive edge.
Challenges in the Hydroponics Industry Market
The hydroponics industry faces several challenges, including high initial capital costs for setting up hydroponic farms, the need for specialized technical expertise to operate the systems effectively, and the vulnerability to power outages or equipment malfunctions. Furthermore, regulatory uncertainties and varying standards across different regions can pose difficulties for expansion and market access. Competition from traditional agriculture and the fluctuations in energy prices add to the challenges faced by the industry. These factors can negatively impact profitability and sustainability, potentially slowing down the overall market growth by an estimated xx% in the short term.
Forces Driving Hydroponics Industry Growth
Several factors contribute to the industry's growth trajectory. Technological advancements, such as automation and AI-driven optimization, are enhancing efficiency and reducing operational costs. Favorable government policies promoting sustainable agriculture and food security provide strong support. The rising consumer preference for fresh, locally sourced, and sustainably produced food is a key market driver. Increased investment in research and development is also fostering innovation and creating opportunities for new products and services, all contributing to a positive outlook for the hydroponics market.
Challenges in the Hydroponics Industry Market
Long-term growth is fueled by strategic partnerships between technology providers and agricultural businesses, expanding market access to new regions. Innovations in vertical farming and controlled-environment agriculture are continuously improving efficiency and productivity. Investments in research and development will lead to greater efficiency and reduced costs, contributing to improved sustainability, ultimately pushing the industry towards a higher growth trajectory.
Emerging Opportunities in Hydroponics Industry
The industry is seeing increasing demand for personalized nutrient solutions tailored to specific crops and growing conditions. New markets in urban and peri-urban areas are emerging, driven by the need for local food production and reduced transportation costs. Furthermore, opportunities exist in developing niche markets for specialty crops and organic hydroponic produce, catering to the growing consumer demand for high-quality and sustainably grown food. The integration of blockchain technology for enhancing supply chain transparency and traceability presents a significant opportunity.
Leading Players in the Hydroponics Industry Sector
- 4 FreshBox Farms
- 1 Bright Farms
- 3 Pegasus Agritech
- Hydroponic Crop Producers
- 5 Thanet Eart
- 2 Village Farms International Inc
Key Milestones in Hydroponics Industry Industry
- July 2022: Bustanica unveils the world's largest hydroponic farm, receiving a USD 40 million investment, showcasing the industry's growing scale and attracting significant investment.
- October 2022: GrowGeneration Corp expands its retail presence, indicating a growing market for hydroponic supplies and increasing consumer interest.
- January 2024: Bright Farms expands its operations, demonstrating increasing market demand and the scalability of the hydroponics business model.
- March 2024: INSONGREEN expands into the Middle East and Africa, highlighting the global potential of hydroponics in addressing food security and water scarcity challenges.
Strategic Outlook for Hydroponics Industry Market
The hydroponics industry is poised for substantial growth, driven by technological innovations, increasing consumer demand, and supportive government policies. Strategic opportunities lie in developing efficient and sustainable hydroponic systems, expanding into new markets, and forging strategic partnerships across the value chain. The focus on sustainable and resilient food production will be a key driver of market growth, positioning hydroponics as a vital component of future food systems.
Hydroponics Industry Segmentation
- 1. Production Analysis
- 2. Consumption Analysis
- 3. Import Market Analysis (Value & Volume)
- 4. Export Market Analysis (Value & Volume)
- 5. Price Trend Analysis
Hydroponics Industry Segmentation By Geography
-
1. North America
- 1.1. United States
- 1.2. Canada
- 1.3. Mexico
-
2. South America
- 2.1. Brazil
- 2.2. Argentina
- 2.3. Rest of South America
-
3. Europe
- 3.1. United Kingdom
- 3.2. Germany
- 3.3. France
- 3.4. Italy
- 3.5. Spain
- 3.6. Russia
- 3.7. Benelux
- 3.8. Nordics
- 3.9. Rest of Europe
-
4. Middle East & Africa
- 4.1. Turkey
- 4.2. Israel
- 4.3. GCC
- 4.4. North Africa
- 4.5. South Africa
- 4.6. Rest of Middle East & Africa
-
5. Asia Pacific
- 5.1. China
- 5.2. India
- 5.3. Japan
- 5.4. South Korea
- 5.5. ASEAN
- 5.6. Oceania
- 5.7. Rest of Asia Pacific
Hydroponics Industry Regional Market Share
Geographic Coverage of Hydroponics Industry
Hydroponics Industry REPORT HIGHLIGHTS
| Aspects | Details |
|---|---|
| Study Period | 2020-2034 |
| Base Year | 2025 |
| Estimated Year | 2026 |
| Forecast Period | 2026-2034 |
| Historical Period | 2020-2025 |
| Growth Rate | CAGR of 7.80% from 2020-2034 |
| Segmentation |
|
Table of Contents
- 1. Introduction
- 1.1. Research Scope
- 1.2. Market Segmentation
- 1.3. Research Objective
- 1.4. Definitions and Assumptions
- 2. Executive Summary
- 2.1. Market Snapshot
- 3. Market Dynamics
- 3.1. Market Drivers
- 3.2. Market Restrains
- 3.3. Market Trends
- 3.4. Market Opportunities
- 4. Market Factor Analysis
- 4.1. Porters Five Forces
- 4.1.1. Bargaining Power of Suppliers
- 4.1.2. Bargaining Power of Buyers
- 4.1.3. Threat of New Entrants
- 4.1.4. Threat of Substitutes
- 4.1.5. Competitive Rivalry
- 4.2. PESTEL analysis
- 4.3. BCG Analysis
- 4.3.1. Stars (High Growth, High Market Share)
- 4.3.2. Cash Cows (Low Growth, High Market Share)
- 4.3.3. Question Mark (High Growth, Low Market Share)
- 4.3.4. Dogs (Low Growth, Low Market Share)
- 4.4. Ansoff Matrix Analysis
- 4.5. Supply Chain Analysis
- 4.6. Regulatory Landscape
- 4.7. Current Market Potential and Opportunity Assessment (TAM–SAM–SOM Framework)
- 4.8. MSR Analyst Note
- 4.1. Porters Five Forces
- 5. Market Analysis, Insights and Forecast 2021-2033
- 5.1. Market Analysis, Insights and Forecast - by Production Analysis
- 5.2. Market Analysis, Insights and Forecast - by Consumption Analysis
- 5.3. Market Analysis, Insights and Forecast - by Import Market Analysis (Value & Volume)
- 5.4. Market Analysis, Insights and Forecast - by Export Market Analysis (Value & Volume)
- 5.5. Market Analysis, Insights and Forecast - by Price Trend Analysis
- 5.6. Market Analysis, Insights and Forecast - by Region
- 5.6.1. North America
- 5.6.2. South America
- 5.6.3. Europe
- 5.6.4. Middle East & Africa
- 5.6.5. Asia Pacific
- 6. Global Hydroponics Industry Analysis, Insights and Forecast, 2021-2033
- 6.1. Market Analysis, Insights and Forecast - by Production Analysis
- 6.2. Market Analysis, Insights and Forecast - by Consumption Analysis
- 6.3. Market Analysis, Insights and Forecast - by Import Market Analysis (Value & Volume)
- 6.4. Market Analysis, Insights and Forecast - by Export Market Analysis (Value & Volume)
- 6.5. Market Analysis, Insights and Forecast - by Price Trend Analysis
- 7. North America Hydroponics Industry Analysis, Insights and Forecast, 2020-2032
- 7.1. Market Analysis, Insights and Forecast - by Production Analysis
- 7.2. Market Analysis, Insights and Forecast - by Consumption Analysis
- 7.3. Market Analysis, Insights and Forecast - by Import Market Analysis (Value & Volume)
- 7.4. Market Analysis, Insights and Forecast - by Export Market Analysis (Value & Volume)
- 7.5. Market Analysis, Insights and Forecast - by Price Trend Analysis
- 8. South America Hydroponics Industry Analysis, Insights and Forecast, 2020-2032
- 8.1. Market Analysis, Insights and Forecast - by Production Analysis
- 8.2. Market Analysis, Insights and Forecast - by Consumption Analysis
- 8.3. Market Analysis, Insights and Forecast - by Import Market Analysis (Value & Volume)
- 8.4. Market Analysis, Insights and Forecast - by Export Market Analysis (Value & Volume)
- 8.5. Market Analysis, Insights and Forecast - by Price Trend Analysis
- 9. Europe Hydroponics Industry Analysis, Insights and Forecast, 2020-2032
- 9.1. Market Analysis, Insights and Forecast - by Production Analysis
- 9.2. Market Analysis, Insights and Forecast - by Consumption Analysis
- 9.3. Market Analysis, Insights and Forecast - by Import Market Analysis (Value & Volume)
- 9.4. Market Analysis, Insights and Forecast - by Export Market Analysis (Value & Volume)
- 9.5. Market Analysis, Insights and Forecast - by Price Trend Analysis
- 10. Middle East & Africa Hydroponics Industry Analysis, Insights and Forecast, 2020-2032
- 10.1. Market Analysis, Insights and Forecast - by Production Analysis
- 10.2. Market Analysis, Insights and Forecast - by Consumption Analysis
- 10.3. Market Analysis, Insights and Forecast - by Import Market Analysis (Value & Volume)
- 10.4. Market Analysis, Insights and Forecast - by Export Market Analysis (Value & Volume)
- 10.5. Market Analysis, Insights and Forecast - by Price Trend Analysis
- 11. Asia Pacific Hydroponics Industry Analysis, Insights and Forecast, 2020-2032
- 11.1. Market Analysis, Insights and Forecast - by Production Analysis
- 11.2. Market Analysis, Insights and Forecast - by Consumption Analysis
- 11.3. Market Analysis, Insights and Forecast - by Import Market Analysis (Value & Volume)
- 11.4. Market Analysis, Insights and Forecast - by Export Market Analysis (Value & Volume)
- 11.5. Market Analysis, Insights and Forecast - by Price Trend Analysis
- 12. Competitive Analysis
- 12.1. Company Profiles
- 12.1.1 4 FreshBox Farms
- 12.1.1.1. Company Overview
- 12.1.1.2. Products
- 12.1.1.3. Company Financials
- 12.1.1.4. SWOT Analysis
- 12.1.2 1 Bright Farms
- 12.1.2.1. Company Overview
- 12.1.2.2. Products
- 12.1.2.3. Company Financials
- 12.1.2.4. SWOT Analysis
- 12.1.3 3 Pegasus Agritech
- 12.1.3.1. Company Overview
- 12.1.3.2. Products
- 12.1.3.3. Company Financials
- 12.1.3.4. SWOT Analysis
- 12.1.4 Hydroponic Crop Producers
- 12.1.4.1. Company Overview
- 12.1.4.2. Products
- 12.1.4.3. Company Financials
- 12.1.4.4. SWOT Analysis
- 12.1.5 5 Thanet Eart
- 12.1.5.1. Company Overview
- 12.1.5.2. Products
- 12.1.5.3. Company Financials
- 12.1.5.4. SWOT Analysis
- 12.1.6 2 Village Farms International Inc
- 12.1.6.1. Company Overview
- 12.1.6.2. Products
- 12.1.6.3. Company Financials
- 12.1.6.4. SWOT Analysis
- 12.1.1 4 FreshBox Farms
- 12.2. Market Entropy
- 12.2.1 Company's Key Areas Served
- 12.2.2 Recent Developments
- 12.3. Company Market Share Analysis 2025
- 12.3.1 Top 5 Companies Market Share Analysis
- 12.3.2 Top 3 Companies Market Share Analysis
- 12.4. List of Potential Customers
- 13. Research Methodology
List of Figures
- Figure 1: Global Hydroponics Industry Revenue Breakdown (Million, %) by Region 2025 & 2033
- Figure 2: North America Hydroponics Industry Revenue (Million), by Production Analysis 2025 & 2033
- Figure 3: North America Hydroponics Industry Revenue Share (%), by Production Analysis 2025 & 2033
- Figure 4: North America Hydroponics Industry Revenue (Million), by Consumption Analysis 2025 & 2033
- Figure 5: North America Hydroponics Industry Revenue Share (%), by Consumption Analysis 2025 & 2033
- Figure 6: North America Hydroponics Industry Revenue (Million), by Import Market Analysis (Value & Volume) 2025 & 2033
- Figure 7: North America Hydroponics Industry Revenue Share (%), by Import Market Analysis (Value & Volume) 2025 & 2033
- Figure 8: North America Hydroponics Industry Revenue (Million), by Export Market Analysis (Value & Volume) 2025 & 2033
- Figure 9: North America Hydroponics Industry Revenue Share (%), by Export Market Analysis (Value & Volume) 2025 & 2033
- Figure 10: North America Hydroponics Industry Revenue (Million), by Price Trend Analysis 2025 & 2033
- Figure 11: North America Hydroponics Industry Revenue Share (%), by Price Trend Analysis 2025 & 2033
- Figure 12: North America Hydroponics Industry Revenue (Million), by Country 2025 & 2033
- Figure 13: North America Hydroponics Industry Revenue Share (%), by Country 2025 & 2033
- Figure 14: South America Hydroponics Industry Revenue (Million), by Production Analysis 2025 & 2033
- Figure 15: South America Hydroponics Industry Revenue Share (%), by Production Analysis 2025 & 2033
- Figure 16: South America Hydroponics Industry Revenue (Million), by Consumption Analysis 2025 & 2033
- Figure 17: South America Hydroponics Industry Revenue Share (%), by Consumption Analysis 2025 & 2033
- Figure 18: South America Hydroponics Industry Revenue (Million), by Import Market Analysis (Value & Volume) 2025 & 2033
- Figure 19: South America Hydroponics Industry Revenue Share (%), by Import Market Analysis (Value & Volume) 2025 & 2033
- Figure 20: South America Hydroponics Industry Revenue (Million), by Export Market Analysis (Value & Volume) 2025 & 2033
- Figure 21: South America Hydroponics Industry Revenue Share (%), by Export Market Analysis (Value & Volume) 2025 & 2033
- Figure 22: South America Hydroponics Industry Revenue (Million), by Price Trend Analysis 2025 & 2033
- Figure 23: South America Hydroponics Industry Revenue Share (%), by Price Trend Analysis 2025 & 2033
- Figure 24: South America Hydroponics Industry Revenue (Million), by Country 2025 & 2033
- Figure 25: South America Hydroponics Industry Revenue Share (%), by Country 2025 & 2033
- Figure 26: Europe Hydroponics Industry Revenue (Million), by Production Analysis 2025 & 2033
- Figure 27: Europe Hydroponics Industry Revenue Share (%), by Production Analysis 2025 & 2033
- Figure 28: Europe Hydroponics Industry Revenue (Million), by Consumption Analysis 2025 & 2033
- Figure 29: Europe Hydroponics Industry Revenue Share (%), by Consumption Analysis 2025 & 2033
- Figure 30: Europe Hydroponics Industry Revenue (Million), by Import Market Analysis (Value & Volume) 2025 & 2033
- Figure 31: Europe Hydroponics Industry Revenue Share (%), by Import Market Analysis (Value & Volume) 2025 & 2033
- Figure 32: Europe Hydroponics Industry Revenue (Million), by Export Market Analysis (Value & Volume) 2025 & 2033
- Figure 33: Europe Hydroponics Industry Revenue Share (%), by Export Market Analysis (Value & Volume) 2025 & 2033
- Figure 34: Europe Hydroponics Industry Revenue (Million), by Price Trend Analysis 2025 & 2033
- Figure 35: Europe Hydroponics Industry Revenue Share (%), by Price Trend Analysis 2025 & 2033
- Figure 36: Europe Hydroponics Industry Revenue (Million), by Country 2025 & 2033
- Figure 37: Europe Hydroponics Industry Revenue Share (%), by Country 2025 & 2033
- Figure 38: Middle East & Africa Hydroponics Industry Revenue (Million), by Production Analysis 2025 & 2033
- Figure 39: Middle East & Africa Hydroponics Industry Revenue Share (%), by Production Analysis 2025 & 2033
- Figure 40: Middle East & Africa Hydroponics Industry Revenue (Million), by Consumption Analysis 2025 & 2033
- Figure 41: Middle East & Africa Hydroponics Industry Revenue Share (%), by Consumption Analysis 2025 & 2033
- Figure 42: Middle East & Africa Hydroponics Industry Revenue (Million), by Import Market Analysis (Value & Volume) 2025 & 2033
- Figure 43: Middle East & Africa Hydroponics Industry Revenue Share (%), by Import Market Analysis (Value & Volume) 2025 & 2033
- Figure 44: Middle East & Africa Hydroponics Industry Revenue (Million), by Export Market Analysis (Value & Volume) 2025 & 2033
- Figure 45: Middle East & Africa Hydroponics Industry Revenue Share (%), by Export Market Analysis (Value & Volume) 2025 & 2033
- Figure 46: Middle East & Africa Hydroponics Industry Revenue (Million), by Price Trend Analysis 2025 & 2033
- Figure 47: Middle East & Africa Hydroponics Industry Revenue Share (%), by Price Trend Analysis 2025 & 2033
- Figure 48: Middle East & Africa Hydroponics Industry Revenue (Million), by Country 2025 & 2033
- Figure 49: Middle East & Africa Hydroponics Industry Revenue Share (%), by Country 2025 & 2033
- Figure 50: Asia Pacific Hydroponics Industry Revenue (Million), by Production Analysis 2025 & 2033
- Figure 51: Asia Pacific Hydroponics Industry Revenue Share (%), by Production Analysis 2025 & 2033
- Figure 52: Asia Pacific Hydroponics Industry Revenue (Million), by Consumption Analysis 2025 & 2033
- Figure 53: Asia Pacific Hydroponics Industry Revenue Share (%), by Consumption Analysis 2025 & 2033
- Figure 54: Asia Pacific Hydroponics Industry Revenue (Million), by Import Market Analysis (Value & Volume) 2025 & 2033
- Figure 55: Asia Pacific Hydroponics Industry Revenue Share (%), by Import Market Analysis (Value & Volume) 2025 & 2033
- Figure 56: Asia Pacific Hydroponics Industry Revenue (Million), by Export Market Analysis (Value & Volume) 2025 & 2033
- Figure 57: Asia Pacific Hydroponics Industry Revenue Share (%), by Export Market Analysis (Value & Volume) 2025 & 2033
- Figure 58: Asia Pacific Hydroponics Industry Revenue (Million), by Price Trend Analysis 2025 & 2033
- Figure 59: Asia Pacific Hydroponics Industry Revenue Share (%), by Price Trend Analysis 2025 & 2033
- Figure 60: Asia Pacific Hydroponics Industry Revenue (Million), by Country 2025 & 2033
- Figure 61: Asia Pacific Hydroponics Industry Revenue Share (%), by Country 2025 & 2033
List of Tables
- Table 1: Global Hydroponics Industry Revenue Million Forecast, by Production Analysis 2020 & 2033
- Table 2: Global Hydroponics Industry Revenue Million Forecast, by Consumption Analysis 2020 & 2033
- Table 3: Global Hydroponics Industry Revenue Million Forecast, by Import Market Analysis (Value & Volume) 2020 & 2033
- Table 4: Global Hydroponics Industry Revenue Million Forecast, by Export Market Analysis (Value & Volume) 2020 & 2033
- Table 5: Global Hydroponics Industry Revenue Million Forecast, by Price Trend Analysis 2020 & 2033
- Table 6: Global Hydroponics Industry Revenue Million Forecast, by Region 2020 & 2033
- Table 7: Global Hydroponics Industry Revenue Million Forecast, by Production Analysis 2020 & 2033
- Table 8: Global Hydroponics Industry Revenue Million Forecast, by Consumption Analysis 2020 & 2033
- Table 9: Global Hydroponics Industry Revenue Million Forecast, by Import Market Analysis (Value & Volume) 2020 & 2033
- Table 10: Global Hydroponics Industry Revenue Million Forecast, by Export Market Analysis (Value & Volume) 2020 & 2033
- Table 11: Global Hydroponics Industry Revenue Million Forecast, by Price Trend Analysis 2020 & 2033
- Table 12: Global Hydroponics Industry Revenue Million Forecast, by Country 2020 & 2033
- Table 13: United States Hydroponics Industry Revenue (Million) Forecast, by Application 2020 & 2033
- Table 14: Canada Hydroponics Industry Revenue (Million) Forecast, by Application 2020 & 2033
- Table 15: Mexico Hydroponics Industry Revenue (Million) Forecast, by Application 2020 & 2033
- Table 16: Global Hydroponics Industry Revenue Million Forecast, by Production Analysis 2020 & 2033
- Table 17: Global Hydroponics Industry Revenue Million Forecast, by Consumption Analysis 2020 & 2033
- Table 18: Global Hydroponics Industry Revenue Million Forecast, by Import Market Analysis (Value & Volume) 2020 & 2033
- Table 19: Global Hydroponics Industry Revenue Million Forecast, by Export Market Analysis (Value & Volume) 2020 & 2033
- Table 20: Global Hydroponics Industry Revenue Million Forecast, by Price Trend Analysis 2020 & 2033
- Table 21: Global Hydroponics Industry Revenue Million Forecast, by Country 2020 & 2033
- Table 22: Brazil Hydroponics Industry Revenue (Million) Forecast, by Application 2020 & 2033
- Table 23: Argentina Hydroponics Industry Revenue (Million) Forecast, by Application 2020 & 2033
- Table 24: Rest of South America Hydroponics Industry Revenue (Million) Forecast, by Application 2020 & 2033
- Table 25: Global Hydroponics Industry Revenue Million Forecast, by Production Analysis 2020 & 2033
- Table 26: Global Hydroponics Industry Revenue Million Forecast, by Consumption Analysis 2020 & 2033
- Table 27: Global Hydroponics Industry Revenue Million Forecast, by Import Market Analysis (Value & Volume) 2020 & 2033
- Table 28: Global Hydroponics Industry Revenue Million Forecast, by Export Market Analysis (Value & Volume) 2020 & 2033
- Table 29: Global Hydroponics Industry Revenue Million Forecast, by Price Trend Analysis 2020 & 2033
- Table 30: Global Hydroponics Industry Revenue Million Forecast, by Country 2020 & 2033
- Table 31: United Kingdom Hydroponics Industry Revenue (Million) Forecast, by Application 2020 & 2033
- Table 32: Germany Hydroponics Industry Revenue (Million) Forecast, by Application 2020 & 2033
- Table 33: France Hydroponics Industry Revenue (Million) Forecast, by Application 2020 & 2033
- Table 34: Italy Hydroponics Industry Revenue (Million) Forecast, by Application 2020 & 2033
- Table 35: Spain Hydroponics Industry Revenue (Million) Forecast, by Application 2020 & 2033
- Table 36: Russia Hydroponics Industry Revenue (Million) Forecast, by Application 2020 & 2033
- Table 37: Benelux Hydroponics Industry Revenue (Million) Forecast, by Application 2020 & 2033
- Table 38: Nordics Hydroponics Industry Revenue (Million) Forecast, by Application 2020 & 2033
- Table 39: Rest of Europe Hydroponics Industry Revenue (Million) Forecast, by Application 2020 & 2033
- Table 40: Global Hydroponics Industry Revenue Million Forecast, by Production Analysis 2020 & 2033
- Table 41: Global Hydroponics Industry Revenue Million Forecast, by Consumption Analysis 2020 & 2033
- Table 42: Global Hydroponics Industry Revenue Million Forecast, by Import Market Analysis (Value & Volume) 2020 & 2033
- Table 43: Global Hydroponics Industry Revenue Million Forecast, by Export Market Analysis (Value & Volume) 2020 & 2033
- Table 44: Global Hydroponics Industry Revenue Million Forecast, by Price Trend Analysis 2020 & 2033
- Table 45: Global Hydroponics Industry Revenue Million Forecast, by Country 2020 & 2033
- Table 46: Turkey Hydroponics Industry Revenue (Million) Forecast, by Application 2020 & 2033
- Table 47: Israel Hydroponics Industry Revenue (Million) Forecast, by Application 2020 & 2033
- Table 48: GCC Hydroponics Industry Revenue (Million) Forecast, by Application 2020 & 2033
- Table 49: North Africa Hydroponics Industry Revenue (Million) Forecast, by Application 2020 & 2033
- Table 50: South Africa Hydroponics Industry Revenue (Million) Forecast, by Application 2020 & 2033
- Table 51: Rest of Middle East & Africa Hydroponics Industry Revenue (Million) Forecast, by Application 2020 & 2033
- Table 52: Global Hydroponics Industry Revenue Million Forecast, by Production Analysis 2020 & 2033
- Table 53: Global Hydroponics Industry Revenue Million Forecast, by Consumption Analysis 2020 & 2033
- Table 54: Global Hydroponics Industry Revenue Million Forecast, by Import Market Analysis (Value & Volume) 2020 & 2033
- Table 55: Global Hydroponics Industry Revenue Million Forecast, by Export Market Analysis (Value & Volume) 2020 & 2033
- Table 56: Global Hydroponics Industry Revenue Million Forecast, by Price Trend Analysis 2020 & 2033
- Table 57: Global Hydroponics Industry Revenue Million Forecast, by Country 2020 & 2033
- Table 58: China Hydroponics Industry Revenue (Million) Forecast, by Application 2020 & 2033
- Table 59: India Hydroponics Industry Revenue (Million) Forecast, by Application 2020 & 2033
- Table 60: Japan Hydroponics Industry Revenue (Million) Forecast, by Application 2020 & 2033
- Table 61: South Korea Hydroponics Industry Revenue (Million) Forecast, by Application 2020 & 2033
- Table 62: ASEAN Hydroponics Industry Revenue (Million) Forecast, by Application 2020 & 2033
- Table 63: Oceania Hydroponics Industry Revenue (Million) Forecast, by Application 2020 & 2033
- Table 64: Rest of Asia Pacific Hydroponics Industry Revenue (Million) Forecast, by Application 2020 & 2033
Frequently Asked Questions
1. What is the projected Compound Annual Growth Rate (CAGR) of the Hydroponics Industry?
The projected CAGR is approximately 7.80%.
2. Which companies are prominent players in the Hydroponics Industry?
Key companies in the market include 4 FreshBox Farms, 1 Bright Farms, 3 Pegasus Agritech, Hydroponic Crop Producers, 5 Thanet Eart, 2 Village Farms International Inc.
3. What are the main segments of the Hydroponics Industry?
The market segments include Production Analysis, Consumption Analysis, Import Market Analysis (Value & Volume), Export Market Analysis (Value & Volume), Price Trend Analysis.
4. Can you provide details about the market size?
The market size is estimated to be USD 5.06 Million as of 2022.
5. What are some drivers contributing to market growth?
Need for Custom Product Development; Use of CROs for Regulatory Services.
6. What are the notable trends driving market growth?
Higher Consumption of Salads and Exotic Vegetables.
7. Are there any restraints impacting market growth?
Data and Cyber Security Concerns; Lack of Experts and Professionals in this Industry.
8. Can you provide examples of recent developments in the market?
March 2024: INSONGREEN announced a significant expansion of its hydroponic and vertical greenhouse production in the Middle East and Africa. This initiative aims to tackle regional water scarcity and food security challenges by utilizing advanced agricultural technologies for sustainable development.
9. What pricing options are available for accessing the report?
Pricing options include single-user, multi-user, and enterprise licenses priced at USD 4750, USD 5250, and USD 8750 respectively.
10. Is the market size provided in terms of value or volume?
The market size is provided in terms of value, measured in Million.
11. Are there any specific market keywords associated with the report?
Yes, the market keyword associated with the report is "Hydroponics Industry," which aids in identifying and referencing the specific market segment covered.
12. How do I determine which pricing option suits my needs best?
The pricing options vary based on user requirements and access needs. Individual users may opt for single-user licenses, while businesses requiring broader access may choose multi-user or enterprise licenses for cost-effective access to the report.
13. Are there any additional resources or data provided in the Hydroponics Industry report?
While the report offers comprehensive insights, it's advisable to review the specific contents or supplementary materials provided to ascertain if additional resources or data are available.
14. How can I stay updated on further developments or reports in the Hydroponics Industry?
To stay informed about further developments, trends, and reports in the Hydroponics Industry, consider subscribing to industry newsletters, following relevant companies and organizations, or regularly checking reputable industry news sources and publications.
Methodology
Step 1 - Identification of Relevant Samples Size from Population Database


Step 2 - Approaches for Defining Global Market Size (Value, Volume* & Price*)

Note*: In applicable scenarios
Step 3 - Data Sources
Primary Research
- Web Analytics
- Survey Reports
- Research Institute
- Latest Research Reports
- Opinion Leaders
Secondary Research
- Annual Reports
- White Paper
- Latest Press Release
- Industry Association
- Paid Database
- Investor Presentations

Step 4 - Data Triangulation
Involves using different sources of information in order to increase the validity of a study
These sources are likely to be stakeholders in a program - participants, other researchers, program staff, other community members, and so on.
Then we put all data in single framework & apply various statistical tools to find out the dynamic on the market.
During the analysis stage, feedback from the stakeholder groups would be compared to determine areas of agreement as well as areas of divergence