

Key Insights
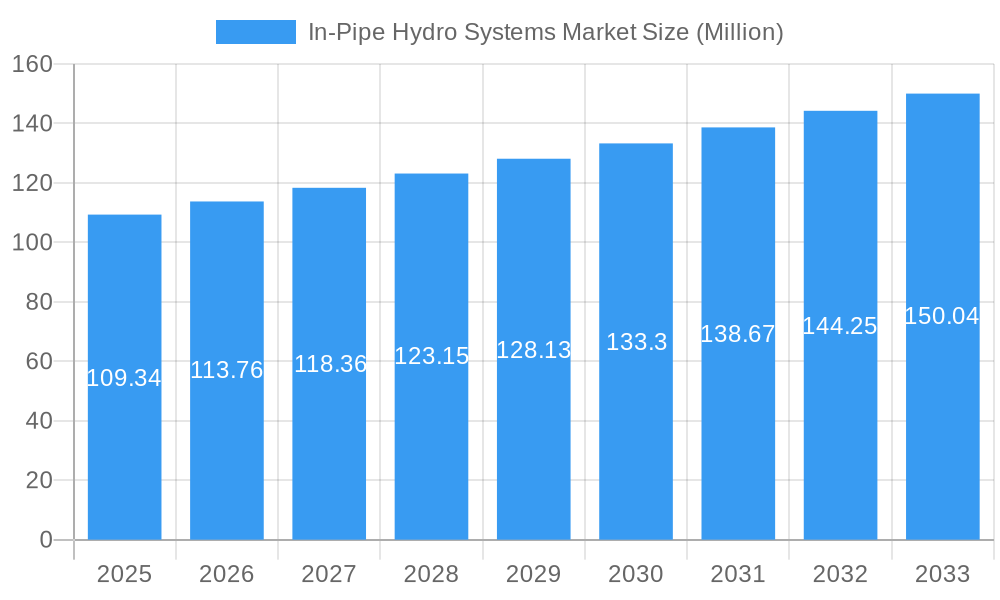
The In-Pipe Hydro Systems market is experiencing robust growth, projected to reach a market size of $109.34 million in 2025 and exhibiting a Compound Annual Growth Rate (CAGR) of 3.87% from 2025 to 2033. This expansion is driven by increasing demand for sustainable and renewable energy sources, particularly in municipal and industrial water systems. Government initiatives promoting renewable energy adoption and stricter regulations on carbon emissions further fuel market growth. The rising awareness of environmental concerns and the need for energy-efficient solutions across various sectors, including irrigation and urban building applications, are also significant contributors. Technological advancements leading to improved efficiency and reduced installation costs are making in-pipe hydro systems a more economically viable option, expanding their market penetration. The market is segmented by application (municipal water/wastewater, industrial water, and other applications) and capacity (pico-hydro, micro-hydro, and mini-hydro), offering diverse opportunities for market players. Growth is expected to be strongest in regions with significant water infrastructure and a commitment to renewable energy, such as North America, Europe, and Asia-Pacific. However, high initial investment costs and the geographical limitations of suitable locations for system implementation pose challenges to market expansion.
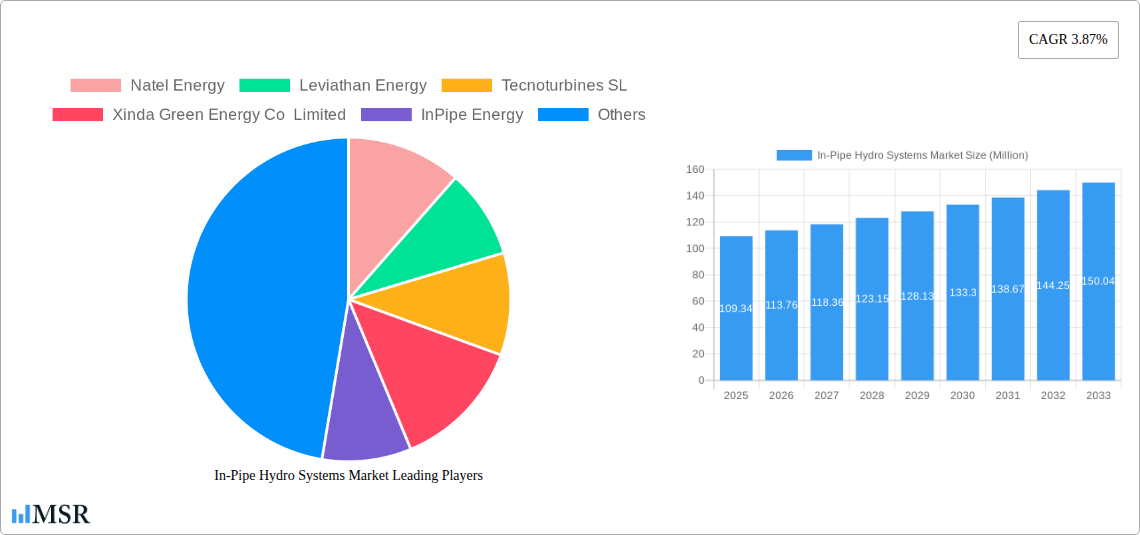
In-Pipe Hydro Systems Market Market Size (In Million)
The competitive landscape includes established players like Natel Energy, Leviathan Energy, and Tecnoturbines SL, along with emerging companies focusing on innovation and technological advancements. Strategic partnerships and collaborations are anticipated to become increasingly crucial in navigating market challenges and capturing larger market shares. Future growth will likely be influenced by the development of more efficient and cost-effective technologies, government policies, and the expanding adoption of smart water management systems. The continuous development of advanced turbines and energy storage solutions will likely unlock new applications and propel the market forward. The market's success will depend on overcoming challenges related to standardization, grid integration, and public awareness.
In-Pipe Hydro Systems Market Company Market Share
In-Pipe Hydro Systems Market Report: Unlocking Clean Energy from Water Flow
This comprehensive report provides an in-depth analysis of the In-Pipe Hydro Systems market, offering valuable insights for industry stakeholders, investors, and researchers. Covering the period from 2019 to 2033, with a focus on 2025, this report unveils the market's dynamics, trends, and future potential. It meticulously examines key segments including application (municipal, industrial, and other), capacity (pico-hydro, micro-hydro, mini-hydro), and leading players like Natel Energy, Leviathan Energy, Tecnoturbines SL, Xinda Green Energy Co Limited, InPipe Energy, HS Dynamic Energy Co Ltd, GS-Hydro, Rentricity Inc, and Lucid Energy Inc. The report projects a xx Million market value by 2033, showcasing significant growth opportunities in this burgeoning sector of renewable energy.
In-Pipe Hydro Systems Market Market Concentration & Dynamics
The In-Pipe Hydro Systems market exhibits a moderately concentrated landscape, with a few major players holding significant market share. However, the market is witnessing increased participation from smaller, innovative companies, leading to a dynamic competitive environment. Innovation is primarily driven by advancements in turbine technology, improved energy efficiency, and smart grid integration. Regulatory frameworks supporting renewable energy adoption significantly influence market growth, while existing infrastructure and the availability of suitable water pipelines are key determinants. Substitute products, such as solar and wind power, pose some competitive pressure, but the unique advantages of in-pipe hydro, particularly its ability to leverage existing infrastructure, present a strong differentiator. End-user trends towards sustainability and reduced carbon footprints fuel market demand. Mergers and acquisitions (M&A) activity is relatively low currently (estimated at xx deals in the last 5 years), indicating a market still in a growth phase, with potential for increased consolidation in the future.
- Market Share: Top 5 players hold approximately xx% of the market share (2025).
- M&A Activity: xx deals recorded between 2020 and 2025.
- Regulatory Landscape: Favorable policies in several regions are driving market growth.
- Innovation Ecosystem: Significant focus on improving turbine efficiency and reducing installation costs.
In-Pipe Hydro Systems Market Industry Insights & Trends
The In-Pipe Hydro Systems market is experiencing robust growth, driven by the increasing demand for renewable energy sources and the need for sustainable water management solutions. The market size was estimated at xx Million in 2025 and is projected to reach xx Million by 2033, exhibiting a Compound Annual Growth Rate (CAGR) of xx% during the forecast period (2025-2033). Technological advancements, such as the development of more efficient and cost-effective turbines and improved energy storage solutions, are major growth drivers. Consumer behavior shifts toward eco-friendly solutions are also significantly impacting market demand. Furthermore, supportive government policies and incentives for renewable energy adoption are further accelerating market expansion. Rising energy prices and concerns about climate change are bolstering investment in clean energy technologies like in-pipe hydro. This market is further strengthened by the growing awareness among municipalities and industries of the potential for cost savings and environmental benefits. The shift towards smart water management systems is further enhancing the appeal of in-pipe hydro systems, optimizing energy generation alongside efficient water distribution.
Key Markets & Segments Leading In-Pipe Hydro Systems Market
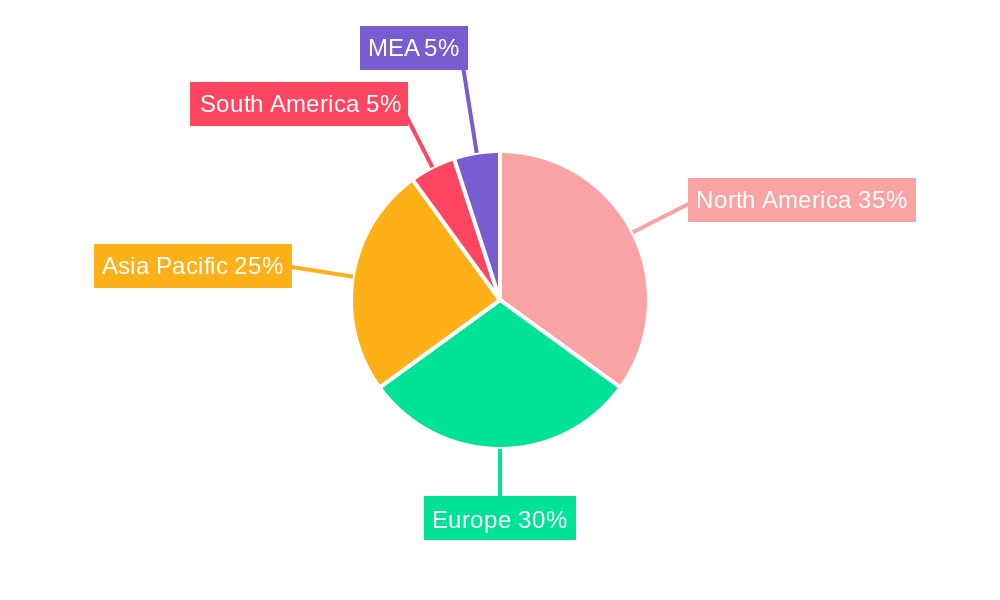
The Municipal Water or Wastewater Systems segment dominates the In-Pipe Hydro Systems market, accounting for approximately xx% of the total market share in 2025. This dominance is attributable to the large-scale deployment potential in existing water infrastructure and the substantial energy savings achievable. The Micro-hydro capacity segment (Up To 100kW) also holds a significant share, offering a balanced approach between energy output and cost-effectiveness. Geographically, North America and Europe are currently leading the market, driven by supportive regulatory frameworks and strong investments in renewable energy infrastructure.
- Key Market Drivers:
- Municipal Water/Wastewater Systems: Existing infrastructure, large-scale deployment potential, significant energy savings.
- Micro-hydro Capacity: Cost-effectiveness, scalability, and suitable for diverse applications.
- North America & Europe: Strong government support, robust renewable energy policies, and high environmental awareness.
- Dominance Analysis: The Municipal Water segment's significant market share stems from the high energy generation potential within pre-existing water systems, minimizing upfront infrastructural costs. The Micro-hydro segment's widespread adoption reflects its optimal balance of energy output and capital expenditure, making it attractive for various applications. The regional leadership of North America and Europe showcases the effects of favorable policy environments and proactive investment in green energy alternatives.
In-Pipe Hydro Systems Market Product Developments
Recent product innovations focus on enhancing turbine efficiency, reducing installation complexity, and improving system reliability. Key developments include the introduction of advanced materials for turbine components, improved control systems for optimizing energy generation, and the integration of smart monitoring capabilities. These technological advancements enhance the cost-effectiveness and overall performance of in-pipe hydro systems, widening their applicability across diverse water infrastructure projects and creating a competitive advantage in the market. The HydroXS system from InPipe Energy, released in July 2022, exemplifies these trends, highlighting the industry's focus on improved energy recovery technology for municipal water pipelines.
Challenges in the In-Pipe Hydro Systems Market Market
Significant challenges include high initial investment costs for some system types, particularly for large-scale installations. Regulatory hurdles and permitting processes can also delay project implementation. Moreover, the availability of suitable water pipelines and pressure differentials for optimal energy generation can be geographically limiting. Supply chain disruptions impacting the procurement of specialized components can also hamper market growth. The competitive landscape, with the emergence of new players and established renewable energy providers, presents further challenges. These factors collectively contribute to market entry barriers and potential variations in project profitability.
Forces Driving In-Pipe Hydro Systems Market Growth
Technological advancements are significantly driving market growth, as evidenced by increased turbine efficiency and reduced installation costs. Favorable government policies and incentives for renewable energy adoption, such as tax credits and subsidies, provide strong impetus. Growing concerns about climate change and the need for sustainable energy solutions are also fueling demand. The increasing cost of fossil fuels makes clean energy alternatives like in-pipe hydro increasingly economically attractive. The rising awareness of the environmental and economic benefits, particularly for municipalities and industries, further accelerates market adoption. Examples include the successful implementation of the InPipe system in California (December 2023).
Challenges in the In-Pipe Hydro Systems Market Market
Long-term growth will depend on overcoming initial investment costs through innovative financing models and reduced manufacturing costs. Strategic partnerships between technology providers and water management companies are crucial for market expansion. Further research and development focusing on enhancing system durability, efficiency, and reliability are vital. Exploring new markets and applications, particularly in developing countries with substantial water infrastructure, will unlock significant growth potential. Expansion into untapped sectors, like irrigation systems and building applications, will be a key long-term catalyst.
Emerging Opportunities in In-Pipe Hydro Systems Market
Emerging opportunities lie in integrating in-pipe hydro systems with smart water management platforms, enabling real-time monitoring and optimization of energy generation and water distribution. The development of hybrid systems, combining in-pipe hydro with other renewable energy sources, offers further potential. Expansion into new geographic regions with favorable water resources and supportive government policies will unlock substantial market growth. Increased focus on modular and prefabricated systems will reduce installation times and costs. Exploring niche applications in industrial settings, such as wastewater treatment plants, presents additional growth avenues.
Leading Players in the In-Pipe Hydro Systems Market Sector
- Natel Energy
- Leviathan Energy
- Tecnoturbines SL
- Xinda Green Energy Co Limited
- InPipe Energy
- HS Dynamic Energy Co Ltd
- GS-Hydro
- Rentricity Inc
- Lucid Energy Inc
Key Milestones in In-Pipe Hydro Systems Market Industry
- December 2023: InPipe Energy's first California installation with EBMUD marks a significant market entry and validation of the technology's effectiveness.
- July 2022: InPipe Energy's launch of the HydroXS technology showcases advancements in micro-hydro energy recovery, enhancing the market's technological capabilities.
Strategic Outlook for In-Pipe Hydro Systems Market Market
The In-Pipe Hydro Systems market holds significant long-term growth potential, driven by increasing demand for clean energy, technological advancements, and supportive government policies. Strategic opportunities lie in developing cost-effective and scalable solutions, fostering partnerships with water management companies, and expanding into new geographic markets and applications. Focus on technological innovation, market education, and strategic collaborations will be key to unlocking the full potential of this emerging sector of renewable energy. The market is expected to experience a significant surge in the coming decade, driven by sustained investments and a growing awareness of environmental sustainability.
In-Pipe Hydro Systems Market Segmentation
-
1. Application
- 1.1. Municipal Water or Wastewater Systems
- 1.2. Industrial Water Systems
- 1.3. Other Ap
-
2. Capacity
- 2.1. Pico-hydro (Up To 5kW)
- 2.2. Micro-hydro (Up To 100kW)
- 2.3. Mini-hydro (100kW and Above)
In-Pipe Hydro Systems Market Segmentation By Geography
-
1. North America
- 1.1. United States
- 1.2. Canada
- 1.3. Rest of North America
-
2. Asia Pacific
- 2.1. China
- 2.2. Japan
- 2.3. South Korea
- 2.4. India
- 2.5. Malaysia
- 2.6. Thailand
- 2.7. Indonesia
- 2.8. Vietnam
- 2.9. Rest of Asia Pacific
-
3. Europe
- 3.1. United Kingdom
- 3.2. Germany
- 3.3. France
- 3.4. Italy
- 3.5. Spain
- 3.6. Nordic Countries
- 3.7. Turkey
- 3.8. Russia
- 3.9. Rest of Europe
-
4. South America
- 4.1. Brazil
- 4.2. Argentina
- 4.3. Colombia
- 4.4. Rest of South America
-
5. Middle East and Africa
- 5.1. Saudi Arabia
- 5.2. United Arab Emirates
- 5.3. Nigeria
- 5.4. Qatar
- 5.5. Egypt
- 5.6. Rest of Middle East and Africa
In-Pipe Hydro Systems Market Regional Market Share
Geographic Coverage of In-Pipe Hydro Systems Market
In-Pipe Hydro Systems Market REPORT HIGHLIGHTS
| Aspects | Details |
|---|---|
| Study Period | 2020-2034 |
| Base Year | 2025 |
| Estimated Year | 2026 |
| Forecast Period | 2026-2034 |
| Historical Period | 2020-2025 |
| Growth Rate | CAGR of 3.87% from 2020-2034 |
| Segmentation |
|
Table of Contents
- 1. Introduction
- 1.1. Research Scope
- 1.2. Market Segmentation
- 1.3. Research Objective
- 1.4. Definitions and Assumptions
- 2. Executive Summary
- 2.1. Market Snapshot
- 3. Market Dynamics
- 3.1. Market Drivers
- 3.2. Market Restrains
- 3.3. Market Trends
- 3.4. Market Opportunities
- 4. Market Factor Analysis
- 4.1. Porters Five Forces
- 4.1.1. Bargaining Power of Suppliers
- 4.1.2. Bargaining Power of Buyers
- 4.1.3. Threat of New Entrants
- 4.1.4. Threat of Substitutes
- 4.1.5. Competitive Rivalry
- 4.2. PESTEL analysis
- 4.3. BCG Analysis
- 4.3.1. Stars (High Growth, High Market Share)
- 4.3.2. Cash Cows (Low Growth, High Market Share)
- 4.3.3. Question Mark (High Growth, Low Market Share)
- 4.3.4. Dogs (Low Growth, Low Market Share)
- 4.4. Ansoff Matrix Analysis
- 4.5. Supply Chain Analysis
- 4.6. Regulatory Landscape
- 4.7. Current Market Potential and Opportunity Assessment (TAM–SAM–SOM Framework)
- 4.8. MSR Analyst Note
- 4.1. Porters Five Forces
- 5. Market Analysis, Insights and Forecast 2021-2033
- 5.1. Market Analysis, Insights and Forecast - by Application
- 5.1.1. Municipal Water or Wastewater Systems
- 5.1.2. Industrial Water Systems
- 5.1.3. Other Ap
- 5.2. Market Analysis, Insights and Forecast - by Capacity
- 5.2.1. Pico-hydro (Up To 5kW)
- 5.2.2. Micro-hydro (Up To 100kW)
- 5.2.3. Mini-hydro (100kW and Above)
- 5.3. Market Analysis, Insights and Forecast - by Region
- 5.3.1. North America
- 5.3.2. Asia Pacific
- 5.3.3. Europe
- 5.3.4. South America
- 5.3.5. Middle East and Africa
- 5.1. Market Analysis, Insights and Forecast - by Application
- 6. Global In-Pipe Hydro Systems Market Analysis, Insights and Forecast, 2021-2033
- 6.1. Market Analysis, Insights and Forecast - by Application
- 6.1.1. Municipal Water or Wastewater Systems
- 6.1.2. Industrial Water Systems
- 6.1.3. Other Ap
- 6.2. Market Analysis, Insights and Forecast - by Capacity
- 6.2.1. Pico-hydro (Up To 5kW)
- 6.2.2. Micro-hydro (Up To 100kW)
- 6.2.3. Mini-hydro (100kW and Above)
- 6.1. Market Analysis, Insights and Forecast - by Application
- 7. North America In-Pipe Hydro Systems Market Analysis, Insights and Forecast, 2020-2032
- 7.1. Market Analysis, Insights and Forecast - by Application
- 7.1.1. Municipal Water or Wastewater Systems
- 7.1.2. Industrial Water Systems
- 7.1.3. Other Ap
- 7.2. Market Analysis, Insights and Forecast - by Capacity
- 7.2.1. Pico-hydro (Up To 5kW)
- 7.2.2. Micro-hydro (Up To 100kW)
- 7.2.3. Mini-hydro (100kW and Above)
- 7.1. Market Analysis, Insights and Forecast - by Application
- 8. Asia Pacific In-Pipe Hydro Systems Market Analysis, Insights and Forecast, 2020-2032
- 8.1. Market Analysis, Insights and Forecast - by Application
- 8.1.1. Municipal Water or Wastewater Systems
- 8.1.2. Industrial Water Systems
- 8.1.3. Other Ap
- 8.2. Market Analysis, Insights and Forecast - by Capacity
- 8.2.1. Pico-hydro (Up To 5kW)
- 8.2.2. Micro-hydro (Up To 100kW)
- 8.2.3. Mini-hydro (100kW and Above)
- 8.1. Market Analysis, Insights and Forecast - by Application
- 9. Europe In-Pipe Hydro Systems Market Analysis, Insights and Forecast, 2020-2032
- 9.1. Market Analysis, Insights and Forecast - by Application
- 9.1.1. Municipal Water or Wastewater Systems
- 9.1.2. Industrial Water Systems
- 9.1.3. Other Ap
- 9.2. Market Analysis, Insights and Forecast - by Capacity
- 9.2.1. Pico-hydro (Up To 5kW)
- 9.2.2. Micro-hydro (Up To 100kW)
- 9.2.3. Mini-hydro (100kW and Above)
- 9.1. Market Analysis, Insights and Forecast - by Application
- 10. South America In-Pipe Hydro Systems Market Analysis, Insights and Forecast, 2020-2032
- 10.1. Market Analysis, Insights and Forecast - by Application
- 10.1.1. Municipal Water or Wastewater Systems
- 10.1.2. Industrial Water Systems
- 10.1.3. Other Ap
- 10.2. Market Analysis, Insights and Forecast - by Capacity
- 10.2.1. Pico-hydro (Up To 5kW)
- 10.2.2. Micro-hydro (Up To 100kW)
- 10.2.3. Mini-hydro (100kW and Above)
- 10.1. Market Analysis, Insights and Forecast - by Application
- 11. Middle East and Africa In-Pipe Hydro Systems Market Analysis, Insights and Forecast, 2020-2032
- 11.1. Market Analysis, Insights and Forecast - by Application
- 11.1.1. Municipal Water or Wastewater Systems
- 11.1.2. Industrial Water Systems
- 11.1.3. Other Ap
- 11.2. Market Analysis, Insights and Forecast - by Capacity
- 11.2.1. Pico-hydro (Up To 5kW)
- 11.2.2. Micro-hydro (Up To 100kW)
- 11.2.3. Mini-hydro (100kW and Above)
- 11.1. Market Analysis, Insights and Forecast - by Application
- 12. Competitive Analysis
- 12.1. Company Profiles
- 12.1.1 Natel Energy
- 12.1.1.1. Company Overview
- 12.1.1.2. Products
- 12.1.1.3. Company Financials
- 12.1.1.4. SWOT Analysis
- 12.1.2 Leviathan Energy
- 12.1.2.1. Company Overview
- 12.1.2.2. Products
- 12.1.2.3. Company Financials
- 12.1.2.4. SWOT Analysis
- 12.1.3 Tecnoturbines SL
- 12.1.3.1. Company Overview
- 12.1.3.2. Products
- 12.1.3.3. Company Financials
- 12.1.3.4. SWOT Analysis
- 12.1.4 Xinda Green Energy Co Limited
- 12.1.4.1. Company Overview
- 12.1.4.2. Products
- 12.1.4.3. Company Financials
- 12.1.4.4. SWOT Analysis
- 12.1.5 InPipe Energy
- 12.1.5.1. Company Overview
- 12.1.5.2. Products
- 12.1.5.3. Company Financials
- 12.1.5.4. SWOT Analysis
- 12.1.6 HS Dynamic Energy Co Ltd
- 12.1.6.1. Company Overview
- 12.1.6.2. Products
- 12.1.6.3. Company Financials
- 12.1.6.4. SWOT Analysis
- 12.1.7 GS-Hydro
- 12.1.7.1. Company Overview
- 12.1.7.2. Products
- 12.1.7.3. Company Financials
- 12.1.7.4. SWOT Analysis
- 12.1.8 Rentricity Inc
- 12.1.8.1. Company Overview
- 12.1.8.2. Products
- 12.1.8.3. Company Financials
- 12.1.8.4. SWOT Analysis
- 12.1.9 Lucid Energy Inc
- 12.1.9.1. Company Overview
- 12.1.9.2. Products
- 12.1.9.3. Company Financials
- 12.1.9.4. SWOT Analysis
- 12.1.1 Natel Energy
- 12.2. Market Entropy
- 12.2.1 Company's Key Areas Served
- 12.2.2 Recent Developments
- 12.3. Company Market Share Analysis 2025
- 12.3.1 Top 5 Companies Market Share Analysis
- 12.3.2 Top 3 Companies Market Share Analysis
- 12.4. List of Potential Customers
- 13. Research Methodology
List of Figures
- Figure 1: Global In-Pipe Hydro Systems Market Revenue Breakdown (Million, %) by Region 2025 & 2033
- Figure 2: North America In-Pipe Hydro Systems Market Revenue (Million), by Application 2025 & 2033
- Figure 3: North America In-Pipe Hydro Systems Market Revenue Share (%), by Application 2025 & 2033
- Figure 4: North America In-Pipe Hydro Systems Market Revenue (Million), by Capacity 2025 & 2033
- Figure 5: North America In-Pipe Hydro Systems Market Revenue Share (%), by Capacity 2025 & 2033
- Figure 6: North America In-Pipe Hydro Systems Market Revenue (Million), by Country 2025 & 2033
- Figure 7: North America In-Pipe Hydro Systems Market Revenue Share (%), by Country 2025 & 2033
- Figure 8: Asia Pacific In-Pipe Hydro Systems Market Revenue (Million), by Application 2025 & 2033
- Figure 9: Asia Pacific In-Pipe Hydro Systems Market Revenue Share (%), by Application 2025 & 2033
- Figure 10: Asia Pacific In-Pipe Hydro Systems Market Revenue (Million), by Capacity 2025 & 2033
- Figure 11: Asia Pacific In-Pipe Hydro Systems Market Revenue Share (%), by Capacity 2025 & 2033
- Figure 12: Asia Pacific In-Pipe Hydro Systems Market Revenue (Million), by Country 2025 & 2033
- Figure 13: Asia Pacific In-Pipe Hydro Systems Market Revenue Share (%), by Country 2025 & 2033
- Figure 14: Europe In-Pipe Hydro Systems Market Revenue (Million), by Application 2025 & 2033
- Figure 15: Europe In-Pipe Hydro Systems Market Revenue Share (%), by Application 2025 & 2033
- Figure 16: Europe In-Pipe Hydro Systems Market Revenue (Million), by Capacity 2025 & 2033
- Figure 17: Europe In-Pipe Hydro Systems Market Revenue Share (%), by Capacity 2025 & 2033
- Figure 18: Europe In-Pipe Hydro Systems Market Revenue (Million), by Country 2025 & 2033
- Figure 19: Europe In-Pipe Hydro Systems Market Revenue Share (%), by Country 2025 & 2033
- Figure 20: South America In-Pipe Hydro Systems Market Revenue (Million), by Application 2025 & 2033
- Figure 21: South America In-Pipe Hydro Systems Market Revenue Share (%), by Application 2025 & 2033
- Figure 22: South America In-Pipe Hydro Systems Market Revenue (Million), by Capacity 2025 & 2033
- Figure 23: South America In-Pipe Hydro Systems Market Revenue Share (%), by Capacity 2025 & 2033
- Figure 24: South America In-Pipe Hydro Systems Market Revenue (Million), by Country 2025 & 2033
- Figure 25: South America In-Pipe Hydro Systems Market Revenue Share (%), by Country 2025 & 2033
- Figure 26: Middle East and Africa In-Pipe Hydro Systems Market Revenue (Million), by Application 2025 & 2033
- Figure 27: Middle East and Africa In-Pipe Hydro Systems Market Revenue Share (%), by Application 2025 & 2033
- Figure 28: Middle East and Africa In-Pipe Hydro Systems Market Revenue (Million), by Capacity 2025 & 2033
- Figure 29: Middle East and Africa In-Pipe Hydro Systems Market Revenue Share (%), by Capacity 2025 & 2033
- Figure 30: Middle East and Africa In-Pipe Hydro Systems Market Revenue (Million), by Country 2025 & 2033
- Figure 31: Middle East and Africa In-Pipe Hydro Systems Market Revenue Share (%), by Country 2025 & 2033
List of Tables
- Table 1: Global In-Pipe Hydro Systems Market Revenue Million Forecast, by Application 2020 & 2033
- Table 2: Global In-Pipe Hydro Systems Market Revenue Million Forecast, by Capacity 2020 & 2033
- Table 3: Global In-Pipe Hydro Systems Market Revenue Million Forecast, by Region 2020 & 2033
- Table 4: Global In-Pipe Hydro Systems Market Revenue Million Forecast, by Application 2020 & 2033
- Table 5: Global In-Pipe Hydro Systems Market Revenue Million Forecast, by Capacity 2020 & 2033
- Table 6: Global In-Pipe Hydro Systems Market Revenue Million Forecast, by Country 2020 & 2033
- Table 7: United States In-Pipe Hydro Systems Market Revenue (Million) Forecast, by Application 2020 & 2033
- Table 8: Canada In-Pipe Hydro Systems Market Revenue (Million) Forecast, by Application 2020 & 2033
- Table 9: Rest of North America In-Pipe Hydro Systems Market Revenue (Million) Forecast, by Application 2020 & 2033
- Table 10: Global In-Pipe Hydro Systems Market Revenue Million Forecast, by Application 2020 & 2033
- Table 11: Global In-Pipe Hydro Systems Market Revenue Million Forecast, by Capacity 2020 & 2033
- Table 12: Global In-Pipe Hydro Systems Market Revenue Million Forecast, by Country 2020 & 2033
- Table 13: China In-Pipe Hydro Systems Market Revenue (Million) Forecast, by Application 2020 & 2033
- Table 14: Japan In-Pipe Hydro Systems Market Revenue (Million) Forecast, by Application 2020 & 2033
- Table 15: South Korea In-Pipe Hydro Systems Market Revenue (Million) Forecast, by Application 2020 & 2033
- Table 16: India In-Pipe Hydro Systems Market Revenue (Million) Forecast, by Application 2020 & 2033
- Table 17: Malaysia In-Pipe Hydro Systems Market Revenue (Million) Forecast, by Application 2020 & 2033
- Table 18: Thailand In-Pipe Hydro Systems Market Revenue (Million) Forecast, by Application 2020 & 2033
- Table 19: Indonesia In-Pipe Hydro Systems Market Revenue (Million) Forecast, by Application 2020 & 2033
- Table 20: Vietnam In-Pipe Hydro Systems Market Revenue (Million) Forecast, by Application 2020 & 2033
- Table 21: Rest of Asia Pacific In-Pipe Hydro Systems Market Revenue (Million) Forecast, by Application 2020 & 2033
- Table 22: Global In-Pipe Hydro Systems Market Revenue Million Forecast, by Application 2020 & 2033
- Table 23: Global In-Pipe Hydro Systems Market Revenue Million Forecast, by Capacity 2020 & 2033
- Table 24: Global In-Pipe Hydro Systems Market Revenue Million Forecast, by Country 2020 & 2033
- Table 25: United Kingdom In-Pipe Hydro Systems Market Revenue (Million) Forecast, by Application 2020 & 2033
- Table 26: Germany In-Pipe Hydro Systems Market Revenue (Million) Forecast, by Application 2020 & 2033
- Table 27: France In-Pipe Hydro Systems Market Revenue (Million) Forecast, by Application 2020 & 2033
- Table 28: Italy In-Pipe Hydro Systems Market Revenue (Million) Forecast, by Application 2020 & 2033
- Table 29: Spain In-Pipe Hydro Systems Market Revenue (Million) Forecast, by Application 2020 & 2033
- Table 30: Nordic Countries In-Pipe Hydro Systems Market Revenue (Million) Forecast, by Application 2020 & 2033
- Table 31: Turkey In-Pipe Hydro Systems Market Revenue (Million) Forecast, by Application 2020 & 2033
- Table 32: Russia In-Pipe Hydro Systems Market Revenue (Million) Forecast, by Application 2020 & 2033
- Table 33: Rest of Europe In-Pipe Hydro Systems Market Revenue (Million) Forecast, by Application 2020 & 2033
- Table 34: Global In-Pipe Hydro Systems Market Revenue Million Forecast, by Application 2020 & 2033
- Table 35: Global In-Pipe Hydro Systems Market Revenue Million Forecast, by Capacity 2020 & 2033
- Table 36: Global In-Pipe Hydro Systems Market Revenue Million Forecast, by Country 2020 & 2033
- Table 37: Brazil In-Pipe Hydro Systems Market Revenue (Million) Forecast, by Application 2020 & 2033
- Table 38: Argentina In-Pipe Hydro Systems Market Revenue (Million) Forecast, by Application 2020 & 2033
- Table 39: Colombia In-Pipe Hydro Systems Market Revenue (Million) Forecast, by Application 2020 & 2033
- Table 40: Rest of South America In-Pipe Hydro Systems Market Revenue (Million) Forecast, by Application 2020 & 2033
- Table 41: Global In-Pipe Hydro Systems Market Revenue Million Forecast, by Application 2020 & 2033
- Table 42: Global In-Pipe Hydro Systems Market Revenue Million Forecast, by Capacity 2020 & 2033
- Table 43: Global In-Pipe Hydro Systems Market Revenue Million Forecast, by Country 2020 & 2033
- Table 44: Saudi Arabia In-Pipe Hydro Systems Market Revenue (Million) Forecast, by Application 2020 & 2033
- Table 45: United Arab Emirates In-Pipe Hydro Systems Market Revenue (Million) Forecast, by Application 2020 & 2033
- Table 46: Nigeria In-Pipe Hydro Systems Market Revenue (Million) Forecast, by Application 2020 & 2033
- Table 47: Qatar In-Pipe Hydro Systems Market Revenue (Million) Forecast, by Application 2020 & 2033
- Table 48: Egypt In-Pipe Hydro Systems Market Revenue (Million) Forecast, by Application 2020 & 2033
- Table 49: Rest of Middle East and Africa In-Pipe Hydro Systems Market Revenue (Million) Forecast, by Application 2020 & 2033
Frequently Asked Questions
1. What is the projected Compound Annual Growth Rate (CAGR) of the In-Pipe Hydro Systems Market?
The projected CAGR is approximately 3.87%.
2. Which companies are prominent players in the In-Pipe Hydro Systems Market?
Key companies in the market include Natel Energy, Leviathan Energy, Tecnoturbines SL, Xinda Green Energy Co Limited, InPipe Energy, HS Dynamic Energy Co Ltd, GS-Hydro, Rentricity Inc, Lucid Energy Inc.
3. What are the main segments of the In-Pipe Hydro Systems Market?
The market segments include Application, Capacity.
4. Can you provide details about the market size?
The market size is estimated to be USD 109.34 Million as of 2022.
5. What are some drivers contributing to market growth?
Increased Focus on Renewable Power Generation4.; Rising Need for Efficient Power Generation.
6. What are the notable trends driving market growth?
Industrial Water Systems to Witness Significant Demand.
7. Are there any restraints impacting market growth?
High Initial Capital Investment.
8. Can you provide examples of recent developments in the market?
December 2023: The East Bay Municipal Utility District (EBMUD) partnered with InPipe Energy to generate electricity from the flow of water in its water distribution system. According to a release, this is the first installation of the InPipe technology in California. The new in-conduit hydroelectric system works similarly to traditional pressure-regulating valves in EBMUD’s water distribution system. However, it uses a turbine to reduce water pressure while generating electricity and creating a reliable, clean source of power.
9. What pricing options are available for accessing the report?
Pricing options include single-user, multi-user, and enterprise licenses priced at USD 4750, USD 5250, and USD 8750 respectively.
10. Is the market size provided in terms of value or volume?
The market size is provided in terms of value, measured in Million.
11. Are there any specific market keywords associated with the report?
Yes, the market keyword associated with the report is "In-Pipe Hydro Systems Market," which aids in identifying and referencing the specific market segment covered.
12. How do I determine which pricing option suits my needs best?
The pricing options vary based on user requirements and access needs. Individual users may opt for single-user licenses, while businesses requiring broader access may choose multi-user or enterprise licenses for cost-effective access to the report.
13. Are there any additional resources or data provided in the In-Pipe Hydro Systems Market report?
While the report offers comprehensive insights, it's advisable to review the specific contents or supplementary materials provided to ascertain if additional resources or data are available.
14. How can I stay updated on further developments or reports in the In-Pipe Hydro Systems Market?
To stay informed about further developments, trends, and reports in the In-Pipe Hydro Systems Market, consider subscribing to industry newsletters, following relevant companies and organizations, or regularly checking reputable industry news sources and publications.
Methodology
Step 1 - Identification of Relevant Samples Size from Population Database


Step 2 - Approaches for Defining Global Market Size (Value, Volume* & Price*)

Note*: In applicable scenarios
Step 3 - Data Sources
Primary Research
- Web Analytics
- Survey Reports
- Research Institute
- Latest Research Reports
- Opinion Leaders
Secondary Research
- Annual Reports
- White Paper
- Latest Press Release
- Industry Association
- Paid Database
- Investor Presentations

Step 4 - Data Triangulation
Involves using different sources of information in order to increase the validity of a study
These sources are likely to be stakeholders in a program - participants, other researchers, program staff, other community members, and so on.
Then we put all data in single framework & apply various statistical tools to find out the dynamic on the market.
During the analysis stage, feedback from the stakeholder groups would be compared to determine areas of agreement as well as areas of divergence