

Key Insights
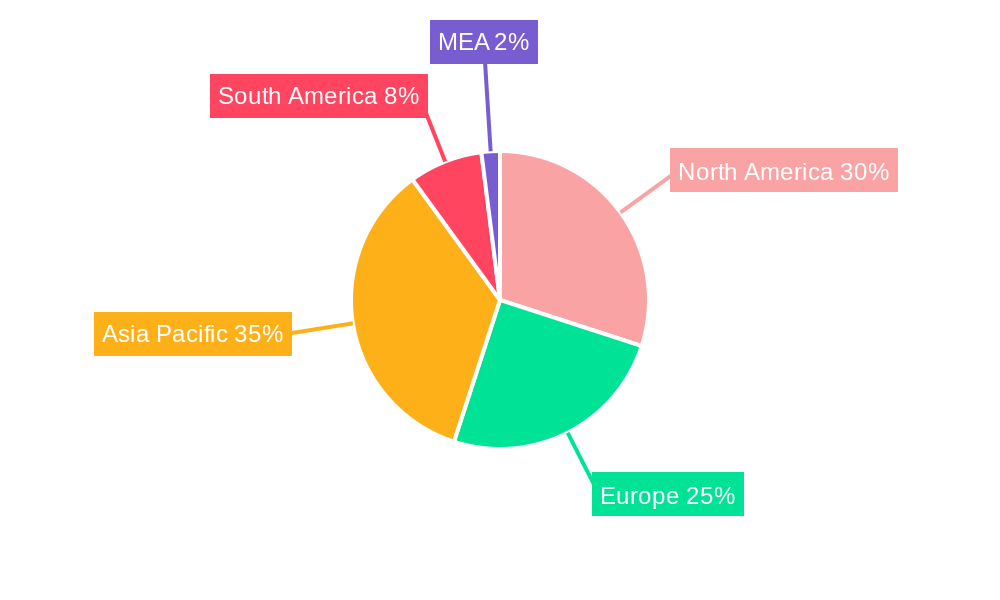
The global legumes market, encompassing soybeans, peas, and beans, is experiencing steady growth, projected to maintain a Compound Annual Growth Rate (CAGR) of 4.50% from 2025 to 2033. This expansion is driven by several key factors. Increasing consumer awareness of the health benefits associated with plant-based proteins and diets, coupled with rising demand for sustainable and ethically sourced food products, are significantly bolstering market demand. The versatility of legumes, applicable across food, feed, and industrial sectors, further fuels this growth. Specifically, the food sector benefits from the use of legumes in diverse culinary applications, while the feed industry utilizes them as a cost-effective and nutritious protein source for livestock. The industrial sector leverages legumes for various applications, including biofuel production and the creation of bio-based materials. However, the market faces challenges such as fluctuating commodity prices, potential crop yield variations due to climate change, and competition from alternative protein sources. Geographic distribution is notable, with North America and Asia Pacific currently holding significant market shares, driven by robust agricultural sectors and substantial consumer populations. However, emerging markets in regions like South America and Africa are expected to exhibit strong growth potential in the coming years as consumption patterns evolve and infrastructure improves.
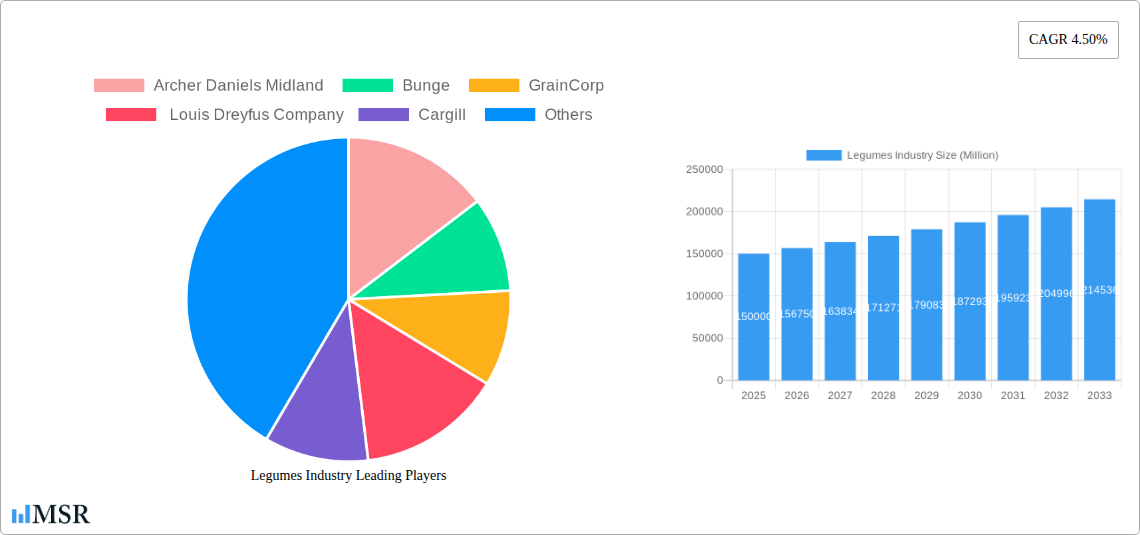
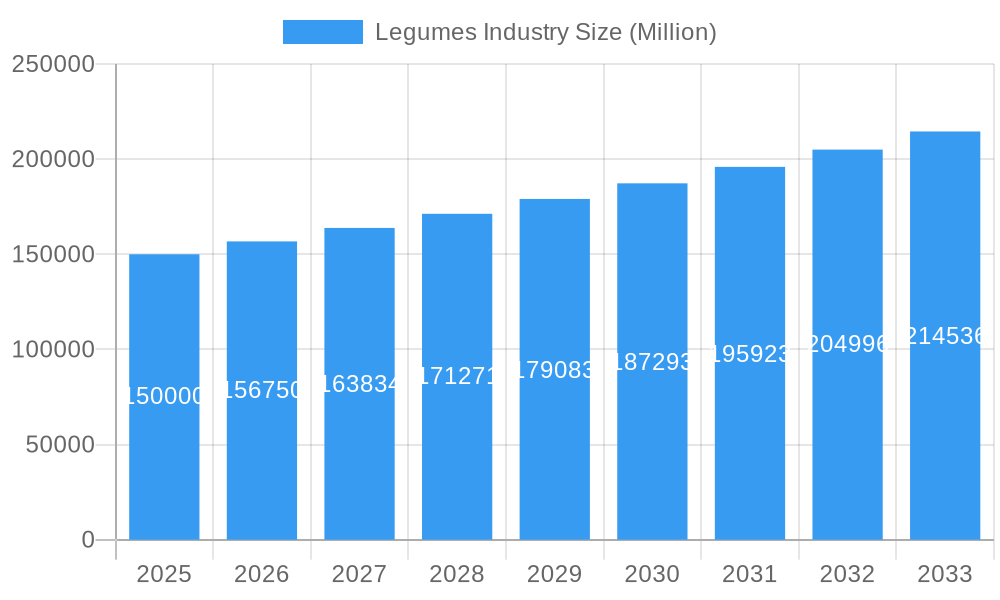
Legumes Industry Market Size (In Billion)
Major players like Archer Daniels Midland, Bunge, Cargill, GrainCorp, and Louis Dreyfus Company dominate the market, leveraging their established supply chains and processing capabilities. These companies are actively investing in research and development to enhance legume yields, develop innovative legume-based products, and improve processing efficiencies. Furthermore, the increasing focus on traceability and sustainability within the agricultural sector presents an opportunity for these companies to differentiate themselves and attract environmentally conscious consumers. Future market growth is anticipated to be largely influenced by advancements in agricultural technologies, the development of value-added legume products, and evolving government policies that support sustainable agriculture. Regional differences in growth will likely reflect economic development, dietary habits, and agricultural infrastructure across various geographies.
Legumes Industry Company Market Share
Legumes Industry Report: A Comprehensive Market Analysis (2019-2033)
This in-depth report provides a comprehensive analysis of the global legumes industry, encompassing market size, growth drivers, key players, and future trends. With a study period spanning 2019-2033, a base year of 2025, and a forecast period of 2025-2033, this report offers actionable insights for industry stakeholders, investors, and businesses operating within this dynamic sector. The report leverages rigorous data analysis to project a market valued at xx Million by 2033, showcasing significant growth opportunities.
Legumes Industry Market Concentration & Dynamics
The global legumes industry exhibits a moderately concentrated market structure, with key players such as Archer Daniels Midland, Bunge, Cargill, GrainCorp, and Louis Dreyfus Company holding significant market share. These companies collectively account for approximately xx% of the total market in 2025. Market concentration is influenced by economies of scale, vertical integration, and global distribution networks.
- Innovation Ecosystems: The industry witnesses continuous innovation in processing technologies, genetic engineering, and sustainable farming practices.
- Regulatory Frameworks: Government regulations concerning food safety, labeling, and sustainable agriculture significantly impact the industry's operations.
- Substitute Products: Competition arises from alternative protein sources, such as meat substitutes and other plant-based proteins.
- End-User Trends: Increasing demand for plant-based diets and health-conscious consumers fuels market growth.
- M&A Activities: The industry has witnessed xx M&A deals between 2019 and 2024, with a notable increase in consolidation activities driven by the need for expansion and diversification.
Legumes Industry Insights & Trends
The global legumes market is experiencing robust growth, driven by rising global population, increasing demand for plant-based protein, and expanding applications across food, feed, and industrial sectors. The market size was valued at xx Million in 2025 and is projected to reach xx Million by 2033, exhibiting a CAGR of xx% during the forecast period. This growth is propelled by several factors:
- Shifting Consumer Preferences: The growing preference for plant-based diets and health-conscious eating habits is significantly driving market expansion.
- Technological Advancements: Innovations in legume processing, genetic modification, and sustainable farming practices enhance production efficiency and quality.
- Government Initiatives: Policies promoting sustainable agriculture and food security contribute positively to industry growth.
- Economic Growth in Emerging Markets: Rapid economic development in developing nations fuels the demand for affordable and nutritious protein sources.
Key Markets & Segments Leading Legumes Industry
The Asia-Pacific region dominates the global legumes market, accounting for xx% of the total market share in 2025. This dominance is attributed to a large population, high consumption of legumes in traditional cuisines, and rapid economic growth. Within the product type segment, soybeans constitute the largest share, followed by peas and beans. The food application segment leads in terms of revenue, followed by feed and industrial applications.
- Drivers for Asia-Pacific Dominance:
- High population density and growing middle class.
- Increasing adoption of plant-based diets.
- Favorable government policies supporting agriculture.
- Robust infrastructure for production and distribution.
The detailed dominance analysis reveals the intricate interplay of these factors across various regions and segments, providing a deeper understanding of market dynamics.
Legumes Industry Product Developments
Significant advancements in legume processing technologies, including improved extraction methods and ingredient modifications, are enhancing the nutritional value and functional properties of legume-based products. New applications are emerging in food processing, animal feed formulation, and industrial uses, expanding market opportunities and driving competitive innovation. Companies are focusing on developing novel products with improved taste, texture, and shelf life, catering to diverse consumer needs.
Challenges in the Legumes Industry Market
The legumes industry faces several challenges, including volatile commodity prices, fluctuating supply chains due to weather patterns and geopolitical events, and intense competition among key players. Regulatory hurdles in different regions and rising input costs further exacerbate these challenges, potentially impacting profitability and market stability. These factors collectively contribute to xx% reduction in profitability in 2024 compared to 2019.
Forces Driving Legumes Industry Growth
Technological advancements in processing and genetic modification, coupled with favorable government policies supporting sustainable agriculture and economic growth in emerging markets, are key factors driving industry growth. Increasing consumer awareness of the health benefits of legumes and the rise of plant-based diets further accelerate market expansion.
Long-Term Growth Catalysts in the Legumes Industry
Long-term growth in the legumes industry will be fueled by continuous innovation in product development, strategic partnerships across the value chain, and expansion into new geographical markets. Exploring novel applications of legumes and adapting to changing consumer preferences will be crucial for sustainable growth.
Emerging Opportunities in Legumes Industry
Emerging opportunities exist in developing value-added legume products, targeting niche markets with functional foods and specialized ingredients. Innovations in sustainable and precision agriculture techniques will enhance efficiency and reduce environmental impact. Growing demand for plant-based alternatives in meat and dairy products presents significant growth potential for the legume industry.
Leading Players in the Legumes Industry Sector
Key Milestones in Legumes Industry Industry
- 2020: Launch of a new soy protein isolate with improved functionalities.
- 2021: Acquisition of a leading legume processing company by Cargill.
- 2022: Introduction of a sustainable legume farming initiative by Archer Daniels Midland.
- 2023: Development of new pea-based protein ingredients for meat alternatives.
- 2024: Implementation of new traceability systems to improve supply chain transparency.
Strategic Outlook for Legumes Industry Market
The future of the legumes industry looks promising, characterized by continued growth driven by robust demand, technological innovation, and evolving consumer preferences. Companies that embrace sustainable practices, invest in research and development, and effectively leverage global distribution networks will be well-positioned to capture significant market share in the years to come.
Legumes Industry Segmentation
- 1. Production Analysis
- 2. Consumption Analysis
- 3. Import Market Analysis (Value & Volume)
- 4. Export Market Analysis (Value & Volume)
- 5. Price Trend Analysis
Legumes Industry Segmentation By Geography
-
1. North America
- 1.1. United States
- 1.2. Mexico
-
2. Europe
- 2.1. Russia
- 2.2. Turkey
- 2.3. Italy
-
3. Asia Pacific
- 3.1. Myanmar
- 3.2. India
- 3.3. China
- 3.4. Australia
-
4. South America
- 4.1. Argentina
- 4.2. Brazil
-
5. Middle East and Africa
- 5.1. United Republic of Tanzania
- 5.2. Uganda
- 5.3. Kenya
Legumes Industry Regional Market Share
Geographic Coverage of Legumes Industry
Legumes Industry REPORT HIGHLIGHTS
| Aspects | Details |
|---|---|
| Study Period | 2020-2034 |
| Base Year | 2025 |
| Estimated Year | 2026 |
| Forecast Period | 2026-2034 |
| Historical Period | 2020-2025 |
| Growth Rate | CAGR of 6.2% from 2020-2034 |
| Segmentation |
|
Table of Contents
- 1. Introduction
- 1.1. Research Scope
- 1.2. Market Segmentation
- 1.3. Research Objective
- 1.4. Definitions and Assumptions
- 2. Executive Summary
- 2.1. Market Snapshot
- 3. Market Dynamics
- 3.1. Market Drivers
- 3.2. Market Restrains
- 3.3. Market Trends
- 3.4. Market Opportunities
- 4. Market Factor Analysis
- 4.1. Porters Five Forces
- 4.1.1. Bargaining Power of Suppliers
- 4.1.2. Bargaining Power of Buyers
- 4.1.3. Threat of New Entrants
- 4.1.4. Threat of Substitutes
- 4.1.5. Competitive Rivalry
- 4.2. PESTEL analysis
- 4.3. BCG Analysis
- 4.3.1. Stars (High Growth, High Market Share)
- 4.3.2. Cash Cows (Low Growth, High Market Share)
- 4.3.3. Question Mark (High Growth, Low Market Share)
- 4.3.4. Dogs (Low Growth, Low Market Share)
- 4.4. Ansoff Matrix Analysis
- 4.5. Supply Chain Analysis
- 4.6. Regulatory Landscape
- 4.7. Current Market Potential and Opportunity Assessment (TAM–SAM–SOM Framework)
- 4.8. MSR Analyst Note
- 4.1. Porters Five Forces
- 5. Market Analysis, Insights and Forecast 2021-2033
- 5.1. Market Analysis, Insights and Forecast - by Production Analysis
- 5.2. Market Analysis, Insights and Forecast - by Consumption Analysis
- 5.3. Market Analysis, Insights and Forecast - by Import Market Analysis (Value & Volume)
- 5.4. Market Analysis, Insights and Forecast - by Export Market Analysis (Value & Volume)
- 5.5. Market Analysis, Insights and Forecast - by Price Trend Analysis
- 5.6. Market Analysis, Insights and Forecast - by Region
- 5.6.1. North America
- 5.6.2. Europe
- 5.6.3. Asia Pacific
- 5.6.4. South America
- 5.6.5. Middle East and Africa
- 6. Global Legumes Industry Analysis, Insights and Forecast, 2021-2033
- 6.1. Market Analysis, Insights and Forecast - by Production Analysis
- 6.2. Market Analysis, Insights and Forecast - by Consumption Analysis
- 6.3. Market Analysis, Insights and Forecast - by Import Market Analysis (Value & Volume)
- 6.4. Market Analysis, Insights and Forecast - by Export Market Analysis (Value & Volume)
- 6.5. Market Analysis, Insights and Forecast - by Price Trend Analysis
- 7. North America Legumes Industry Analysis, Insights and Forecast, 2020-2032
- 7.1. Market Analysis, Insights and Forecast - by Production Analysis
- 7.2. Market Analysis, Insights and Forecast - by Consumption Analysis
- 7.3. Market Analysis, Insights and Forecast - by Import Market Analysis (Value & Volume)
- 7.4. Market Analysis, Insights and Forecast - by Export Market Analysis (Value & Volume)
- 7.5. Market Analysis, Insights and Forecast - by Price Trend Analysis
- 8. Europe Legumes Industry Analysis, Insights and Forecast, 2020-2032
- 8.1. Market Analysis, Insights and Forecast - by Production Analysis
- 8.2. Market Analysis, Insights and Forecast - by Consumption Analysis
- 8.3. Market Analysis, Insights and Forecast - by Import Market Analysis (Value & Volume)
- 8.4. Market Analysis, Insights and Forecast - by Export Market Analysis (Value & Volume)
- 8.5. Market Analysis, Insights and Forecast - by Price Trend Analysis
- 9. Asia Pacific Legumes Industry Analysis, Insights and Forecast, 2020-2032
- 9.1. Market Analysis, Insights and Forecast - by Production Analysis
- 9.2. Market Analysis, Insights and Forecast - by Consumption Analysis
- 9.3. Market Analysis, Insights and Forecast - by Import Market Analysis (Value & Volume)
- 9.4. Market Analysis, Insights and Forecast - by Export Market Analysis (Value & Volume)
- 9.5. Market Analysis, Insights and Forecast - by Price Trend Analysis
- 10. South America Legumes Industry Analysis, Insights and Forecast, 2020-2032
- 10.1. Market Analysis, Insights and Forecast - by Production Analysis
- 10.2. Market Analysis, Insights and Forecast - by Consumption Analysis
- 10.3. Market Analysis, Insights and Forecast - by Import Market Analysis (Value & Volume)
- 10.4. Market Analysis, Insights and Forecast - by Export Market Analysis (Value & Volume)
- 10.5. Market Analysis, Insights and Forecast - by Price Trend Analysis
- 11. Middle East and Africa Legumes Industry Analysis, Insights and Forecast, 2020-2032
- 11.1. Market Analysis, Insights and Forecast - by Production Analysis
- 11.2. Market Analysis, Insights and Forecast - by Consumption Analysis
- 11.3. Market Analysis, Insights and Forecast - by Import Market Analysis (Value & Volume)
- 11.4. Market Analysis, Insights and Forecast - by Export Market Analysis (Value & Volume)
- 11.5. Market Analysis, Insights and Forecast - by Price Trend Analysis
- 12. Competitive Analysis
- 12.1. Company Profiles
- 12.1.1 Archer Daniels Midland
- 12.1.1.1. Company Overview
- 12.1.1.2. Products
- 12.1.1.3. Company Financials
- 12.1.1.4. SWOT Analysis
- 12.1.2 Bunge
- 12.1.2.1. Company Overview
- 12.1.2.2. Products
- 12.1.2.3. Company Financials
- 12.1.2.4. SWOT Analysis
- 12.1.3 GrainCorp
- 12.1.3.1. Company Overview
- 12.1.3.2. Products
- 12.1.3.3. Company Financials
- 12.1.3.4. SWOT Analysis
- 12.1.4 Louis Dreyfus Company
- 12.1.4.1. Company Overview
- 12.1.4.2. Products
- 12.1.4.3. Company Financials
- 12.1.4.4. SWOT Analysis
- 12.1.5 Cargill
- 12.1.5.1. Company Overview
- 12.1.5.2. Products
- 12.1.5.3. Company Financials
- 12.1.5.4. SWOT Analysis
- 12.1.1 Archer Daniels Midland
- 12.2. Market Entropy
- 12.2.1 Company's Key Areas Served
- 12.2.2 Recent Developments
- 12.3. Company Market Share Analysis 2025
- 12.3.1 Top 5 Companies Market Share Analysis
- 12.3.2 Top 3 Companies Market Share Analysis
- 12.4. List of Potential Customers
- 13. Research Methodology
List of Figures
- Figure 1: Global Legumes Industry Revenue Breakdown (undefined, %) by Region 2025 & 2033
- Figure 2: North America Legumes Industry Revenue (undefined), by Production Analysis 2025 & 2033
- Figure 3: North America Legumes Industry Revenue Share (%), by Production Analysis 2025 & 2033
- Figure 4: North America Legumes Industry Revenue (undefined), by Consumption Analysis 2025 & 2033
- Figure 5: North America Legumes Industry Revenue Share (%), by Consumption Analysis 2025 & 2033
- Figure 6: North America Legumes Industry Revenue (undefined), by Import Market Analysis (Value & Volume) 2025 & 2033
- Figure 7: North America Legumes Industry Revenue Share (%), by Import Market Analysis (Value & Volume) 2025 & 2033
- Figure 8: North America Legumes Industry Revenue (undefined), by Export Market Analysis (Value & Volume) 2025 & 2033
- Figure 9: North America Legumes Industry Revenue Share (%), by Export Market Analysis (Value & Volume) 2025 & 2033
- Figure 10: North America Legumes Industry Revenue (undefined), by Price Trend Analysis 2025 & 2033
- Figure 11: North America Legumes Industry Revenue Share (%), by Price Trend Analysis 2025 & 2033
- Figure 12: North America Legumes Industry Revenue (undefined), by Country 2025 & 2033
- Figure 13: North America Legumes Industry Revenue Share (%), by Country 2025 & 2033
- Figure 14: Europe Legumes Industry Revenue (undefined), by Production Analysis 2025 & 2033
- Figure 15: Europe Legumes Industry Revenue Share (%), by Production Analysis 2025 & 2033
- Figure 16: Europe Legumes Industry Revenue (undefined), by Consumption Analysis 2025 & 2033
- Figure 17: Europe Legumes Industry Revenue Share (%), by Consumption Analysis 2025 & 2033
- Figure 18: Europe Legumes Industry Revenue (undefined), by Import Market Analysis (Value & Volume) 2025 & 2033
- Figure 19: Europe Legumes Industry Revenue Share (%), by Import Market Analysis (Value & Volume) 2025 & 2033
- Figure 20: Europe Legumes Industry Revenue (undefined), by Export Market Analysis (Value & Volume) 2025 & 2033
- Figure 21: Europe Legumes Industry Revenue Share (%), by Export Market Analysis (Value & Volume) 2025 & 2033
- Figure 22: Europe Legumes Industry Revenue (undefined), by Price Trend Analysis 2025 & 2033
- Figure 23: Europe Legumes Industry Revenue Share (%), by Price Trend Analysis 2025 & 2033
- Figure 24: Europe Legumes Industry Revenue (undefined), by Country 2025 & 2033
- Figure 25: Europe Legumes Industry Revenue Share (%), by Country 2025 & 2033
- Figure 26: Asia Pacific Legumes Industry Revenue (undefined), by Production Analysis 2025 & 2033
- Figure 27: Asia Pacific Legumes Industry Revenue Share (%), by Production Analysis 2025 & 2033
- Figure 28: Asia Pacific Legumes Industry Revenue (undefined), by Consumption Analysis 2025 & 2033
- Figure 29: Asia Pacific Legumes Industry Revenue Share (%), by Consumption Analysis 2025 & 2033
- Figure 30: Asia Pacific Legumes Industry Revenue (undefined), by Import Market Analysis (Value & Volume) 2025 & 2033
- Figure 31: Asia Pacific Legumes Industry Revenue Share (%), by Import Market Analysis (Value & Volume) 2025 & 2033
- Figure 32: Asia Pacific Legumes Industry Revenue (undefined), by Export Market Analysis (Value & Volume) 2025 & 2033
- Figure 33: Asia Pacific Legumes Industry Revenue Share (%), by Export Market Analysis (Value & Volume) 2025 & 2033
- Figure 34: Asia Pacific Legumes Industry Revenue (undefined), by Price Trend Analysis 2025 & 2033
- Figure 35: Asia Pacific Legumes Industry Revenue Share (%), by Price Trend Analysis 2025 & 2033
- Figure 36: Asia Pacific Legumes Industry Revenue (undefined), by Country 2025 & 2033
- Figure 37: Asia Pacific Legumes Industry Revenue Share (%), by Country 2025 & 2033
- Figure 38: South America Legumes Industry Revenue (undefined), by Production Analysis 2025 & 2033
- Figure 39: South America Legumes Industry Revenue Share (%), by Production Analysis 2025 & 2033
- Figure 40: South America Legumes Industry Revenue (undefined), by Consumption Analysis 2025 & 2033
- Figure 41: South America Legumes Industry Revenue Share (%), by Consumption Analysis 2025 & 2033
- Figure 42: South America Legumes Industry Revenue (undefined), by Import Market Analysis (Value & Volume) 2025 & 2033
- Figure 43: South America Legumes Industry Revenue Share (%), by Import Market Analysis (Value & Volume) 2025 & 2033
- Figure 44: South America Legumes Industry Revenue (undefined), by Export Market Analysis (Value & Volume) 2025 & 2033
- Figure 45: South America Legumes Industry Revenue Share (%), by Export Market Analysis (Value & Volume) 2025 & 2033
- Figure 46: South America Legumes Industry Revenue (undefined), by Price Trend Analysis 2025 & 2033
- Figure 47: South America Legumes Industry Revenue Share (%), by Price Trend Analysis 2025 & 2033
- Figure 48: South America Legumes Industry Revenue (undefined), by Country 2025 & 2033
- Figure 49: South America Legumes Industry Revenue Share (%), by Country 2025 & 2033
- Figure 50: Middle East and Africa Legumes Industry Revenue (undefined), by Production Analysis 2025 & 2033
- Figure 51: Middle East and Africa Legumes Industry Revenue Share (%), by Production Analysis 2025 & 2033
- Figure 52: Middle East and Africa Legumes Industry Revenue (undefined), by Consumption Analysis 2025 & 2033
- Figure 53: Middle East and Africa Legumes Industry Revenue Share (%), by Consumption Analysis 2025 & 2033
- Figure 54: Middle East and Africa Legumes Industry Revenue (undefined), by Import Market Analysis (Value & Volume) 2025 & 2033
- Figure 55: Middle East and Africa Legumes Industry Revenue Share (%), by Import Market Analysis (Value & Volume) 2025 & 2033
- Figure 56: Middle East and Africa Legumes Industry Revenue (undefined), by Export Market Analysis (Value & Volume) 2025 & 2033
- Figure 57: Middle East and Africa Legumes Industry Revenue Share (%), by Export Market Analysis (Value & Volume) 2025 & 2033
- Figure 58: Middle East and Africa Legumes Industry Revenue (undefined), by Price Trend Analysis 2025 & 2033
- Figure 59: Middle East and Africa Legumes Industry Revenue Share (%), by Price Trend Analysis 2025 & 2033
- Figure 60: Middle East and Africa Legumes Industry Revenue (undefined), by Country 2025 & 2033
- Figure 61: Middle East and Africa Legumes Industry Revenue Share (%), by Country 2025 & 2033
List of Tables
- Table 1: Global Legumes Industry Revenue undefined Forecast, by Production Analysis 2020 & 2033
- Table 2: Global Legumes Industry Revenue undefined Forecast, by Consumption Analysis 2020 & 2033
- Table 3: Global Legumes Industry Revenue undefined Forecast, by Import Market Analysis (Value & Volume) 2020 & 2033
- Table 4: Global Legumes Industry Revenue undefined Forecast, by Export Market Analysis (Value & Volume) 2020 & 2033
- Table 5: Global Legumes Industry Revenue undefined Forecast, by Price Trend Analysis 2020 & 2033
- Table 6: Global Legumes Industry Revenue undefined Forecast, by Region 2020 & 2033
- Table 7: Global Legumes Industry Revenue undefined Forecast, by Production Analysis 2020 & 2033
- Table 8: Global Legumes Industry Revenue undefined Forecast, by Consumption Analysis 2020 & 2033
- Table 9: Global Legumes Industry Revenue undefined Forecast, by Import Market Analysis (Value & Volume) 2020 & 2033
- Table 10: Global Legumes Industry Revenue undefined Forecast, by Export Market Analysis (Value & Volume) 2020 & 2033
- Table 11: Global Legumes Industry Revenue undefined Forecast, by Price Trend Analysis 2020 & 2033
- Table 12: Global Legumes Industry Revenue undefined Forecast, by Country 2020 & 2033
- Table 13: United States Legumes Industry Revenue (undefined) Forecast, by Application 2020 & 2033
- Table 14: Mexico Legumes Industry Revenue (undefined) Forecast, by Application 2020 & 2033
- Table 15: Global Legumes Industry Revenue undefined Forecast, by Production Analysis 2020 & 2033
- Table 16: Global Legumes Industry Revenue undefined Forecast, by Consumption Analysis 2020 & 2033
- Table 17: Global Legumes Industry Revenue undefined Forecast, by Import Market Analysis (Value & Volume) 2020 & 2033
- Table 18: Global Legumes Industry Revenue undefined Forecast, by Export Market Analysis (Value & Volume) 2020 & 2033
- Table 19: Global Legumes Industry Revenue undefined Forecast, by Price Trend Analysis 2020 & 2033
- Table 20: Global Legumes Industry Revenue undefined Forecast, by Country 2020 & 2033
- Table 21: Russia Legumes Industry Revenue (undefined) Forecast, by Application 2020 & 2033
- Table 22: Turkey Legumes Industry Revenue (undefined) Forecast, by Application 2020 & 2033
- Table 23: Italy Legumes Industry Revenue (undefined) Forecast, by Application 2020 & 2033
- Table 24: Global Legumes Industry Revenue undefined Forecast, by Production Analysis 2020 & 2033
- Table 25: Global Legumes Industry Revenue undefined Forecast, by Consumption Analysis 2020 & 2033
- Table 26: Global Legumes Industry Revenue undefined Forecast, by Import Market Analysis (Value & Volume) 2020 & 2033
- Table 27: Global Legumes Industry Revenue undefined Forecast, by Export Market Analysis (Value & Volume) 2020 & 2033
- Table 28: Global Legumes Industry Revenue undefined Forecast, by Price Trend Analysis 2020 & 2033
- Table 29: Global Legumes Industry Revenue undefined Forecast, by Country 2020 & 2033
- Table 30: Myanmar Legumes Industry Revenue (undefined) Forecast, by Application 2020 & 2033
- Table 31: India Legumes Industry Revenue (undefined) Forecast, by Application 2020 & 2033
- Table 32: China Legumes Industry Revenue (undefined) Forecast, by Application 2020 & 2033
- Table 33: Australia Legumes Industry Revenue (undefined) Forecast, by Application 2020 & 2033
- Table 34: Global Legumes Industry Revenue undefined Forecast, by Production Analysis 2020 & 2033
- Table 35: Global Legumes Industry Revenue undefined Forecast, by Consumption Analysis 2020 & 2033
- Table 36: Global Legumes Industry Revenue undefined Forecast, by Import Market Analysis (Value & Volume) 2020 & 2033
- Table 37: Global Legumes Industry Revenue undefined Forecast, by Export Market Analysis (Value & Volume) 2020 & 2033
- Table 38: Global Legumes Industry Revenue undefined Forecast, by Price Trend Analysis 2020 & 2033
- Table 39: Global Legumes Industry Revenue undefined Forecast, by Country 2020 & 2033
- Table 40: Argentina Legumes Industry Revenue (undefined) Forecast, by Application 2020 & 2033
- Table 41: Brazil Legumes Industry Revenue (undefined) Forecast, by Application 2020 & 2033
- Table 42: Global Legumes Industry Revenue undefined Forecast, by Production Analysis 2020 & 2033
- Table 43: Global Legumes Industry Revenue undefined Forecast, by Consumption Analysis 2020 & 2033
- Table 44: Global Legumes Industry Revenue undefined Forecast, by Import Market Analysis (Value & Volume) 2020 & 2033
- Table 45: Global Legumes Industry Revenue undefined Forecast, by Export Market Analysis (Value & Volume) 2020 & 2033
- Table 46: Global Legumes Industry Revenue undefined Forecast, by Price Trend Analysis 2020 & 2033
- Table 47: Global Legumes Industry Revenue undefined Forecast, by Country 2020 & 2033
- Table 48: United Republic of Tanzania Legumes Industry Revenue (undefined) Forecast, by Application 2020 & 2033
- Table 49: Uganda Legumes Industry Revenue (undefined) Forecast, by Application 2020 & 2033
- Table 50: Kenya Legumes Industry Revenue (undefined) Forecast, by Application 2020 & 2033
Frequently Asked Questions
1. What is the projected Compound Annual Growth Rate (CAGR) of the Legumes Industry?
The projected CAGR is approximately 6.2%.
2. Which companies are prominent players in the Legumes Industry?
Key companies in the market include Archer Daniels Midland , Bunge , GrainCorp, Louis Dreyfus Company, Cargill .
3. What are the main segments of the Legumes Industry?
The market segments include Production Analysis, Consumption Analysis, Import Market Analysis (Value & Volume), Export Market Analysis (Value & Volume), Price Trend Analysis.
4. Can you provide details about the market size?
The market size is estimated to be USD XXX N/A as of 2022.
5. What are some drivers contributing to market growth?
Increasing Berry Consumption for Health Benefits; Increasing Adoption of High-Technology Farm Practices; Growing Usage of Berries in the Food and Beverage Industries.
6. What are the notable trends driving market growth?
Increasing Inclination Toward Vegan Diet.
7. Are there any restraints impacting market growth?
High Production Cost Involved in Berry Production; Increasing Disease and Pest Infestations.
8. Can you provide examples of recent developments in the market?
N/A
9. What pricing options are available for accessing the report?
Pricing options include single-user, multi-user, and enterprise licenses priced at USD 4750, USD 5250, and USD 8750 respectively.
10. Is the market size provided in terms of value or volume?
The market size is provided in terms of value, measured in N/A.
11. Are there any specific market keywords associated with the report?
Yes, the market keyword associated with the report is "Legumes Industry," which aids in identifying and referencing the specific market segment covered.
12. How do I determine which pricing option suits my needs best?
The pricing options vary based on user requirements and access needs. Individual users may opt for single-user licenses, while businesses requiring broader access may choose multi-user or enterprise licenses for cost-effective access to the report.
13. Are there any additional resources or data provided in the Legumes Industry report?
While the report offers comprehensive insights, it's advisable to review the specific contents or supplementary materials provided to ascertain if additional resources or data are available.
14. How can I stay updated on further developments or reports in the Legumes Industry?
To stay informed about further developments, trends, and reports in the Legumes Industry, consider subscribing to industry newsletters, following relevant companies and organizations, or regularly checking reputable industry news sources and publications.
Methodology
Step 1 - Identification of Relevant Samples Size from Population Database


Step 2 - Approaches for Defining Global Market Size (Value, Volume* & Price*)

Note*: In applicable scenarios
Step 3 - Data Sources
Primary Research
- Web Analytics
- Survey Reports
- Research Institute
- Latest Research Reports
- Opinion Leaders
Secondary Research
- Annual Reports
- White Paper
- Latest Press Release
- Industry Association
- Paid Database
- Investor Presentations

Step 4 - Data Triangulation
Involves using different sources of information in order to increase the validity of a study
These sources are likely to be stakeholders in a program - participants, other researchers, program staff, other community members, and so on.
Then we put all data in single framework & apply various statistical tools to find out the dynamic on the market.
During the analysis stage, feedback from the stakeholder groups would be compared to determine areas of agreement as well as areas of divergence