

Key Insights
The global Marine Power Battery market is poised for substantial expansion, driven by the increasing adoption of electric and hybrid propulsion systems in maritime vessels. The market is projected to reach USD 14.57 billion by 2025, exhibiting a robust Compound Annual Growth Rate (CAGR) of 11.09% during the forecast period of 2025-2033. This significant growth is underpinned by a confluence of factors, including stringent environmental regulations aimed at reducing emissions from shipping, the rising demand for sustainable and eco-friendly maritime operations, and advancements in battery technology that enhance energy density, lifespan, and safety. Furthermore, government incentives and subsidies supporting the transition to cleaner maritime transport are expected to accelerate market penetration. The primary applications benefiting from this surge include ferries, offshore support vessels, inland waterway transport, and recreational boats, all of which are increasingly looking to electrify their fleets to comply with emissions standards and reduce operational costs.
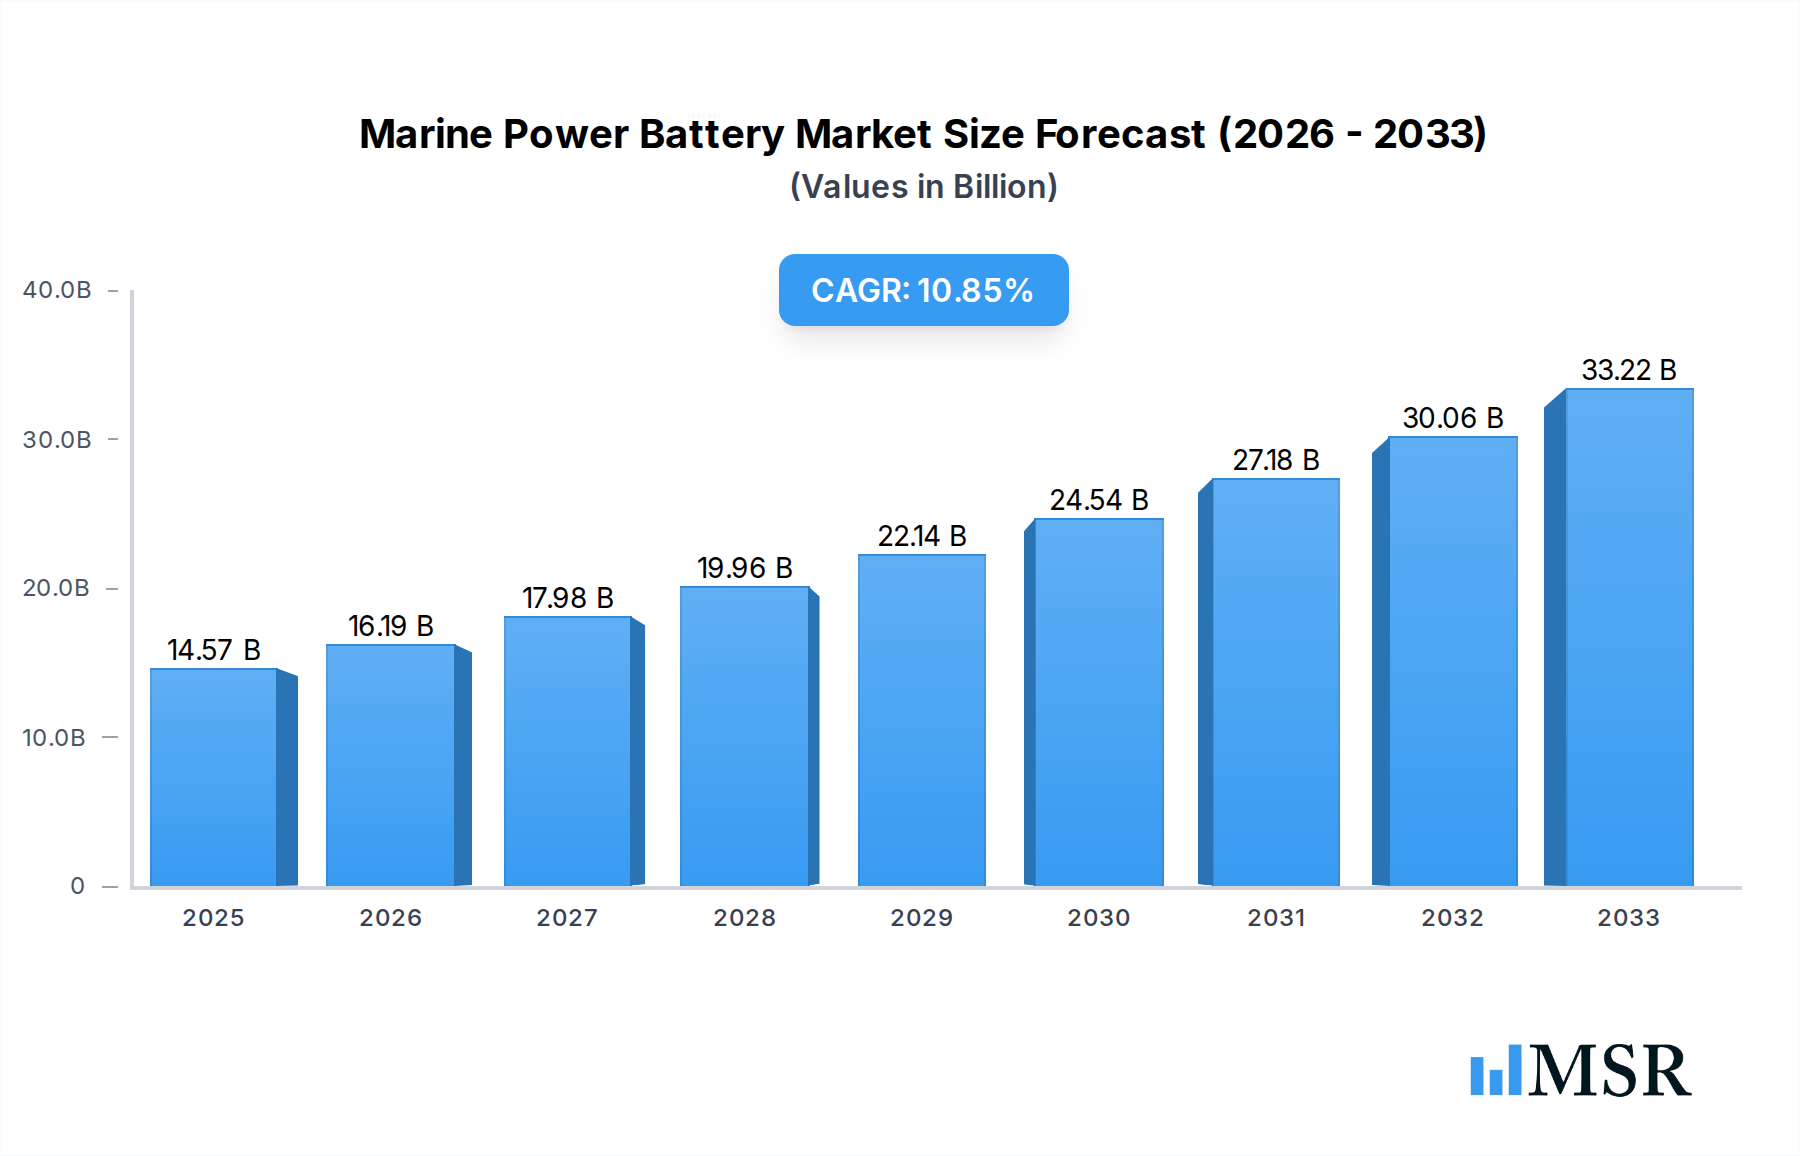
Marine Power Battery Market Size (In Billion)
Key growth drivers for the Marine Power Battery market include the escalating cost of traditional fossil fuels, which makes electric propulsion a more economically viable long-term solution. Innovations in battery chemistries, such as the development of higher-energy-density lithium-ion batteries and the exploration of solid-state battery technologies, are crucial for overcoming the range and charging time limitations previously associated with electric vessels. Emerging trends like the development of smart charging infrastructure for ports and the integration of battery management systems (BMS) for optimal performance and safety are also shaping the market landscape. However, the market faces certain restraints, including the high initial investment cost of battery systems, the need for specialized charging infrastructure, and concerns regarding battery recycling and disposal. Despite these challenges, the undeniable push towards decarbonization in the shipping industry, coupled with ongoing technological advancements and supportive regulatory frameworks, positions the Marine Power Battery market for impressive and sustained growth.

Marine Power Battery Company Market Share
Marine Power Battery Market: A Comprehensive Analysis & Forecast (2019-2033)
This in-depth report provides a crucial analysis of the global Marine Power Battery market, a rapidly evolving sector powering the decarbonization of maritime operations. With an estimated market size of $XX billion in the base year 2025, this study forecasts significant growth to $XX billion by 2033, exhibiting a Compound Annual Growth Rate (CAGR) of XX% during the forecast period. The report offers actionable insights for stakeholders seeking to capitalize on opportunities within the electric marine propulsion, hybrid marine power, and offshore energy storage sectors. We meticulously examine key players, emerging technologies, and the competitive landscape, providing a XX-year historical perspective from 2019 to 2024.
Marine Power Battery Market Concentration & Dynamics
The Marine Power Battery market is characterized by a moderate to high level of concentration, with key players investing heavily in innovation and capacity expansion. Leading companies are actively pursuing research and development in lithium-ion marine batteries, solid-state battery technology for marine applications, and advanced battery management systems (BMS). The innovation ecosystem is vibrant, driven by stringent environmental regulations and the increasing demand for sustainable maritime solutions. Regulatory frameworks, such as those promoting zero-emission shipping and reducing greenhouse gas emissions in the maritime sector, are pivotal in shaping market dynamics. The threat of substitute products, while present in certain niche applications, is largely mitigated by the superior energy density and performance of advanced battery technologies for demanding marine environments. End-user trends are shifting towards greater adoption of electric and hybrid powertrains across various vessel types, including ferries, cargo ships, workboats, and offshore support vessels. Merger and acquisition (M&A) activities are on the rise, with an estimated XX significant M&A deals recorded during the historical period, reflecting the consolidation and strategic partnerships aimed at securing market share and technological advancements. The market share of leading battery manufacturers is expected to shift, with significant growth anticipated for companies focusing on specialized marine-grade battery solutions.
Marine Power Battery Industry Insights & Trends
The Marine Power Battery industry is experiencing transformative growth, propelled by a confluence of technological advancements, economic incentives, and environmental imperatives. The overarching trend is the urgent need to reduce the carbon footprint of the global maritime sector, a significant contributor to greenhouse gas emissions. This has directly fueled the demand for cleaner energy solutions in shipping, with batteries playing a central role in enabling electric and hybrid propulsion systems. The market size, projected to reach $XX billion by 2025, underscores the substantial economic opportunity. Technological disruptions are at the forefront, with continuous improvements in battery energy density, charging speed, safety features, and lifespan making battery-powered vessels increasingly viable and cost-effective. For instance, advancements in lithium-nickel-manganese-cobalt (NMC) batteries and the emerging promise of lithium-iron-phosphate (LFP) batteries for marine applications offer diverse solutions catering to different operational needs. Evolving consumer behaviors, particularly among shipping companies and charterers, are prioritizing sustainability and operational efficiency, driving the adoption of battery-electric and hybrid vessels. This shift is further supported by the increasing availability of shore power infrastructure and the development of innovative battery-swapping technologies for faster turnaround times. The development of robust battery management systems (BMS) is critical for optimizing performance, ensuring safety, and maximizing the lifespan of marine battery installations, which are subjected to harsh environmental conditions. Furthermore, the integration of advanced battery technologies with renewable energy sources on board vessels and at port facilities is a key trend that will shape the future of sustainable maritime transport. The growing emphasis on electrification of inland waterways, short-sea shipping, and ferry services presents significant opportunities for market expansion. The overall sentiment within the industry is optimistic, with a clear trajectory towards a more electrified and sustainable future for maritime power.
Key Markets & Segments Leading Marine Power Battery
The Marine Power Battery market is experiencing robust growth across several key regions and segments, driven by a combination of economic development, infrastructure investment, and stringent environmental policies. Europe, particularly Northern Europe and the Nordic countries, is a leading market, spearheaded by countries like Norway, which has ambitious targets for zero-emission ferries and a strong commitment to decarbonizing its extensive coastline. The presence of leading marine battery manufacturers and a supportive regulatory environment contribute significantly to this dominance.
In terms of Application, the Ferry segment is a primary driver of growth. Ferries, especially those operating on fixed routes and with predictable power demands, are ideal candidates for electrification. Government mandates and public pressure to reduce emissions in densely populated coastal areas are accelerating the adoption of battery-powered ferries. The increasing investment in new ferry construction incorporating advanced battery systems further bolsters this segment.
The Workboat segment, encompassing vessels like tugboats, service vessels, and fishing boats, also exhibits strong growth potential. The operational characteristics of many workboats, involving frequent stops and starts and relatively shorter operational ranges, make them well-suited for hybrid and fully electric propulsion. Cost savings through reduced fuel consumption and lower maintenance requirements are compelling incentives for adoption.
Within the Type segment, Lithium-ion batteries continue to dominate the Marine Power Battery market. Specifically, advancements in Lithium-Nickel-Manganese-Cobalt (NMC) and Lithium-Iron-Phosphate (LFP) chemistries are crucial. NMC batteries offer high energy density, suitable for applications requiring longer operational range, while LFP batteries are gaining traction due to their enhanced safety, longer cycle life, and competitive cost, making them ideal for applications with less demanding energy requirements and higher safety priorities. The development of marine-grade battery packs with advanced thermal management and robust housing is critical for ensuring performance and longevity in harsh marine environments. The increasing focus on modular battery systems allows for greater flexibility in design and scalability for different vessel sizes and power needs.
Marine Power Battery Product Developments
Product innovation in the Marine Power Battery market is primarily focused on enhancing energy density, improving safety, and extending lifespan. Key developments include the introduction of high-voltage battery systems for larger vessels, enabling more efficient power distribution. Advances in solid-state battery technology promise further improvements in safety and energy storage capabilities, though widespread commercialization for marine applications is still in its nascent stages. Furthermore, modular battery designs are gaining prominence, allowing for flexible configurations and easier integration into diverse vessel architectures. The development of advanced battery management systems (BMS) is crucial, providing real-time monitoring, predictive maintenance, and optimal performance control, essential for the demanding conditions of maritime operations.
Challenges in the Marine Power Battery Market
The Marine Power Battery market faces several significant challenges that need to be addressed for widespread adoption. High upfront costs of battery systems remain a considerable barrier, although declining battery prices and operational cost savings are gradually mitigating this. Limited charging infrastructure at ports and along shipping routes is a critical constraint, hindering the feasibility of long-range electric voyages. Battery degradation and lifespan in harsh marine environments, including exposure to saltwater and extreme temperatures, necessitate robust engineering and maintenance strategies. Supply chain vulnerabilities for critical battery raw materials and regulatory uncertainties regarding battery disposal and recycling also present ongoing challenges. The weight and space requirements of large battery packs can impact vessel design and cargo capacity, requiring innovative solutions.
Forces Driving Marine Power Battery Growth
Several key forces are propelling the growth of the Marine Power Battery market. The most significant is the global push towards decarbonization and stricter environmental regulations by international bodies like the International Maritime Organization (IMO), mandating reductions in greenhouse gas emissions. Technological advancements in battery chemistry, energy density, and charging capabilities are making electric and hybrid propulsion increasingly viable and cost-effective. Growing awareness of the economic benefits, including reduced fuel costs and lower maintenance expenditures associated with electric powertrains, is a major incentive for shipowners. Government support and incentives, such as subsidies for the purchase of green vessels and investments in charging infrastructure, further accelerate adoption. The increasing demand for sustainable tourism and responsible shipping practices from consumers and corporations is also playing a crucial role.
Challenges in the Marine Power Battery Market
Long-term growth catalysts for the Marine Power Battery market are deeply intertwined with ongoing innovation and strategic market expansion. Continuous research and development into next-generation battery chemistries, such as silicon-anode batteries and advanced solid-state technologies, hold the promise of significantly higher energy densities and faster charging times, expanding the operational envelope for electric vessels. The establishment of standardized charging protocols and infrastructure development across major global shipping lanes will be crucial for facilitating intercontinental electric shipping. Strategic partnerships between battery manufacturers, shipyards, and energy providers are essential for developing integrated solutions and accelerating the transition to cleaner maritime transport. Furthermore, the development of circular economy models for battery recycling and second-life applications will address environmental concerns and enhance the sustainability of the entire value chain. Market expansion into new vessel segments and geographical regions with strong environmental mandates will further drive sustained growth.
Emerging Opportunities in Marine Power Battery
Emerging opportunities in the Marine Power Battery market are ripe for exploitation by forward-thinking companies. The rapid development of autonomous shipping and remote-controlled vessels presents a unique opportunity for battery integration, as these vessels often require highly reliable and precise power management. The growing demand for offshore renewable energy solutions, such as floating wind farms, necessitates robust battery storage for power buffering and grid stabilization, creating a substantial market for marine-grade energy storage systems. The trend towards sustainable tourism and luxury yachting is driving demand for quiet, emission-free vessels, opening up premium market segments for advanced battery solutions. Furthermore, the development of innovative financing models and leasing options for marine battery systems can help overcome upfront cost barriers for smaller operators. The potential for grid services and energy arbitrage using large-scale marine battery installations at port locations also represents a significant emerging opportunity.
Leading Players in the Marine Power Battery Sector
CATL Eve Energy Yijiatong Battery Gotion High tech SAFT EST-Floattech Akasol Forsee Power XALT Energy Toshiba
Key Milestones in Marine Power Battery Industry
- 2019: Introduction of advanced lithium-ion battery systems specifically designed for demanding marine environments, leading to increased adoption in ferries and workboats.
- 2020: Significant investment in R&D for solid-state battery technology for marine applications, promising enhanced safety and energy density.
- 2021: Launch of modular battery solutions allowing for flexible integration and scalability across various vessel types.
- 2022: Establishment of strategic partnerships between major battery manufacturers and shipyards to accelerate the development and deployment of electric and hybrid vessels.
- 2023: Increased focus on the development of comprehensive battery management systems (BMS) for improved performance, safety, and predictive maintenance in maritime operations.
- 2024: Growing commitment from regulatory bodies towards setting stricter emission standards, further stimulating demand for zero-emission marine propulsion solutions.
- 2025 (Estimated): Projected widespread adoption of LFP battery chemistries in specific marine applications due to their enhanced safety and cost-effectiveness.
- 2026-2030 (Forecast): Anticipated significant advancements in charging infrastructure and the potential for battery-swapping technologies to gain traction in high-frequency ferry operations.
- 2030-2033 (Forecast): Expected maturation of solid-state battery technology for select marine applications, offering a potential paradigm shift in energy storage.
Strategic Outlook for Marine Power Battery Market
The strategic outlook for the Marine Power Battery market is overwhelmingly positive, driven by a clear and urgent global mandate for decarbonization in the maritime sector. Growth accelerators include continued technological innovation in battery chemistries, leading to higher energy density, faster charging capabilities, and improved safety. The expansion of charging infrastructure, coupled with supportive government policies and incentives, will be critical in overcoming adoption barriers. Strategic partnerships between battery manufacturers, shipbuilders, and energy providers will be key to developing integrated, cost-effective solutions. The market is poised for significant expansion into new vessel segments and geographical regions, particularly those with strong environmental regulations. Furthermore, the development of robust battery recycling and second-life programs will enhance the sustainability of the entire marine energy ecosystem, positioning the sector for long-term, sustainable growth.
Marine Power Battery Segmentation
-
1. Application
- 1.1. undefined
-
2. Type
- 2.1. undefined
Marine Power Battery Segmentation By Geography
- 1. undefined
- 2. undefined
- 3. undefined
- 4. undefined
- 5. undefined

Marine Power Battery Regional Market Share
Geographic Coverage of Marine Power Battery
Marine Power Battery REPORT HIGHLIGHTS
| Aspects | Details |
|---|---|
| Study Period | 2020-2034 |
| Base Year | 2025 |
| Estimated Year | 2026 |
| Forecast Period | 2026-2034 |
| Historical Period | 2020-2025 |
| Growth Rate | CAGR of 11.09% from 2020-2034 |
| Segmentation |
|
Table of Contents
- 1. Introduction
- 1.1. Research Scope
- 1.2. Market Segmentation
- 1.3. Research Objective
- 1.4. Definitions and Assumptions
- 2. Executive Summary
- 2.1. Market Snapshot
- 3. Market Dynamics
- 3.1. Market Drivers
- 3.2. Market Restrains
- 3.3. Market Trends
- 3.4. Market Opportunities
- 4. Market Factor Analysis
- 4.1. Porters Five Forces
- 4.1.1. Bargaining Power of Suppliers
- 4.1.2. Bargaining Power of Buyers
- 4.1.3. Threat of New Entrants
- 4.1.4. Threat of Substitutes
- 4.1.5. Competitive Rivalry
- 4.2. PESTEL analysis
- 4.3. BCG Analysis
- 4.3.1. Stars (High Growth, High Market Share)
- 4.3.2. Cash Cows (Low Growth, High Market Share)
- 4.3.3. Question Mark (High Growth, Low Market Share)
- 4.3.4. Dogs (Low Growth, Low Market Share)
- 4.4. Ansoff Matrix Analysis
- 4.5. Supply Chain Analysis
- 4.6. Regulatory Landscape
- 4.7. Current Market Potential and Opportunity Assessment (TAM–SAM–SOM Framework)
- 4.8. MSR Analyst Note
- 4.1. Porters Five Forces
- 5. Market Analysis, Insights and Forecast 2021-2033
- 5.1. Market Analysis, Insights and Forecast - by Application
- 5.1.1.
- 5.2. Market Analysis, Insights and Forecast - by Type
- 5.2.1.
- 5.3. Market Analysis, Insights and Forecast - by Region
- 5.3.1.
- 5.3.2.
- 5.3.3.
- 5.3.4.
- 5.3.5.
- 5.1. Market Analysis, Insights and Forecast - by Application
- 6. Global Marine Power Battery Analysis, Insights and Forecast, 2021-2033
- 6.1. Market Analysis, Insights and Forecast - by Application
- 6.1.1.
- 6.2. Market Analysis, Insights and Forecast - by Type
- 6.2.1.
- 6.1. Market Analysis, Insights and Forecast - by Application
- 7. undefined Marine Power Battery Analysis, Insights and Forecast, 2020-2032
- 7.1. Market Analysis, Insights and Forecast - by Application
- 7.1.1.
- 7.2. Market Analysis, Insights and Forecast - by Type
- 7.2.1.
- 7.1. Market Analysis, Insights and Forecast - by Application
- 8. undefined Marine Power Battery Analysis, Insights and Forecast, 2020-2032
- 8.1. Market Analysis, Insights and Forecast - by Application
- 8.1.1.
- 8.2. Market Analysis, Insights and Forecast - by Type
- 8.2.1.
- 8.1. Market Analysis, Insights and Forecast - by Application
- 9. undefined Marine Power Battery Analysis, Insights and Forecast, 2020-2032
- 9.1. Market Analysis, Insights and Forecast - by Application
- 9.1.1.
- 9.2. Market Analysis, Insights and Forecast - by Type
- 9.2.1.
- 9.1. Market Analysis, Insights and Forecast - by Application
- 10. undefined Marine Power Battery Analysis, Insights and Forecast, 2020-2032
- 10.1. Market Analysis, Insights and Forecast - by Application
- 10.1.1.
- 10.2. Market Analysis, Insights and Forecast - by Type
- 10.2.1.
- 10.1. Market Analysis, Insights and Forecast - by Application
- 11. undefined Marine Power Battery Analysis, Insights and Forecast, 2020-2032
- 11.1. Market Analysis, Insights and Forecast - by Application
- 11.1.1.
- 11.2. Market Analysis, Insights and Forecast - by Type
- 11.2.1.
- 11.1. Market Analysis, Insights and Forecast - by Application
- 12. Competitive Analysis
- 12.1. Company Profiles
- 12.1.1 CATL
- 12.1.1.1. Company Overview
- 12.1.1.2. Products
- 12.1.1.3. Company Financials
- 12.1.1.4. SWOT Analysis
- 12.1.2 Eve Energy
- 12.1.2.1. Company Overview
- 12.1.2.2. Products
- 12.1.2.3. Company Financials
- 12.1.2.4. SWOT Analysis
- 12.1.3 Yijiatong Battery
- 12.1.3.1. Company Overview
- 12.1.3.2. Products
- 12.1.3.3. Company Financials
- 12.1.3.4. SWOT Analysis
- 12.1.4 Gotion High tech
- 12.1.4.1. Company Overview
- 12.1.4.2. Products
- 12.1.4.3. Company Financials
- 12.1.4.4. SWOT Analysis
- 12.1.5 SAFT
- 12.1.5.1. Company Overview
- 12.1.5.2. Products
- 12.1.5.3. Company Financials
- 12.1.5.4. SWOT Analysis
- 12.1.6 EST-Floattech
- 12.1.6.1. Company Overview
- 12.1.6.2. Products
- 12.1.6.3. Company Financials
- 12.1.6.4. SWOT Analysis
- 12.1.7 Akasol
- 12.1.7.1. Company Overview
- 12.1.7.2. Products
- 12.1.7.3. Company Financials
- 12.1.7.4. SWOT Analysis
- 12.1.8 Forsee Power
- 12.1.8.1. Company Overview
- 12.1.8.2. Products
- 12.1.8.3. Company Financials
- 12.1.8.4. SWOT Analysis
- 12.1.9 XALT Energy
- 12.1.9.1. Company Overview
- 12.1.9.2. Products
- 12.1.9.3. Company Financials
- 12.1.9.4. SWOT Analysis
- 12.1.10 Toshiba
- 12.1.10.1. Company Overview
- 12.1.10.2. Products
- 12.1.10.3. Company Financials
- 12.1.10.4. SWOT Analysis
- 12.1.1 CATL
- 12.2. Market Entropy
- 12.2.1 Company's Key Areas Served
- 12.2.2 Recent Developments
- 12.3. Company Market Share Analysis 2025
- 12.3.1 Top 5 Companies Market Share Analysis
- 12.3.2 Top 3 Companies Market Share Analysis
- 12.4. List of Potential Customers
- 13. Research Methodology
List of Figures
- Figure 1: Global Marine Power Battery Revenue Breakdown (billion, %) by Region 2025 & 2033
- Figure 2: Global Marine Power Battery Volume Breakdown (K, %) by Region 2025 & 2033
- Figure 3: undefined Marine Power Battery Revenue (billion), by Application 2025 & 2033
- Figure 4: undefined Marine Power Battery Volume (K), by Application 2025 & 2033
- Figure 5: undefined Marine Power Battery Revenue Share (%), by Application 2025 & 2033
- Figure 6: undefined Marine Power Battery Volume Share (%), by Application 2025 & 2033
- Figure 7: undefined Marine Power Battery Revenue (billion), by Type 2025 & 2033
- Figure 8: undefined Marine Power Battery Volume (K), by Type 2025 & 2033
- Figure 9: undefined Marine Power Battery Revenue Share (%), by Type 2025 & 2033
- Figure 10: undefined Marine Power Battery Volume Share (%), by Type 2025 & 2033
- Figure 11: undefined Marine Power Battery Revenue (billion), by Country 2025 & 2033
- Figure 12: undefined Marine Power Battery Volume (K), by Country 2025 & 2033
- Figure 13: undefined Marine Power Battery Revenue Share (%), by Country 2025 & 2033
- Figure 14: undefined Marine Power Battery Volume Share (%), by Country 2025 & 2033
- Figure 15: undefined Marine Power Battery Revenue (billion), by Application 2025 & 2033
- Figure 16: undefined Marine Power Battery Volume (K), by Application 2025 & 2033
- Figure 17: undefined Marine Power Battery Revenue Share (%), by Application 2025 & 2033
- Figure 18: undefined Marine Power Battery Volume Share (%), by Application 2025 & 2033
- Figure 19: undefined Marine Power Battery Revenue (billion), by Type 2025 & 2033
- Figure 20: undefined Marine Power Battery Volume (K), by Type 2025 & 2033
- Figure 21: undefined Marine Power Battery Revenue Share (%), by Type 2025 & 2033
- Figure 22: undefined Marine Power Battery Volume Share (%), by Type 2025 & 2033
- Figure 23: undefined Marine Power Battery Revenue (billion), by Country 2025 & 2033
- Figure 24: undefined Marine Power Battery Volume (K), by Country 2025 & 2033
- Figure 25: undefined Marine Power Battery Revenue Share (%), by Country 2025 & 2033
- Figure 26: undefined Marine Power Battery Volume Share (%), by Country 2025 & 2033
- Figure 27: undefined Marine Power Battery Revenue (billion), by Application 2025 & 2033
- Figure 28: undefined Marine Power Battery Volume (K), by Application 2025 & 2033
- Figure 29: undefined Marine Power Battery Revenue Share (%), by Application 2025 & 2033
- Figure 30: undefined Marine Power Battery Volume Share (%), by Application 2025 & 2033
- Figure 31: undefined Marine Power Battery Revenue (billion), by Type 2025 & 2033
- Figure 32: undefined Marine Power Battery Volume (K), by Type 2025 & 2033
- Figure 33: undefined Marine Power Battery Revenue Share (%), by Type 2025 & 2033
- Figure 34: undefined Marine Power Battery Volume Share (%), by Type 2025 & 2033
- Figure 35: undefined Marine Power Battery Revenue (billion), by Country 2025 & 2033
- Figure 36: undefined Marine Power Battery Volume (K), by Country 2025 & 2033
- Figure 37: undefined Marine Power Battery Revenue Share (%), by Country 2025 & 2033
- Figure 38: undefined Marine Power Battery Volume Share (%), by Country 2025 & 2033
- Figure 39: undefined Marine Power Battery Revenue (billion), by Application 2025 & 2033
- Figure 40: undefined Marine Power Battery Volume (K), by Application 2025 & 2033
- Figure 41: undefined Marine Power Battery Revenue Share (%), by Application 2025 & 2033
- Figure 42: undefined Marine Power Battery Volume Share (%), by Application 2025 & 2033
- Figure 43: undefined Marine Power Battery Revenue (billion), by Type 2025 & 2033
- Figure 44: undefined Marine Power Battery Volume (K), by Type 2025 & 2033
- Figure 45: undefined Marine Power Battery Revenue Share (%), by Type 2025 & 2033
- Figure 46: undefined Marine Power Battery Volume Share (%), by Type 2025 & 2033
- Figure 47: undefined Marine Power Battery Revenue (billion), by Country 2025 & 2033
- Figure 48: undefined Marine Power Battery Volume (K), by Country 2025 & 2033
- Figure 49: undefined Marine Power Battery Revenue Share (%), by Country 2025 & 2033
- Figure 50: undefined Marine Power Battery Volume Share (%), by Country 2025 & 2033
- Figure 51: undefined Marine Power Battery Revenue (billion), by Application 2025 & 2033
- Figure 52: undefined Marine Power Battery Volume (K), by Application 2025 & 2033
- Figure 53: undefined Marine Power Battery Revenue Share (%), by Application 2025 & 2033
- Figure 54: undefined Marine Power Battery Volume Share (%), by Application 2025 & 2033
- Figure 55: undefined Marine Power Battery Revenue (billion), by Type 2025 & 2033
- Figure 56: undefined Marine Power Battery Volume (K), by Type 2025 & 2033
- Figure 57: undefined Marine Power Battery Revenue Share (%), by Type 2025 & 2033
- Figure 58: undefined Marine Power Battery Volume Share (%), by Type 2025 & 2033
- Figure 59: undefined Marine Power Battery Revenue (billion), by Country 2025 & 2033
- Figure 60: undefined Marine Power Battery Volume (K), by Country 2025 & 2033
- Figure 61: undefined Marine Power Battery Revenue Share (%), by Country 2025 & 2033
- Figure 62: undefined Marine Power Battery Volume Share (%), by Country 2025 & 2033
List of Tables
- Table 1: Global Marine Power Battery Revenue billion Forecast, by Application 2020 & 2033
- Table 2: Global Marine Power Battery Volume K Forecast, by Application 2020 & 2033
- Table 3: Global Marine Power Battery Revenue billion Forecast, by Type 2020 & 2033
- Table 4: Global Marine Power Battery Volume K Forecast, by Type 2020 & 2033
- Table 5: Global Marine Power Battery Revenue billion Forecast, by Region 2020 & 2033
- Table 6: Global Marine Power Battery Volume K Forecast, by Region 2020 & 2033
- Table 7: Global Marine Power Battery Revenue billion Forecast, by Application 2020 & 2033
- Table 8: Global Marine Power Battery Volume K Forecast, by Application 2020 & 2033
- Table 9: Global Marine Power Battery Revenue billion Forecast, by Type 2020 & 2033
- Table 10: Global Marine Power Battery Volume K Forecast, by Type 2020 & 2033
- Table 11: Global Marine Power Battery Revenue billion Forecast, by Country 2020 & 2033
- Table 12: Global Marine Power Battery Volume K Forecast, by Country 2020 & 2033
- Table 13: Global Marine Power Battery Revenue billion Forecast, by Application 2020 & 2033
- Table 14: Global Marine Power Battery Volume K Forecast, by Application 2020 & 2033
- Table 15: Global Marine Power Battery Revenue billion Forecast, by Type 2020 & 2033
- Table 16: Global Marine Power Battery Volume K Forecast, by Type 2020 & 2033
- Table 17: Global Marine Power Battery Revenue billion Forecast, by Country 2020 & 2033
- Table 18: Global Marine Power Battery Volume K Forecast, by Country 2020 & 2033
- Table 19: Global Marine Power Battery Revenue billion Forecast, by Application 2020 & 2033
- Table 20: Global Marine Power Battery Volume K Forecast, by Application 2020 & 2033
- Table 21: Global Marine Power Battery Revenue billion Forecast, by Type 2020 & 2033
- Table 22: Global Marine Power Battery Volume K Forecast, by Type 2020 & 2033
- Table 23: Global Marine Power Battery Revenue billion Forecast, by Country 2020 & 2033
- Table 24: Global Marine Power Battery Volume K Forecast, by Country 2020 & 2033
- Table 25: Global Marine Power Battery Revenue billion Forecast, by Application 2020 & 2033
- Table 26: Global Marine Power Battery Volume K Forecast, by Application 2020 & 2033
- Table 27: Global Marine Power Battery Revenue billion Forecast, by Type 2020 & 2033
- Table 28: Global Marine Power Battery Volume K Forecast, by Type 2020 & 2033
- Table 29: Global Marine Power Battery Revenue billion Forecast, by Country 2020 & 2033
- Table 30: Global Marine Power Battery Volume K Forecast, by Country 2020 & 2033
- Table 31: Global Marine Power Battery Revenue billion Forecast, by Application 2020 & 2033
- Table 32: Global Marine Power Battery Volume K Forecast, by Application 2020 & 2033
- Table 33: Global Marine Power Battery Revenue billion Forecast, by Type 2020 & 2033
- Table 34: Global Marine Power Battery Volume K Forecast, by Type 2020 & 2033
- Table 35: Global Marine Power Battery Revenue billion Forecast, by Country 2020 & 2033
- Table 36: Global Marine Power Battery Volume K Forecast, by Country 2020 & 2033
Frequently Asked Questions
1. What is the projected Compound Annual Growth Rate (CAGR) of the Marine Power Battery?
The projected CAGR is approximately 11.09%.
2. Which companies are prominent players in the Marine Power Battery?
Key companies in the market include CATL, Eve Energy, Yijiatong Battery, Gotion High tech, SAFT, EST-Floattech, Akasol, Forsee Power, XALT Energy, Toshiba.
3. What are the main segments of the Marine Power Battery?
The market segments include Application, Type.
4. Can you provide details about the market size?
The market size is estimated to be USD 14.57 billion as of 2022.
5. What are some drivers contributing to market growth?
N/A
6. What are the notable trends driving market growth?
N/A
7. Are there any restraints impacting market growth?
N/A
8. Can you provide examples of recent developments in the market?
N/A
9. What pricing options are available for accessing the report?
Pricing options include single-user, multi-user, and enterprise licenses priced at USD 3950.00, USD 5925.00, and USD 7900.00 respectively.
10. Is the market size provided in terms of value or volume?
The market size is provided in terms of value, measured in billion and volume, measured in K.
11. Are there any specific market keywords associated with the report?
Yes, the market keyword associated with the report is "Marine Power Battery," which aids in identifying and referencing the specific market segment covered.
12. How do I determine which pricing option suits my needs best?
The pricing options vary based on user requirements and access needs. Individual users may opt for single-user licenses, while businesses requiring broader access may choose multi-user or enterprise licenses for cost-effective access to the report.
13. Are there any additional resources or data provided in the Marine Power Battery report?
While the report offers comprehensive insights, it's advisable to review the specific contents or supplementary materials provided to ascertain if additional resources or data are available.
14. How can I stay updated on further developments or reports in the Marine Power Battery?
To stay informed about further developments, trends, and reports in the Marine Power Battery, consider subscribing to industry newsletters, following relevant companies and organizations, or regularly checking reputable industry news sources and publications.
Methodology
Step 1 - Identification of Relevant Samples Size from Population Database


Step 2 - Approaches for Defining Global Market Size (Value, Volume* & Price*)

Note*: In applicable scenarios
Step 3 - Data Sources
Primary Research
- Web Analytics
- Survey Reports
- Research Institute
- Latest Research Reports
- Opinion Leaders
Secondary Research
- Annual Reports
- White Paper
- Latest Press Release
- Industry Association
- Paid Database
- Investor Presentations

Step 4 - Data Triangulation
Involves using different sources of information in order to increase the validity of a study
These sources are likely to be stakeholders in a program - participants, other researchers, program staff, other community members, and so on.
Then we put all data in single framework & apply various statistical tools to find out the dynamic on the market.
During the analysis stage, feedback from the stakeholder groups would be compared to determine areas of agreement as well as areas of divergence