

Key Insights
The global modular instruments market, estimated at 3107.84 million in the base year 2025, is poised for significant expansion, projecting a compound annual growth rate (CAGR) of 13.95% from 2025 to 2033. This robust growth is underpinned by several key market drivers. Increasing industrial automation, particularly within semiconductor and electronics manufacturing, fuels demand for the flexible and adaptable test and measurement solutions offered by modular instruments. The escalating complexity of electronic systems also necessitates advanced testing capabilities, driving the adoption of high-performance modular solutions. Furthermore, the proliferation of 5G and other advanced communication technologies requires rigorous testing and validation, contributing to market expansion. Finally, the ongoing trend towards miniaturization and enhanced functionality in electronic devices underscores the value of modular instruments for their adaptability and scalability.
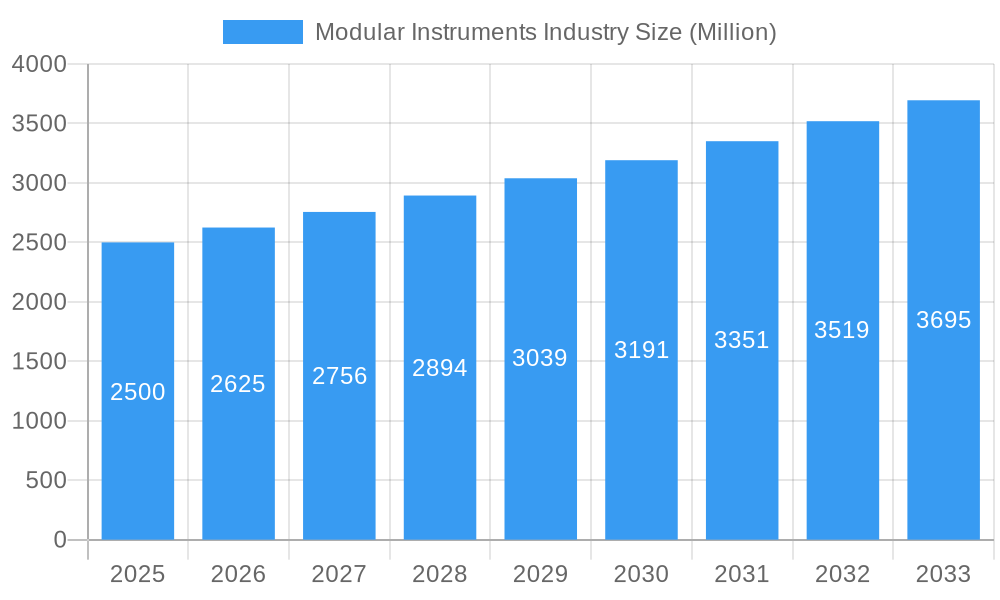
Modular Instruments Industry Market Size (In Billion)
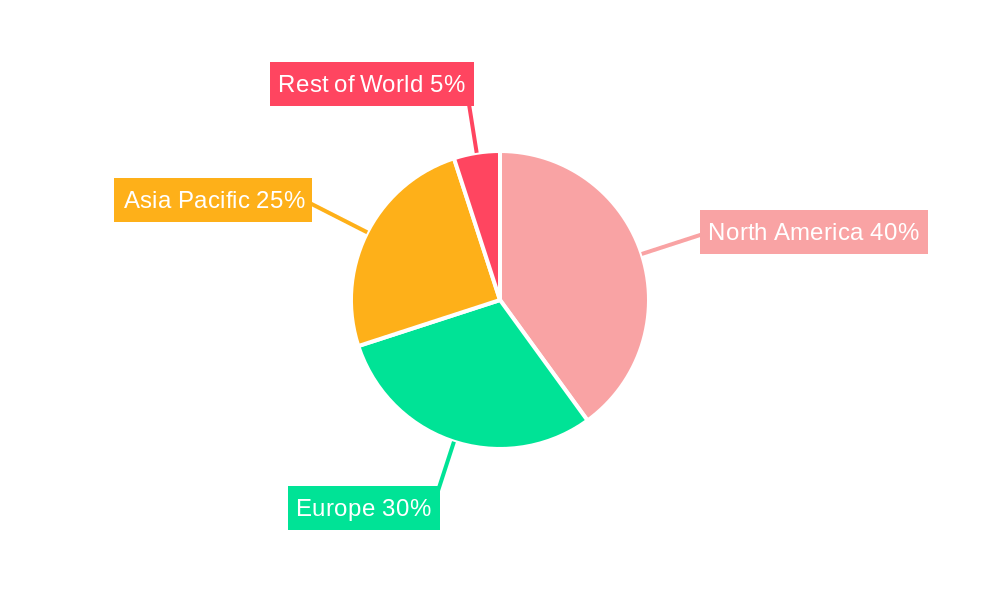
The market is segmented by platform, including PXI, VXI, and AXIe, and by application, encompassing semiconductor & electronics, telecommunications, defense & aerospace, automotive & transportation, and other sectors. The semiconductor & electronics segment currently commands a substantial market share, driven by rapid industry advancements and increasing sophistication. However, widespread adoption across diverse applications is expected to foster growth across all segments. Geographically, North America leads the market, followed by Europe and Asia Pacific. The Asia Pacific region is anticipated to experience the highest growth rate during the forecast period, fueled by escalating investments in advanced technologies and manufacturing capabilities in China and India. Leading market players, including National Instruments, Keysight Technologies, and Rohde & Schwarz, are strategically investing in research and development and pursuing acquisitions to strengthen their market positions and broaden product offerings, thereby intensifying competition. Despite its strong growth trajectory, the market faces challenges such as significant initial investment costs and the requirement for specialized expertise for system operation and maintenance.
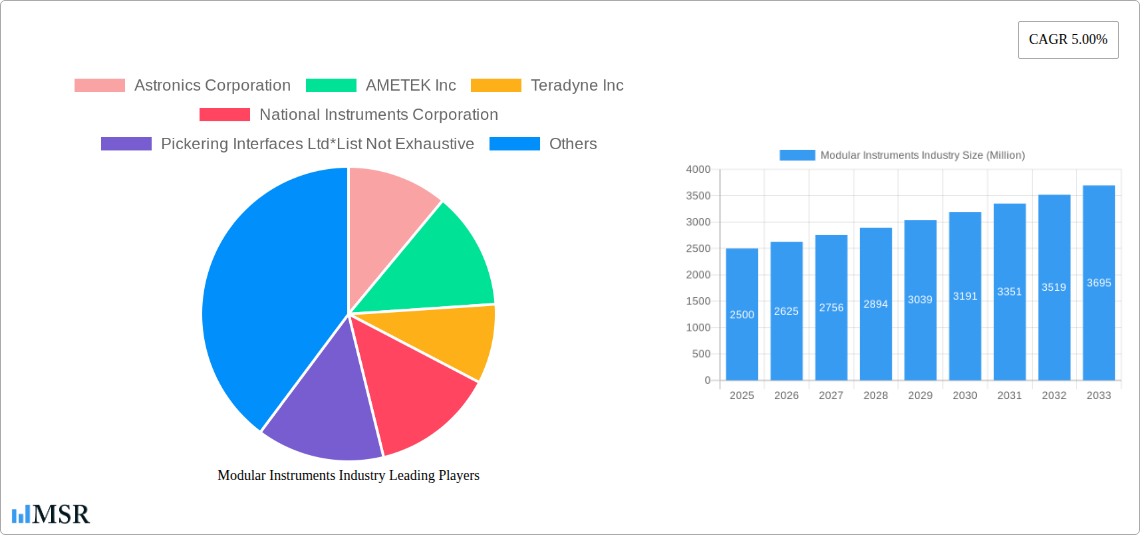
Modular Instruments Industry Company Market Share
Modular Instruments Industry Market Report: 2019-2033
This comprehensive report provides an in-depth analysis of the global Modular Instruments market, projecting a robust growth trajectory from 2025 to 2033. Valued at $xx Million in 2025, the market is poised for significant expansion, driven by technological advancements and increasing demand across diverse sectors. The report covers key market segments, leading players like Astronics Corporation, AMETEK Inc, Teradyne Inc, National Instruments Corporation, and Pickering Interfaces Ltd (among others), and presents actionable insights for stakeholders. The study period encompasses 2019-2033, with 2025 serving as the base and estimated year.
Modular Instruments Industry Market Concentration & Dynamics
The modular instruments market exhibits a moderately concentrated landscape, with a few dominant players holding significant market share. However, the presence of numerous smaller, specialized companies fosters innovation and competition. The market concentration ratio (CRx) for the top 5 players in 2025 is estimated at xx%, indicating a competitive yet consolidated structure. Innovation is driven by continuous advancements in technologies like PXI, VXI, and AXIe, alongside strong R&D investments by major players.
Regulatory frameworks, varying by region, influence market dynamics, particularly regarding safety and emissions standards. Substitute products, such as traditional, non-modular instruments, pose some competition, but the advantages of modularity—flexibility, scalability, and cost-effectiveness—are increasingly outweighing these alternatives. End-user trends favor modularity due to its adaptability to evolving testing needs.
Mergers and acquisitions (M&A) activity has been moderate in recent years, with approximately xx M&A deals recorded between 2019 and 2024. These transactions reflect strategic efforts to expand product portfolios and geographical reach.
Modular Instruments Industry Industry Insights & Trends
The global modular instruments market is experiencing robust growth, with a Compound Annual Growth Rate (CAGR) of xx% projected between 2025 and 2033. The market size is anticipated to reach $xx Million by 2033. This growth is primarily driven by the expanding adoption of modular instruments across various application areas, fueled by increasing automation in testing and measurement processes, particularly within the semiconductor and electronics industry.
Technological disruptions, such as the rise of software-defined instrumentation and the integration of artificial intelligence (AI) and machine learning (ML) capabilities, are significantly shaping the market. Furthermore, evolving consumer behaviors, characterized by a preference for flexible and scalable solutions, are further accelerating the adoption of modular instruments. The increasing demand for higher throughput, faster testing cycles, and improved accuracy in various industries is bolstering market expansion.
Key Markets & Segments Leading Modular Instruments Industry
The North American region currently holds the dominant position in the modular instruments market, largely due to robust technological advancements and a strong presence of major industry players. Within the application segments, Semiconductor and Electronics is the largest market segment, driven by the rapid growth of the semiconductor industry and stringent quality control requirements. The Defense and Aerospace sectors also demonstrate significant growth potential.
By Platform: The PXI platform dominates the market due to its versatility and scalability. VXI and AXIe platforms maintain niche applications.
By Application:
- Semiconductor and Electronics: Driven by increasing automation in testing and quality control.
- Telecommunication: Fueled by the demand for 5G infrastructure testing.
- Defense and Aerospace: Driven by the need for robust and reliable testing solutions.
- Automotive and Transportation: Driven by the increasing adoption of advanced driver-assistance systems (ADAS).
- Other Applications: Including medical, industrial, and energy sectors, showcasing steady growth.
The growth drivers in these segments include robust economic growth in key regions, significant investments in infrastructure development, and increasing government support for technological advancements in key sectors.
Modular Instruments Industry Product Developments
Recent product innovations in the modular instruments sector include the integration of advanced software features, enabling enhanced data analysis and automation. Miniaturization trends are also evident, offering greater portability and flexibility. New applications are emerging in areas like IoT testing and the verification of autonomous systems, highlighting the technological adaptability of these instruments. These advancements provide manufacturers with a strong competitive edge, allowing them to cater to evolving market demands.
Challenges in the Modular Instruments Industry Market
The modular instruments market faces challenges, including stringent regulatory compliance requirements which can increase development costs. Supply chain disruptions, particularly concerning crucial electronic components, can impact production timelines and costs. Intense competition from established players and new entrants pressures pricing and profitability margins. These factors combined can reduce market profitability by an estimated xx% in the short term.
Forces Driving Modular Instruments Industry Growth
Key growth drivers include advancements in semiconductor technology leading to increased processing power and functionality in modular instruments. Economic growth in developing nations stimulates investment in testing and measurement equipment. Favorable government policies and initiatives supporting technological innovation, particularly in key sectors like electronics and renewable energy, are also crucial factors.
Challenges in the Modular Instruments Industry Market
Long-term growth catalysts include ongoing research and development in areas such as software-defined instrumentation and the seamless integration of AI/ML. Strategic partnerships between instrument manufacturers and software developers to expand application capabilities are crucial. Expansion into emerging markets such as developing economies with increasing industrialization will drive sustained growth.
Emerging Opportunities in Modular Instruments Industry
Emerging opportunities lie in the integration of modular instruments with cloud-based platforms, enabling remote access and data analysis. The increasing adoption of Industry 4.0 and the Internet of Things (IoT) is creating demand for specialized testing and measurement solutions. New markets in areas like renewable energy testing and healthcare diagnostics are also promising growth avenues.
Leading Players in the Modular Instruments Industry Sector
Key Milestones in Modular Instruments Industry Industry
- 2020: Keysight Technologies launched a new family of PXI instruments.
- 2021: National Instruments released advanced software for data analysis.
- 2022: A significant merger occurred between two smaller players in the AXIe segment.
- 2023: Several manufacturers introduced AI-integrated modular instruments.
- 2024: New industry standards were established for interoperability.
Strategic Outlook for Modular Instruments Industry Market
The modular instruments market is set for sustained growth, fueled by ongoing technological advancements and the expanding applications across diverse industries. Strategic opportunities for players include focusing on innovation, forging partnerships for technology integration, and expanding into new and emerging markets. A focus on developing customized solutions tailored to specific end-user needs will enhance market penetration and profitability in the long term.
Modular Instruments Industry Segmentation
-
1. Platform
- 1.1. PXI
- 1.2. VXI
- 1.3. AXIe
-
2. Application
- 2.1. Semiconductor and Electronics
- 2.2. Telecommunication
- 2.3. Defense and Aerospace
- 2.4. Automotive and Transportation
- 2.5. Other Applications
Modular Instruments Industry Segmentation By Geography
- 1. North America
- 2. Europe
- 3. Asia Pacific
- 4. Latin America
- 5. Middle East and Africa
Modular Instruments Industry Regional Market Share
Geographic Coverage of Modular Instruments Industry
Modular Instruments Industry REPORT HIGHLIGHTS
| Aspects | Details |
|---|---|
| Study Period | 2020-2034 |
| Base Year | 2025 |
| Estimated Year | 2026 |
| Forecast Period | 2026-2034 |
| Historical Period | 2020-2025 |
| Growth Rate | CAGR of 13.95% from 2020-2034 |
| Segmentation |
|
Table of Contents
- 1. Introduction
- 1.1. Research Scope
- 1.2. Market Segmentation
- 1.3. Research Objective
- 1.4. Definitions and Assumptions
- 2. Executive Summary
- 2.1. Market Snapshot
- 3. Market Dynamics
- 3.1. Market Drivers
- 3.2. Market Restrains
- 3.3. Market Trends
- 3.4. Market Opportunities
- 4. Market Factor Analysis
- 4.1. Porters Five Forces
- 4.1.1. Bargaining Power of Suppliers
- 4.1.2. Bargaining Power of Buyers
- 4.1.3. Threat of New Entrants
- 4.1.4. Threat of Substitutes
- 4.1.5. Competitive Rivalry
- 4.2. PESTEL analysis
- 4.3. BCG Analysis
- 4.3.1. Stars (High Growth, High Market Share)
- 4.3.2. Cash Cows (Low Growth, High Market Share)
- 4.3.3. Question Mark (High Growth, Low Market Share)
- 4.3.4. Dogs (Low Growth, Low Market Share)
- 4.4. Ansoff Matrix Analysis
- 4.5. Supply Chain Analysis
- 4.6. Regulatory Landscape
- 4.7. Current Market Potential and Opportunity Assessment (TAM–SAM–SOM Framework)
- 4.8. MSR Analyst Note
- 4.1. Porters Five Forces
- 5. Market Analysis, Insights and Forecast 2021-2033
- 5.1. Market Analysis, Insights and Forecast - by Platform
- 5.1.1. PXI
- 5.1.2. VXI
- 5.1.3. AXIe
- 5.2. Market Analysis, Insights and Forecast - by Application
- 5.2.1. Semiconductor and Electronics
- 5.2.2. Telecommunication
- 5.2.3. Defense and Aerospace
- 5.2.4. Automotive and Transportation
- 5.2.5. Other Applications
- 5.3. Market Analysis, Insights and Forecast - by Region
- 5.3.1. North America
- 5.3.2. Europe
- 5.3.3. Asia Pacific
- 5.3.4. Latin America
- 5.3.5. Middle East and Africa
- 5.1. Market Analysis, Insights and Forecast - by Platform
- 6. Global Modular Instruments Industry Analysis, Insights and Forecast, 2021-2033
- 6.1. Market Analysis, Insights and Forecast - by Platform
- 6.1.1. PXI
- 6.1.2. VXI
- 6.1.3. AXIe
- 6.2. Market Analysis, Insights and Forecast - by Application
- 6.2.1. Semiconductor and Electronics
- 6.2.2. Telecommunication
- 6.2.3. Defense and Aerospace
- 6.2.4. Automotive and Transportation
- 6.2.5. Other Applications
- 6.1. Market Analysis, Insights and Forecast - by Platform
- 7. North America Modular Instruments Industry Analysis, Insights and Forecast, 2020-2032
- 7.1. Market Analysis, Insights and Forecast - by Platform
- 7.1.1. PXI
- 7.1.2. VXI
- 7.1.3. AXIe
- 7.2. Market Analysis, Insights and Forecast - by Application
- 7.2.1. Semiconductor and Electronics
- 7.2.2. Telecommunication
- 7.2.3. Defense and Aerospace
- 7.2.4. Automotive and Transportation
- 7.2.5. Other Applications
- 7.1. Market Analysis, Insights and Forecast - by Platform
- 8. Europe Modular Instruments Industry Analysis, Insights and Forecast, 2020-2032
- 8.1. Market Analysis, Insights and Forecast - by Platform
- 8.1.1. PXI
- 8.1.2. VXI
- 8.1.3. AXIe
- 8.2. Market Analysis, Insights and Forecast - by Application
- 8.2.1. Semiconductor and Electronics
- 8.2.2. Telecommunication
- 8.2.3. Defense and Aerospace
- 8.2.4. Automotive and Transportation
- 8.2.5. Other Applications
- 8.1. Market Analysis, Insights and Forecast - by Platform
- 9. Asia Pacific Modular Instruments Industry Analysis, Insights and Forecast, 2020-2032
- 9.1. Market Analysis, Insights and Forecast - by Platform
- 9.1.1. PXI
- 9.1.2. VXI
- 9.1.3. AXIe
- 9.2. Market Analysis, Insights and Forecast - by Application
- 9.2.1. Semiconductor and Electronics
- 9.2.2. Telecommunication
- 9.2.3. Defense and Aerospace
- 9.2.4. Automotive and Transportation
- 9.2.5. Other Applications
- 9.1. Market Analysis, Insights and Forecast - by Platform
- 10. Latin America Modular Instruments Industry Analysis, Insights and Forecast, 2020-2032
- 10.1. Market Analysis, Insights and Forecast - by Platform
- 10.1.1. PXI
- 10.1.2. VXI
- 10.1.3. AXIe
- 10.2. Market Analysis, Insights and Forecast - by Application
- 10.2.1. Semiconductor and Electronics
- 10.2.2. Telecommunication
- 10.2.3. Defense and Aerospace
- 10.2.4. Automotive and Transportation
- 10.2.5. Other Applications
- 10.1. Market Analysis, Insights and Forecast - by Platform
- 11. Middle East and Africa Modular Instruments Industry Analysis, Insights and Forecast, 2020-2032
- 11.1. Market Analysis, Insights and Forecast - by Platform
- 11.1.1. PXI
- 11.1.2. VXI
- 11.1.3. AXIe
- 11.2. Market Analysis, Insights and Forecast - by Application
- 11.2.1. Semiconductor and Electronics
- 11.2.2. Telecommunication
- 11.2.3. Defense and Aerospace
- 11.2.4. Automotive and Transportation
- 11.2.5. Other Applications
- 11.1. Market Analysis, Insights and Forecast - by Platform
- 12. Competitive Analysis
- 12.1. Company Profiles
- 12.1.1 Astronics Corporation
- 12.1.1.1. Company Overview
- 12.1.1.2. Products
- 12.1.1.3. Company Financials
- 12.1.1.4. SWOT Analysis
- 12.1.2 AMETEK Inc
- 12.1.2.1. Company Overview
- 12.1.2.2. Products
- 12.1.2.3. Company Financials
- 12.1.2.4. SWOT Analysis
- 12.1.3 Teradyne Inc
- 12.1.3.1. Company Overview
- 12.1.3.2. Products
- 12.1.3.3. Company Financials
- 12.1.3.4. SWOT Analysis
- 12.1.4 National Instruments Corporation
- 12.1.4.1. Company Overview
- 12.1.4.2. Products
- 12.1.4.3. Company Financials
- 12.1.4.4. SWOT Analysis
- 12.1.5 Pickering Interfaces Ltd*List Not Exhaustive
- 12.1.5.1. Company Overview
- 12.1.5.2. Products
- 12.1.5.3. Company Financials
- 12.1.5.4. SWOT Analysis
- 12.1.6 Viavi Solutions Inc
- 12.1.6.1. Company Overview
- 12.1.6.2. Products
- 12.1.6.3. Company Financials
- 12.1.6.4. SWOT Analysis
- 12.1.7 Fortive Corporation
- 12.1.7.1. Company Overview
- 12.1.7.2. Products
- 12.1.7.3. Company Financials
- 12.1.7.4. SWOT Analysis
- 12.1.8 Teledyne LeCroy Inc
- 12.1.8.1. Company Overview
- 12.1.8.2. Products
- 12.1.8.3. Company Financials
- 12.1.8.4. SWOT Analysis
- 12.1.9 Keysight Technologies Inc
- 12.1.9.1. Company Overview
- 12.1.9.2. Products
- 12.1.9.3. Company Financials
- 12.1.9.4. SWOT Analysis
- 12.1.10 Rohde & Schwarz GmbH & Company KG
- 12.1.10.1. Company Overview
- 12.1.10.2. Products
- 12.1.10.3. Company Financials
- 12.1.10.4. SWOT Analysis
- 12.1.1 Astronics Corporation
- 12.2. Market Entropy
- 12.2.1 Company's Key Areas Served
- 12.2.2 Recent Developments
- 12.3. Company Market Share Analysis 2025
- 12.3.1 Top 5 Companies Market Share Analysis
- 12.3.2 Top 3 Companies Market Share Analysis
- 12.4. List of Potential Customers
- 13. Research Methodology
List of Figures
- Figure 1: Global Modular Instruments Industry Revenue Breakdown (million, %) by Region 2025 & 2033
- Figure 2: North America Modular Instruments Industry Revenue (million), by Platform 2025 & 2033
- Figure 3: North America Modular Instruments Industry Revenue Share (%), by Platform 2025 & 2033
- Figure 4: North America Modular Instruments Industry Revenue (million), by Application 2025 & 2033
- Figure 5: North America Modular Instruments Industry Revenue Share (%), by Application 2025 & 2033
- Figure 6: North America Modular Instruments Industry Revenue (million), by Country 2025 & 2033
- Figure 7: North America Modular Instruments Industry Revenue Share (%), by Country 2025 & 2033
- Figure 8: Europe Modular Instruments Industry Revenue (million), by Platform 2025 & 2033
- Figure 9: Europe Modular Instruments Industry Revenue Share (%), by Platform 2025 & 2033
- Figure 10: Europe Modular Instruments Industry Revenue (million), by Application 2025 & 2033
- Figure 11: Europe Modular Instruments Industry Revenue Share (%), by Application 2025 & 2033
- Figure 12: Europe Modular Instruments Industry Revenue (million), by Country 2025 & 2033
- Figure 13: Europe Modular Instruments Industry Revenue Share (%), by Country 2025 & 2033
- Figure 14: Asia Pacific Modular Instruments Industry Revenue (million), by Platform 2025 & 2033
- Figure 15: Asia Pacific Modular Instruments Industry Revenue Share (%), by Platform 2025 & 2033
- Figure 16: Asia Pacific Modular Instruments Industry Revenue (million), by Application 2025 & 2033
- Figure 17: Asia Pacific Modular Instruments Industry Revenue Share (%), by Application 2025 & 2033
- Figure 18: Asia Pacific Modular Instruments Industry Revenue (million), by Country 2025 & 2033
- Figure 19: Asia Pacific Modular Instruments Industry Revenue Share (%), by Country 2025 & 2033
- Figure 20: Latin America Modular Instruments Industry Revenue (million), by Platform 2025 & 2033
- Figure 21: Latin America Modular Instruments Industry Revenue Share (%), by Platform 2025 & 2033
- Figure 22: Latin America Modular Instruments Industry Revenue (million), by Application 2025 & 2033
- Figure 23: Latin America Modular Instruments Industry Revenue Share (%), by Application 2025 & 2033
- Figure 24: Latin America Modular Instruments Industry Revenue (million), by Country 2025 & 2033
- Figure 25: Latin America Modular Instruments Industry Revenue Share (%), by Country 2025 & 2033
- Figure 26: Middle East and Africa Modular Instruments Industry Revenue (million), by Platform 2025 & 2033
- Figure 27: Middle East and Africa Modular Instruments Industry Revenue Share (%), by Platform 2025 & 2033
- Figure 28: Middle East and Africa Modular Instruments Industry Revenue (million), by Application 2025 & 2033
- Figure 29: Middle East and Africa Modular Instruments Industry Revenue Share (%), by Application 2025 & 2033
- Figure 30: Middle East and Africa Modular Instruments Industry Revenue (million), by Country 2025 & 2033
- Figure 31: Middle East and Africa Modular Instruments Industry Revenue Share (%), by Country 2025 & 2033
List of Tables
- Table 1: Global Modular Instruments Industry Revenue million Forecast, by Platform 2020 & 2033
- Table 2: Global Modular Instruments Industry Revenue million Forecast, by Application 2020 & 2033
- Table 3: Global Modular Instruments Industry Revenue million Forecast, by Region 2020 & 2033
- Table 4: Global Modular Instruments Industry Revenue million Forecast, by Platform 2020 & 2033
- Table 5: Global Modular Instruments Industry Revenue million Forecast, by Application 2020 & 2033
- Table 6: Global Modular Instruments Industry Revenue million Forecast, by Country 2020 & 2033
- Table 7: Global Modular Instruments Industry Revenue million Forecast, by Platform 2020 & 2033
- Table 8: Global Modular Instruments Industry Revenue million Forecast, by Application 2020 & 2033
- Table 9: Global Modular Instruments Industry Revenue million Forecast, by Country 2020 & 2033
- Table 10: Global Modular Instruments Industry Revenue million Forecast, by Platform 2020 & 2033
- Table 11: Global Modular Instruments Industry Revenue million Forecast, by Application 2020 & 2033
- Table 12: Global Modular Instruments Industry Revenue million Forecast, by Country 2020 & 2033
- Table 13: Global Modular Instruments Industry Revenue million Forecast, by Platform 2020 & 2033
- Table 14: Global Modular Instruments Industry Revenue million Forecast, by Application 2020 & 2033
- Table 15: Global Modular Instruments Industry Revenue million Forecast, by Country 2020 & 2033
- Table 16: Global Modular Instruments Industry Revenue million Forecast, by Platform 2020 & 2033
- Table 17: Global Modular Instruments Industry Revenue million Forecast, by Application 2020 & 2033
- Table 18: Global Modular Instruments Industry Revenue million Forecast, by Country 2020 & 2033
Frequently Asked Questions
1. What is the projected Compound Annual Growth Rate (CAGR) of the Modular Instruments Industry?
The projected CAGR is approximately 13.95%.
2. Which companies are prominent players in the Modular Instruments Industry?
Key companies in the market include Astronics Corporation, AMETEK Inc, Teradyne Inc, National Instruments Corporation, Pickering Interfaces Ltd*List Not Exhaustive, Viavi Solutions Inc, Fortive Corporation, Teledyne LeCroy Inc, Keysight Technologies Inc, Rohde & Schwarz GmbH & Company KG.
3. What are the main segments of the Modular Instruments Industry?
The market segments include Platform, Application.
4. Can you provide details about the market size?
The market size is estimated to be USD 3107.84 million as of 2022.
5. What are some drivers contributing to market growth?
; Rapid Increase in the Usage of IoT-based Devices in Various Industries; Increased Investment in the Aerospace and Defense Sector.
6. What are the notable trends driving market growth?
Semiconductor and Electronics Segment are Expected to Hold the Largest Market Share in the Forecast Period.
7. Are there any restraints impacting market growth?
; Rapid Advancement in Technology can Outcast Demand.
8. Can you provide examples of recent developments in the market?
N/A
9. What pricing options are available for accessing the report?
Pricing options include single-user, multi-user, and enterprise licenses priced at USD 4750, USD 5250, and USD 8750 respectively.
10. Is the market size provided in terms of value or volume?
The market size is provided in terms of value, measured in million.
11. Are there any specific market keywords associated with the report?
Yes, the market keyword associated with the report is "Modular Instruments Industry," which aids in identifying and referencing the specific market segment covered.
12. How do I determine which pricing option suits my needs best?
The pricing options vary based on user requirements and access needs. Individual users may opt for single-user licenses, while businesses requiring broader access may choose multi-user or enterprise licenses for cost-effective access to the report.
13. Are there any additional resources or data provided in the Modular Instruments Industry report?
While the report offers comprehensive insights, it's advisable to review the specific contents or supplementary materials provided to ascertain if additional resources or data are available.
14. How can I stay updated on further developments or reports in the Modular Instruments Industry?
To stay informed about further developments, trends, and reports in the Modular Instruments Industry, consider subscribing to industry newsletters, following relevant companies and organizations, or regularly checking reputable industry news sources and publications.
Methodology
Step 1 - Identification of Relevant Samples Size from Population Database


Step 2 - Approaches for Defining Global Market Size (Value, Volume* & Price*)

Note*: In applicable scenarios
Step 3 - Data Sources
Primary Research
- Web Analytics
- Survey Reports
- Research Institute
- Latest Research Reports
- Opinion Leaders
Secondary Research
- Annual Reports
- White Paper
- Latest Press Release
- Industry Association
- Paid Database
- Investor Presentations

Step 4 - Data Triangulation
Involves using different sources of information in order to increase the validity of a study
These sources are likely to be stakeholders in a program - participants, other researchers, program staff, other community members, and so on.
Then we put all data in single framework & apply various statistical tools to find out the dynamic on the market.
During the analysis stage, feedback from the stakeholder groups would be compared to determine areas of agreement as well as areas of divergence