

Key Insights
The Physical Vapor Deposition (PVD) equipment market is poised for significant expansion, driven by escalating demand across multiple industries. With a projected compound annual growth rate (CAGR) of 8.98% from a base year of 2025, the market, currently valued at 27.65 billion, is expected to experience substantial growth. Key growth catalysts include the burgeoning microelectronics sector's need for advanced thin-film deposition for complex semiconductor devices, and the medical device industry's reliance on PVD for biocompatible coatings. The renewable energy sector, particularly solar power, also fuels demand for efficient solar cell coatings. While high equipment costs and specialized expertise present challenges, ongoing technological advancements and miniaturization trends are expected to mitigate these factors. The market is segmented by end-user industries, with microelectronics, medical devices, and solar products being prominent. North America and Asia-Pacific are leading growth regions due to robust technological investments and manufacturing capabilities, while Europe contributes significantly with its established industrial base and R&D activities.
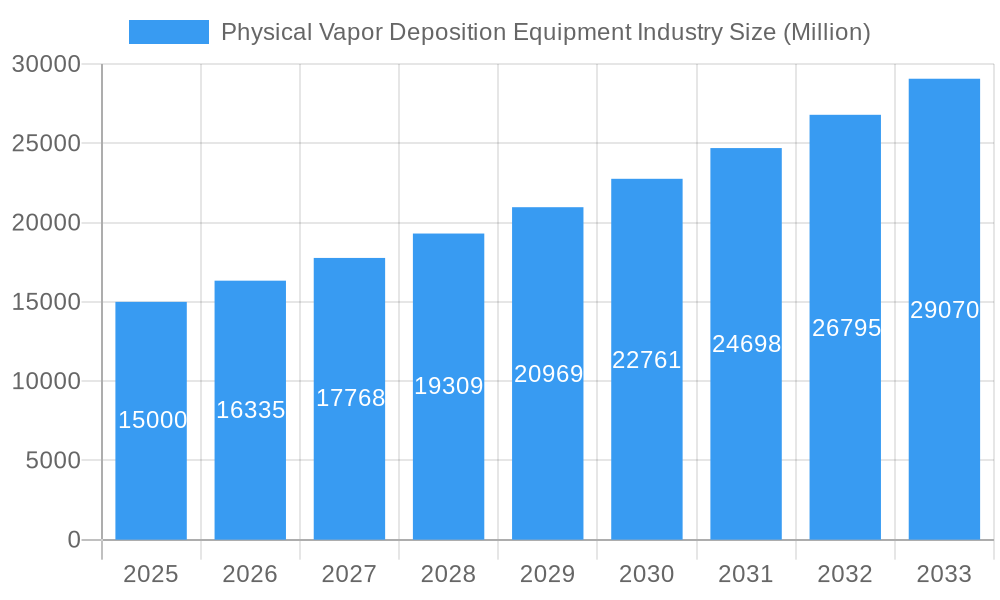
Physical Vapor Deposition Equipment Industry Market Size (In Billion)
The competitive landscape features established and emerging players focused on PVD technology innovation, strategic partnerships, and acquisitions. Continued market consolidation is anticipated as companies address the demand for customized solutions and advanced PVD systems. The development of novel materials and coating processes offers promising future growth avenues, leading to more sophisticated and efficient PVD equipment. Sustained growth is expected, driven by technological progress and expanding applications. Future success hinges on research and development focused on enhancing deposition rates, improving film quality, and reducing costs for PVD equipment.
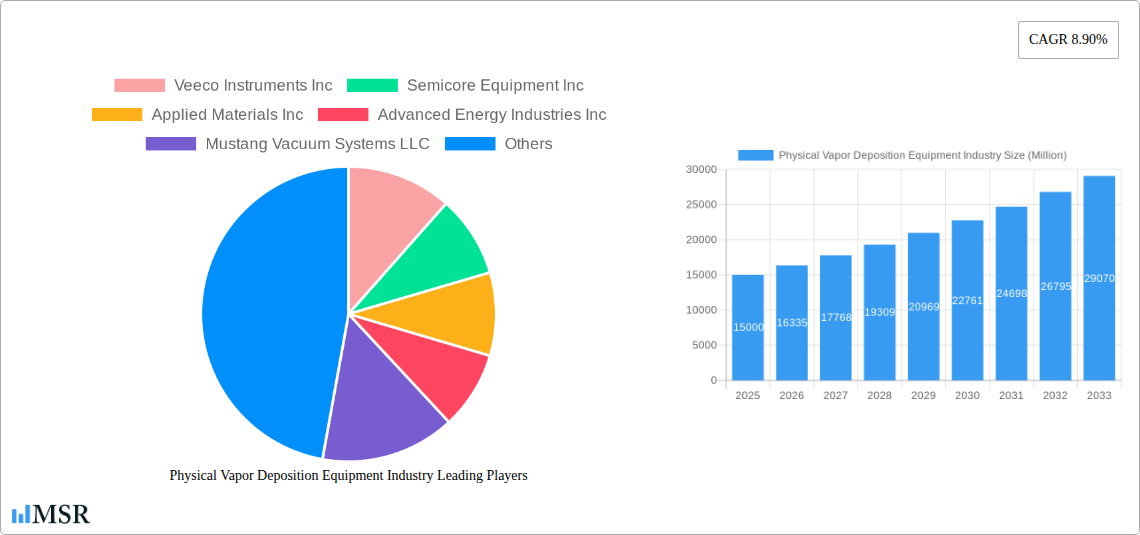
Physical Vapor Deposition Equipment Industry Company Market Share
Physical Vapor Deposition (PVD) Equipment Market Report: 2019-2033
This comprehensive report provides an in-depth analysis of the Physical Vapor Deposition (PVD) Equipment market, offering invaluable insights for industry stakeholders, investors, and strategic decision-makers. The study covers the period from 2019 to 2033, with a base year of 2025 and a forecast period from 2025 to 2033. The report leverages rigorous research methodologies and incorporates data from the historical period (2019-2024) to present a robust and future-oriented perspective on the PVD equipment landscape. The global market size is projected to reach xx Million by 2033, exhibiting a CAGR of xx% during the forecast period.
Physical Vapor Deposition Equipment Industry Market Concentration & Dynamics
The PVD equipment market exhibits a moderately concentrated structure, with key players like Applied Materials Inc, Veeco Instruments Inc, and Oerlikon Balzers Coating AG holding significant market share. However, the presence of numerous smaller, specialized players fosters a dynamic competitive landscape. Market share distribution is estimated at xx% for the top 3 players in 2025, reflecting ongoing competition and innovation.
- Innovation Ecosystems: Continuous advancements in thin-film deposition techniques, driven by R&D investments from major players and research institutions, are a key market driver.
- Regulatory Frameworks: Environmental regulations concerning hazardous material usage and disposal significantly influence equipment design and manufacturing processes. Compliance costs impact overall market pricing and competitiveness.
- Substitute Products: While PVD holds a dominant position, alternative deposition methods like chemical vapor deposition (CVD) present some competition, particularly in specific niche applications.
- End-User Trends: The growing demand for advanced materials in microelectronics, medical devices, and solar energy sectors fuels the expansion of the PVD equipment market. Increased adoption of miniaturization and high-performance materials further drives demand.
- M&A Activities: The past five years witnessed xx M&A deals in the PVD equipment industry, reflecting strategic consolidation and expansion efforts by larger players. These activities contributed to market consolidation and technological integration.
Physical Vapor Deposition Equipment Industry Insights & Trends
The PVD equipment market is witnessing robust growth, propelled by several key factors. The global market size was valued at xx Million in 2025 and is projected to reach xx Million by 2033, driven by a compound annual growth rate (CAGR) of xx%.
Technological disruptions, such as the development of advanced sputtering systems and atomic layer deposition (ALD) techniques, significantly enhance film quality and deposition efficiency, impacting diverse applications. Consumer behaviors, particularly within the electronics and renewable energy sectors, are driving the demand for high-performance, energy-efficient components and thus PVD equipment. The increasing demand for smaller, faster, and more energy-efficient electronics is a major growth driver. Furthermore, the rising adoption of renewable energy technologies, including solar panels, also contributes substantially to market expansion. The increasing demand for advanced coatings in various industries further fuels market growth.
Key Markets & Segments Leading Physical Vapor Deposition Equipment Industry
The microelectronics segment currently dominates the PVD equipment market, accounting for xx% of the total market share in 2025. This dominance is attributed to the high demand for advanced semiconductor devices and integrated circuits.
- Microelectronics:
- Drivers: Rapid advancements in semiconductor technology, increasing demand for miniaturized electronics, and the rise of 5G and IoT technologies.
- Medical Devices and Equipment: Growing demand for advanced medical implants and diagnostic tools that require precise coatings and surface modifications.
- Solar Products: The increasing adoption of solar energy across the globe is boosting demand for PVD equipment in the manufacturing of high-efficiency solar cells.
- Other End Users: This segment encompasses various applications like optical coatings, decorative coatings, and tooling, exhibiting moderate but steady growth.
Regional Dominance: The Asia-Pacific region exhibits significant growth potential due to the rapid expansion of the electronics and renewable energy sectors. North America remains a substantial market, driven by robust R&D activities and technological advancements.
Physical Vapor Deposition Equipment Industry Product Developments
Recent years have witnessed significant advancements in PVD equipment, including the introduction of high-throughput systems, improved process control, and the development of novel deposition techniques like pulsed laser deposition (PLD) and high-power impulse magnetron sputtering (HIPIMS). These innovations enhance film quality, deposition rate, and overall process efficiency, providing a competitive edge for equipment manufacturers. New materials and applications, such as advanced coatings for extreme environments, expand the market's reach and application diversity.
Challenges in the Physical Vapor Deposition Equipment Industry Market
The PVD equipment industry faces several challenges, including stringent environmental regulations, leading to increased compliance costs. Fluctuations in raw material prices impact profitability, and intense competition from established and emerging players creates pricing pressures. Supply chain disruptions caused by geopolitical events can also negatively affect manufacturing and delivery timelines. The estimated impact of these challenges on overall market growth in 2025 is approximately xx Million.
Forces Driving Physical Vapor Deposition Equipment Industry Growth
Technological advancements, particularly in thin-film deposition techniques, are a primary growth driver. The rising demand for high-performance materials across various industries, including microelectronics and renewable energy, fuels market expansion. Favorable government policies promoting renewable energy adoption create opportunities for growth in solar energy applications. Furthermore, investments in R&D for developing more efficient and versatile PVD systems contribute to sustained market growth.
Long-Term Growth Catalysts in the Physical Vapor Deposition Equipment Industry
Long-term growth in the PVD equipment market will be driven by continuous innovation in deposition technologies, including the development of advanced materials and processes. Strategic partnerships and collaborations between equipment manufacturers and end-users will foster technological advancement and market expansion. The exploration of new markets, such as flexible electronics and advanced manufacturing processes, offers significant growth potential. Government incentives supporting clean energy technologies will also boost the demand for PVD equipment in solar cell manufacturing.
Emerging Opportunities in Physical Vapor Deposition Equipment Industry
Emerging opportunities include the development of PVD systems for the production of flexible electronics, which is a rapidly growing market segment. The increasing demand for advanced coatings in the aerospace and automotive industries also offers substantial growth potential. The exploration of new materials and applications for PVD technology will unlock new market segments, expanding the overall market scope.
Leading Players in the Physical Vapor Deposition Equipment Industry Sector
- Veeco Instruments Inc
- Semicore Equipment Inc
- Applied Materials Inc
- Advanced Energy Industries Inc
- Mustang Vacuum Systems LLC
- IHI Corporation
- ULVAC Inc
- Platit AG
- Angstrom Engineering Inc
- AJA International Inc
- Oerlikon Balzers Coating AG
Key Milestones in Physical Vapor Deposition Equipment Industry Industry
- 2020: Applied Materials launches a new high-throughput PVD system.
- 2021: Veeco Instruments announces a strategic partnership for developing advanced ALD technology.
- 2022: Oerlikon Balzers acquires a smaller PVD equipment manufacturer, expanding its market reach.
- 2023: Several key players announce significant investments in R&D for next-generation PVD systems.
- 2024: New industry regulations impacting material usage are implemented.
Strategic Outlook for Physical Vapor Deposition Equipment Market
The PVD equipment market holds significant long-term growth potential, driven by ongoing technological advancements and increasing demand for high-performance materials across diverse industries. Strategic partnerships and collaborations will play a crucial role in driving innovation and market expansion. Companies that focus on developing energy-efficient, high-throughput systems, and adapting to evolving environmental regulations will be well-positioned to capture market share. The focus should be on sustainability and developing advanced materials processing capabilities to maintain a competitive edge.
Physical Vapor Deposition Equipment Industry Segmentation
-
1. End User
- 1.1. Microelectronics
- 1.2. Medical Devices and Equipment
- 1.3. Solar Products
- 1.4. Other End Users
Physical Vapor Deposition Equipment Industry Segmentation By Geography
- 1. North America
- 2. Europe
- 3. Asia Pacific
- 4. Rest of the World
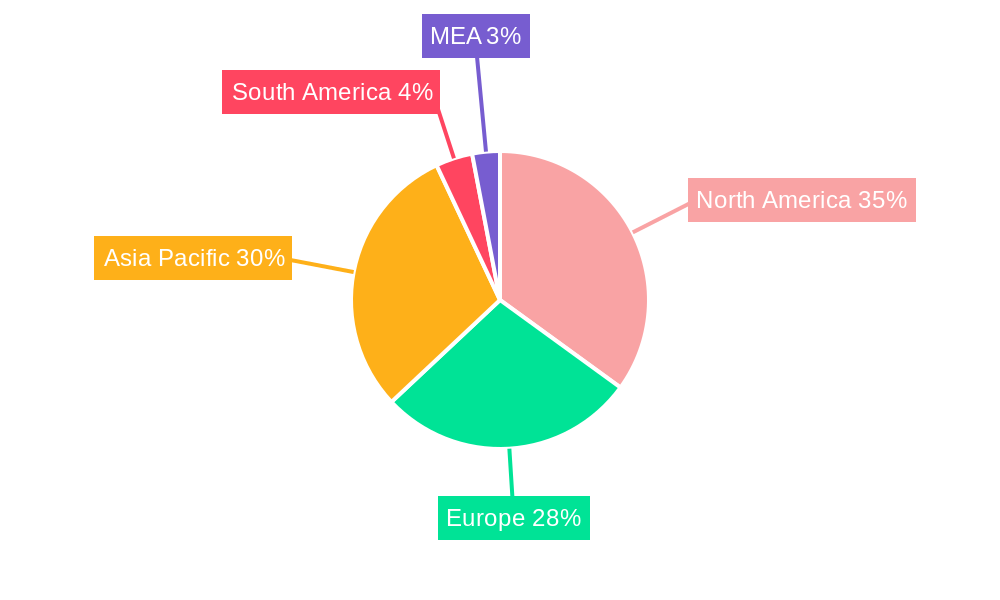
Physical Vapor Deposition Equipment Industry Regional Market Share
Geographic Coverage of Physical Vapor Deposition Equipment Industry
Physical Vapor Deposition Equipment Industry REPORT HIGHLIGHTS
| Aspects | Details |
|---|---|
| Study Period | 2020-2034 |
| Base Year | 2025 |
| Estimated Year | 2026 |
| Forecast Period | 2026-2034 |
| Historical Period | 2020-2025 |
| Growth Rate | CAGR of 8.98% from 2020-2034 |
| Segmentation |
|
Table of Contents
- 1. Introduction
- 1.1. Research Scope
- 1.2. Market Segmentation
- 1.3. Research Objective
- 1.4. Definitions and Assumptions
- 2. Executive Summary
- 2.1. Market Snapshot
- 3. Market Dynamics
- 3.1. Market Drivers
- 3.2. Market Restrains
- 3.3. Market Trends
- 3.4. Market Opportunities
- 4. Market Factor Analysis
- 4.1. Porters Five Forces
- 4.1.1. Bargaining Power of Suppliers
- 4.1.2. Bargaining Power of Buyers
- 4.1.3. Threat of New Entrants
- 4.1.4. Threat of Substitutes
- 4.1.5. Competitive Rivalry
- 4.2. PESTEL analysis
- 4.3. BCG Analysis
- 4.3.1. Stars (High Growth, High Market Share)
- 4.3.2. Cash Cows (Low Growth, High Market Share)
- 4.3.3. Question Mark (High Growth, Low Market Share)
- 4.3.4. Dogs (Low Growth, Low Market Share)
- 4.4. Ansoff Matrix Analysis
- 4.5. Supply Chain Analysis
- 4.6. Regulatory Landscape
- 4.7. Current Market Potential and Opportunity Assessment (TAM–SAM–SOM Framework)
- 4.8. MSR Analyst Note
- 4.1. Porters Five Forces
- 5. Market Analysis, Insights and Forecast 2021-2033
- 5.1. Market Analysis, Insights and Forecast - by End User
- 5.1.1. Microelectronics
- 5.1.2. Medical Devices and Equipment
- 5.1.3. Solar Products
- 5.1.4. Other End Users
- 5.2. Market Analysis, Insights and Forecast - by Region
- 5.2.1. North America
- 5.2.2. Europe
- 5.2.3. Asia Pacific
- 5.2.4. Rest of the World
- 5.1. Market Analysis, Insights and Forecast - by End User
- 6. Global Physical Vapor Deposition Equipment Industry Analysis, Insights and Forecast, 2021-2033
- 6.1. Market Analysis, Insights and Forecast - by End User
- 6.1.1. Microelectronics
- 6.1.2. Medical Devices and Equipment
- 6.1.3. Solar Products
- 6.1.4. Other End Users
- 6.1. Market Analysis, Insights and Forecast - by End User
- 7. North America Physical Vapor Deposition Equipment Industry Analysis, Insights and Forecast, 2020-2032
- 7.1. Market Analysis, Insights and Forecast - by End User
- 7.1.1. Microelectronics
- 7.1.2. Medical Devices and Equipment
- 7.1.3. Solar Products
- 7.1.4. Other End Users
- 7.1. Market Analysis, Insights and Forecast - by End User
- 8. Europe Physical Vapor Deposition Equipment Industry Analysis, Insights and Forecast, 2020-2032
- 8.1. Market Analysis, Insights and Forecast - by End User
- 8.1.1. Microelectronics
- 8.1.2. Medical Devices and Equipment
- 8.1.3. Solar Products
- 8.1.4. Other End Users
- 8.1. Market Analysis, Insights and Forecast - by End User
- 9. Asia Pacific Physical Vapor Deposition Equipment Industry Analysis, Insights and Forecast, 2020-2032
- 9.1. Market Analysis, Insights and Forecast - by End User
- 9.1.1. Microelectronics
- 9.1.2. Medical Devices and Equipment
- 9.1.3. Solar Products
- 9.1.4. Other End Users
- 9.1. Market Analysis, Insights and Forecast - by End User
- 10. Rest of the World Physical Vapor Deposition Equipment Industry Analysis, Insights and Forecast, 2020-2032
- 10.1. Market Analysis, Insights and Forecast - by End User
- 10.1.1. Microelectronics
- 10.1.2. Medical Devices and Equipment
- 10.1.3. Solar Products
- 10.1.4. Other End Users
- 10.1. Market Analysis, Insights and Forecast - by End User
- 11. Competitive Analysis
- 11.1. Company Profiles
- 11.1.1 Veeco Instruments Inc
- 11.1.1.1. Company Overview
- 11.1.1.2. Products
- 11.1.1.3. Company Financials
- 11.1.1.4. SWOT Analysis
- 11.1.2 Semicore Equipment Inc
- 11.1.2.1. Company Overview
- 11.1.2.2. Products
- 11.1.2.3. Company Financials
- 11.1.2.4. SWOT Analysis
- 11.1.3 Applied Materials Inc
- 11.1.3.1. Company Overview
- 11.1.3.2. Products
- 11.1.3.3. Company Financials
- 11.1.3.4. SWOT Analysis
- 11.1.4 Advanced Energy Industries Inc
- 11.1.4.1. Company Overview
- 11.1.4.2. Products
- 11.1.4.3. Company Financials
- 11.1.4.4. SWOT Analysis
- 11.1.5 Mustang Vacuum Systems LLC
- 11.1.5.1. Company Overview
- 11.1.5.2. Products
- 11.1.5.3. Company Financials
- 11.1.5.4. SWOT Analysis
- 11.1.6 IHI Corporatio
- 11.1.6.1. Company Overview
- 11.1.6.2. Products
- 11.1.6.3. Company Financials
- 11.1.6.4. SWOT Analysis
- 11.1.7 ULVAC Inc
- 11.1.7.1. Company Overview
- 11.1.7.2. Products
- 11.1.7.3. Company Financials
- 11.1.7.4. SWOT Analysis
- 11.1.8 Platit AG
- 11.1.8.1. Company Overview
- 11.1.8.2. Products
- 11.1.8.3. Company Financials
- 11.1.8.4. SWOT Analysis
- 11.1.9 Angstrom Engineering Inc
- 11.1.9.1. Company Overview
- 11.1.9.2. Products
- 11.1.9.3. Company Financials
- 11.1.9.4. SWOT Analysis
- 11.1.10 AJA International Inc
- 11.1.10.1. Company Overview
- 11.1.10.2. Products
- 11.1.10.3. Company Financials
- 11.1.10.4. SWOT Analysis
- 11.1.11 Oerlikon Balzers Coating AG
- 11.1.11.1. Company Overview
- 11.1.11.2. Products
- 11.1.11.3. Company Financials
- 11.1.11.4. SWOT Analysis
- 11.1.1 Veeco Instruments Inc
- 11.2. Market Entropy
- 11.2.1 Company's Key Areas Served
- 11.2.2 Recent Developments
- 11.3. Company Market Share Analysis 2025
- 11.3.1 Top 5 Companies Market Share Analysis
- 11.3.2 Top 3 Companies Market Share Analysis
- 11.4. List of Potential Customers
- 12. Research Methodology
List of Figures
- Figure 1: Global Physical Vapor Deposition Equipment Industry Revenue Breakdown (billion, %) by Region 2025 & 2033
- Figure 2: Global Physical Vapor Deposition Equipment Industry Volume Breakdown (K Unit, %) by Region 2025 & 2033
- Figure 3: North America Physical Vapor Deposition Equipment Industry Revenue (billion), by End User 2025 & 2033
- Figure 4: North America Physical Vapor Deposition Equipment Industry Volume (K Unit), by End User 2025 & 2033
- Figure 5: North America Physical Vapor Deposition Equipment Industry Revenue Share (%), by End User 2025 & 2033
- Figure 6: North America Physical Vapor Deposition Equipment Industry Volume Share (%), by End User 2025 & 2033
- Figure 7: North America Physical Vapor Deposition Equipment Industry Revenue (billion), by Country 2025 & 2033
- Figure 8: North America Physical Vapor Deposition Equipment Industry Volume (K Unit), by Country 2025 & 2033
- Figure 9: North America Physical Vapor Deposition Equipment Industry Revenue Share (%), by Country 2025 & 2033
- Figure 10: North America Physical Vapor Deposition Equipment Industry Volume Share (%), by Country 2025 & 2033
- Figure 11: Europe Physical Vapor Deposition Equipment Industry Revenue (billion), by End User 2025 & 2033
- Figure 12: Europe Physical Vapor Deposition Equipment Industry Volume (K Unit), by End User 2025 & 2033
- Figure 13: Europe Physical Vapor Deposition Equipment Industry Revenue Share (%), by End User 2025 & 2033
- Figure 14: Europe Physical Vapor Deposition Equipment Industry Volume Share (%), by End User 2025 & 2033
- Figure 15: Europe Physical Vapor Deposition Equipment Industry Revenue (billion), by Country 2025 & 2033
- Figure 16: Europe Physical Vapor Deposition Equipment Industry Volume (K Unit), by Country 2025 & 2033
- Figure 17: Europe Physical Vapor Deposition Equipment Industry Revenue Share (%), by Country 2025 & 2033
- Figure 18: Europe Physical Vapor Deposition Equipment Industry Volume Share (%), by Country 2025 & 2033
- Figure 19: Asia Pacific Physical Vapor Deposition Equipment Industry Revenue (billion), by End User 2025 & 2033
- Figure 20: Asia Pacific Physical Vapor Deposition Equipment Industry Volume (K Unit), by End User 2025 & 2033
- Figure 21: Asia Pacific Physical Vapor Deposition Equipment Industry Revenue Share (%), by End User 2025 & 2033
- Figure 22: Asia Pacific Physical Vapor Deposition Equipment Industry Volume Share (%), by End User 2025 & 2033
- Figure 23: Asia Pacific Physical Vapor Deposition Equipment Industry Revenue (billion), by Country 2025 & 2033
- Figure 24: Asia Pacific Physical Vapor Deposition Equipment Industry Volume (K Unit), by Country 2025 & 2033
- Figure 25: Asia Pacific Physical Vapor Deposition Equipment Industry Revenue Share (%), by Country 2025 & 2033
- Figure 26: Asia Pacific Physical Vapor Deposition Equipment Industry Volume Share (%), by Country 2025 & 2033
- Figure 27: Rest of the World Physical Vapor Deposition Equipment Industry Revenue (billion), by End User 2025 & 2033
- Figure 28: Rest of the World Physical Vapor Deposition Equipment Industry Volume (K Unit), by End User 2025 & 2033
- Figure 29: Rest of the World Physical Vapor Deposition Equipment Industry Revenue Share (%), by End User 2025 & 2033
- Figure 30: Rest of the World Physical Vapor Deposition Equipment Industry Volume Share (%), by End User 2025 & 2033
- Figure 31: Rest of the World Physical Vapor Deposition Equipment Industry Revenue (billion), by Country 2025 & 2033
- Figure 32: Rest of the World Physical Vapor Deposition Equipment Industry Volume (K Unit), by Country 2025 & 2033
- Figure 33: Rest of the World Physical Vapor Deposition Equipment Industry Revenue Share (%), by Country 2025 & 2033
- Figure 34: Rest of the World Physical Vapor Deposition Equipment Industry Volume Share (%), by Country 2025 & 2033
List of Tables
- Table 1: Global Physical Vapor Deposition Equipment Industry Revenue billion Forecast, by End User 2020 & 2033
- Table 2: Global Physical Vapor Deposition Equipment Industry Volume K Unit Forecast, by End User 2020 & 2033
- Table 3: Global Physical Vapor Deposition Equipment Industry Revenue billion Forecast, by Region 2020 & 2033
- Table 4: Global Physical Vapor Deposition Equipment Industry Volume K Unit Forecast, by Region 2020 & 2033
- Table 5: Global Physical Vapor Deposition Equipment Industry Revenue billion Forecast, by End User 2020 & 2033
- Table 6: Global Physical Vapor Deposition Equipment Industry Volume K Unit Forecast, by End User 2020 & 2033
- Table 7: Global Physical Vapor Deposition Equipment Industry Revenue billion Forecast, by Country 2020 & 2033
- Table 8: Global Physical Vapor Deposition Equipment Industry Volume K Unit Forecast, by Country 2020 & 2033
- Table 9: Global Physical Vapor Deposition Equipment Industry Revenue billion Forecast, by End User 2020 & 2033
- Table 10: Global Physical Vapor Deposition Equipment Industry Volume K Unit Forecast, by End User 2020 & 2033
- Table 11: Global Physical Vapor Deposition Equipment Industry Revenue billion Forecast, by Country 2020 & 2033
- Table 12: Global Physical Vapor Deposition Equipment Industry Volume K Unit Forecast, by Country 2020 & 2033
- Table 13: Global Physical Vapor Deposition Equipment Industry Revenue billion Forecast, by End User 2020 & 2033
- Table 14: Global Physical Vapor Deposition Equipment Industry Volume K Unit Forecast, by End User 2020 & 2033
- Table 15: Global Physical Vapor Deposition Equipment Industry Revenue billion Forecast, by Country 2020 & 2033
- Table 16: Global Physical Vapor Deposition Equipment Industry Volume K Unit Forecast, by Country 2020 & 2033
- Table 17: Global Physical Vapor Deposition Equipment Industry Revenue billion Forecast, by End User 2020 & 2033
- Table 18: Global Physical Vapor Deposition Equipment Industry Volume K Unit Forecast, by End User 2020 & 2033
- Table 19: Global Physical Vapor Deposition Equipment Industry Revenue billion Forecast, by Country 2020 & 2033
- Table 20: Global Physical Vapor Deposition Equipment Industry Volume K Unit Forecast, by Country 2020 & 2033
Frequently Asked Questions
1. What is the projected Compound Annual Growth Rate (CAGR) of the Physical Vapor Deposition Equipment Industry?
The projected CAGR is approximately 8.98%.
2. Which companies are prominent players in the Physical Vapor Deposition Equipment Industry?
Key companies in the market include Veeco Instruments Inc, Semicore Equipment Inc, Applied Materials Inc, Advanced Energy Industries Inc, Mustang Vacuum Systems LLC, IHI Corporatio, ULVAC Inc, Platit AG, Angstrom Engineering Inc, AJA International Inc, Oerlikon Balzers Coating AG.
3. What are the main segments of the Physical Vapor Deposition Equipment Industry?
The market segments include End User.
4. Can you provide details about the market size?
The market size is estimated to be USD 27.65 billion as of 2022.
5. What are some drivers contributing to market growth?
; Rise in the Demand for Medical Devices and Equipment; Growing Demand for Microelectronics in Several Applications.
6. What are the notable trends driving market growth?
Medical Devices and Equipment is Expected to Boost the Market Growth.
7. Are there any restraints impacting market growth?
; High Capital Investment.
8. Can you provide examples of recent developments in the market?
N/A
9. What pricing options are available for accessing the report?
Pricing options include single-user, multi-user, and enterprise licenses priced at USD 4750, USD 5250, and USD 8750 respectively.
10. Is the market size provided in terms of value or volume?
The market size is provided in terms of value, measured in billion and volume, measured in K Unit.
11. Are there any specific market keywords associated with the report?
Yes, the market keyword associated with the report is "Physical Vapor Deposition Equipment Industry," which aids in identifying and referencing the specific market segment covered.
12. How do I determine which pricing option suits my needs best?
The pricing options vary based on user requirements and access needs. Individual users may opt for single-user licenses, while businesses requiring broader access may choose multi-user or enterprise licenses for cost-effective access to the report.
13. Are there any additional resources or data provided in the Physical Vapor Deposition Equipment Industry report?
While the report offers comprehensive insights, it's advisable to review the specific contents or supplementary materials provided to ascertain if additional resources or data are available.
14. How can I stay updated on further developments or reports in the Physical Vapor Deposition Equipment Industry?
To stay informed about further developments, trends, and reports in the Physical Vapor Deposition Equipment Industry, consider subscribing to industry newsletters, following relevant companies and organizations, or regularly checking reputable industry news sources and publications.
Methodology
Step 1 - Identification of Relevant Samples Size from Population Database


Step 2 - Approaches for Defining Global Market Size (Value, Volume* & Price*)

Note*: In applicable scenarios
Step 3 - Data Sources
Primary Research
- Web Analytics
- Survey Reports
- Research Institute
- Latest Research Reports
- Opinion Leaders
Secondary Research
- Annual Reports
- White Paper
- Latest Press Release
- Industry Association
- Paid Database
- Investor Presentations

Step 4 - Data Triangulation
Involves using different sources of information in order to increase the validity of a study
These sources are likely to be stakeholders in a program - participants, other researchers, program staff, other community members, and so on.
Then we put all data in single framework & apply various statistical tools to find out the dynamic on the market.
During the analysis stage, feedback from the stakeholder groups would be compared to determine areas of agreement as well as areas of divergence