

Key Insights
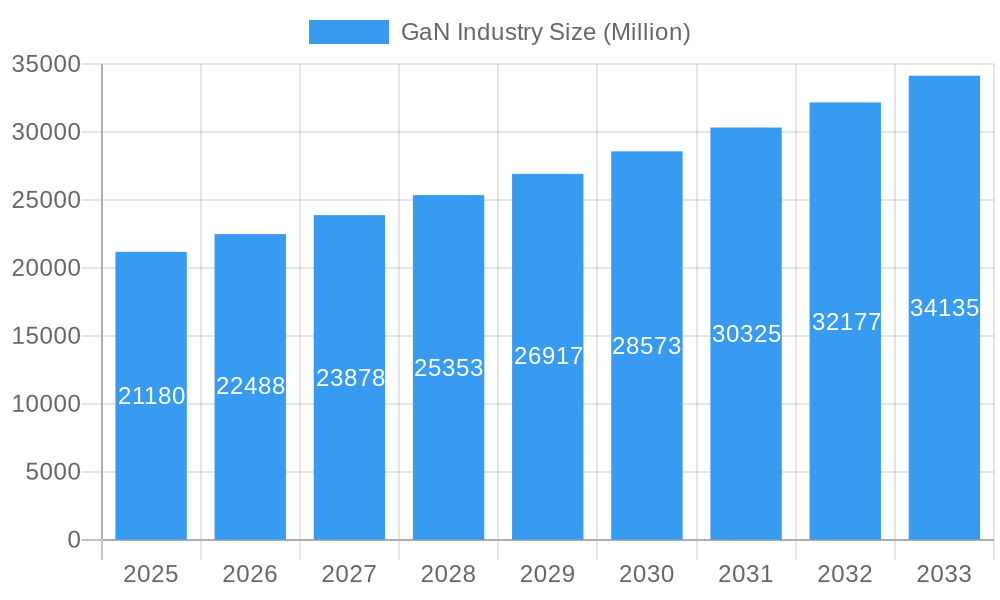
The GaN semiconductor market, valued at $21.18 billion in 2025, is experiencing robust growth, projected to expand at a compound annual growth rate (CAGR) of 6.06% from 2025 to 2033. This expansion is driven by several key factors. The increasing demand for energy-efficient power solutions across diverse sectors, particularly in automotive and consumer electronics, fuels the adoption of GaN technology due to its superior power density and efficiency compared to traditional silicon-based semiconductors. Further driving market growth are advancements in GaN device fabrication techniques leading to cost reductions and improved performance characteristics. The integration of GaN into fast-charging solutions for smartphones and electric vehicles (EVs) is significantly boosting market demand. Furthermore, the growing adoption of GaN in 5G infrastructure and data centers, where high-frequency operation and efficiency are critical, is a significant contributor to this market's upward trajectory.
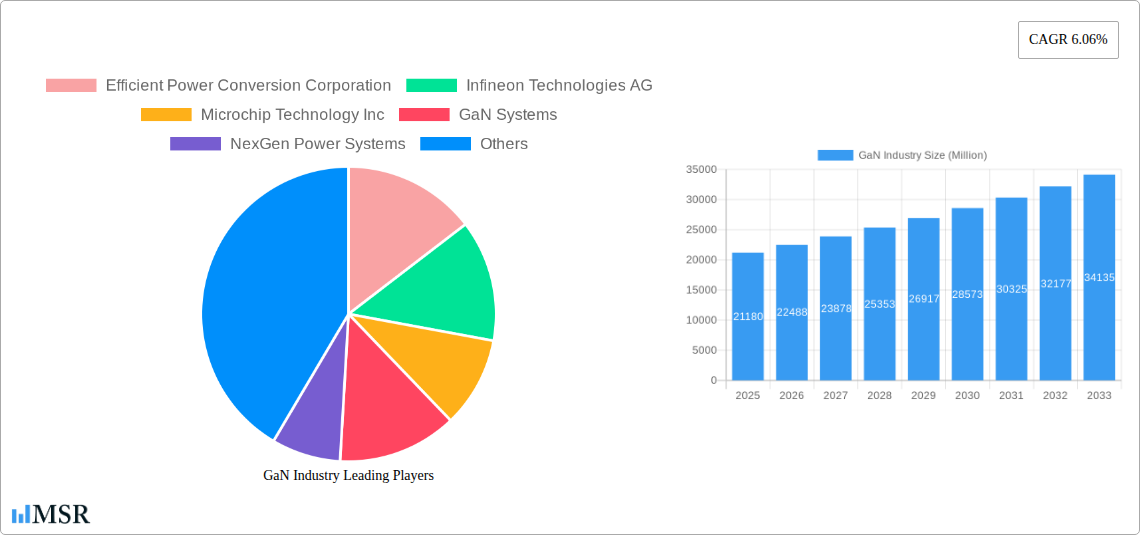
GaN Industry Market Size (In Billion)
Significant growth is anticipated in the power semiconductor segment within the GaN market, as this area benefits most directly from the technology's efficiency advantages. The transistor and power IC device categories are also poised for strong growth, reflecting their prevalent use in power conversion applications. Geographically, North America and Asia-Pacific are expected to remain dominant markets, fueled by strong technological innovation and high adoption rates in these regions. However, Europe and other regions are expected to witness considerable growth due to increasing investments in renewable energy infrastructure and the growing demand for energy-efficient electronics. While some restraints exist, such as the relatively higher cost compared to silicon and supply chain challenges, the overwhelming advantages of GaN in terms of efficiency, power density, and performance are likely to overshadow these limitations, ensuring sustained market growth throughout the forecast period.
GaN Industry Company Market Share
GaN Industry Market Report: 2019-2033 Forecast
This comprehensive report provides an in-depth analysis of the GaN (Gallium Nitride) industry, offering valuable insights for stakeholders across the value chain. Covering the period 2019-2033, with a focus on 2025, this report analyzes market dynamics, key segments, leading players, and emerging trends shaping the future of GaN technology. The global GaN market is projected to reach xx Million by 2033, exhibiting a significant CAGR.
GaN Industry Market Concentration & Dynamics
The GaN industry is characterized by a moderately concentrated market, with several key players holding significant market share. However, the landscape is dynamic, with ongoing innovation and mergers and acquisitions (M&A) activities reshaping the competitive environment. Market share data for 2024 suggests that Infineon Technologies AG, Wolfspeed Inc., and Microchip Technology Inc. hold the largest portions of the market, but precise figures are proprietary.
- Market Concentration: Moderately concentrated, with a few dominant players.
- Innovation Ecosystems: Strong collaboration between research institutions, startups, and established companies drives innovation.
- Regulatory Frameworks: Government support for semiconductor industries influences market growth, but specific regulatory impacts need further investigation.
- Substitute Products: Competition from silicon-based technologies continues, though GaN's efficiency advantages provide a competitive edge.
- End-User Trends: Increasing demand for energy-efficient electronics in various sectors drives market expansion. Consumer electronics and automotive remain key end-user industries.
- M&A Activities: A moderate number of M&A deals have been observed in recent years (xx deals in the last 5 years), signaling consolidation and strategic expansion within the sector.
GaN Industry Industry Insights & Trends
The GaN industry is experiencing robust growth driven by several key factors. The increasing adoption of GaN technology in power electronics applications, particularly in the automotive, consumer electronics, and renewable energy sectors is a major driver. Technological advancements in GaN devices, leading to improved efficiency, power density, and thermal performance, also contribute significantly to market expansion. The rising demand for energy-efficient solutions and stringent environmental regulations are further bolstering market growth. The market size in 2024 is estimated to be xx Million, and is expected to reach xx Million by 2033. The projected CAGR for the forecast period (2025-2033) is xx%.
Key Markets & Segments Leading GaN Industry
The GaN industry is witnessing substantial growth across various segments and regions. While specific regional dominance requires further in-depth analysis, the report will highlight particular trends and provide a comparative analysis.
Dominant Segments:
- By Type: Power semiconductors currently hold the largest market share due to their widespread adoption in power electronics applications. However, RF semiconductors show significant growth potential in 5G and communication infrastructure.
- By Device: Transistors are the leading device type due to their versatility and suitability for a wide range of applications. Power ICs are experiencing rapid growth, driven by increasing demand for integrated solutions.
- By End-user Industry: The automotive industry is a key driver, with growing adoption in electric vehicles and hybrid electric vehicles. Consumer electronics also shows robust growth, primarily driven by the demand for fast chargers and power adapters.
Growth Drivers:
- Economic Growth: Increased consumer spending and infrastructure development positively impact demand.
- Technological Advancements: Continuous improvement in GaN device performance drives adoption.
- Government Policies: Government initiatives promoting energy efficiency and renewable energy are encouraging the use of GaN technology.
GaN Industry Product Developments
Recent years have witnessed significant advancements in GaN technology, leading to the development of more efficient and powerful devices. Companies are continuously innovating to enhance performance, reduce costs, and expand applications, creating a highly competitive landscape. Specific examples include improvements in switching speeds and thermal management. These enhancements are driving adoption across diverse sectors, from consumer electronics to aerospace applications.
Challenges in the GaN Industry Market
The GaN industry faces several challenges, including:
- High Manufacturing Costs: Currently, GaN device production is more expensive compared to silicon-based alternatives, limiting widespread adoption in price-sensitive applications.
- Supply Chain Constraints: Securing a reliable supply of high-quality GaN materials and related components can pose challenges.
- Competition from other technologies: Silicon carbide (SiC) and other wide-bandgap semiconductors compete with GaN.
Forces Driving GaN Industry Growth
Key drivers for GaN industry growth include:
- Increased Demand for Energy Efficiency: Stringent environmental regulations and rising energy costs are driving demand for energy-efficient power solutions.
- Technological Advancements: Continuous research and development are leading to improvements in GaN device performance, reliability, and cost-effectiveness.
- Government Support: Governments worldwide are promoting the adoption of GaN technology through various incentives and research funding.
Long-Term Growth Catalysts in the GaN Industry
Long-term growth in the GaN industry is expected to be fueled by continued innovation, strategic partnerships, and expanding applications. The development of new GaN materials and device architectures will further improve performance and reduce costs. Collaboration between companies and research institutions will accelerate technological progress. Expansion into new markets, such as renewable energy and aerospace, will unlock significant growth opportunities.
Emerging Opportunities in GaN Industry
Emerging trends and opportunities include:
- Expansion into new applications: GaN technology is finding increasing adoption in areas such as 5G infrastructure, data centers, and electric vehicle charging.
- Development of new device architectures: Innovations in device design are enabling higher power density, improved efficiency, and enhanced reliability.
- Integration with other technologies: Combining GaN with other advanced semiconductor technologies is creating synergistic opportunities.
Leading Players in the GaN Industry Sector
- Efficient Power Conversion Corporation
- Infineon Technologies AG
- Microchip Technology Inc
- GaN Systems
- NexGen Power Systems
- NXP Semiconductors
- Wolfspeed Inc
- Toshiba Electronic Devices & Storage Corporation
- Soitec
- Qorvo Inc
- Texas Instruments Incorporated
- NTT Advanced Technology Corporation
Key Milestones in GaN Industry Industry
- July 2023: STMicroelectronics launched large-scale manufacturing of e-mode PowerGaN HEMT devices, significantly impacting high-efficiency power conversion system development.
- January 2024: Silvaco Group partnered with GaN Valley to advance GaN power device design using its Victory TCAD platform, enhancing simulation capabilities for GaN-based semiconductors.
Strategic Outlook for GaN Industry Market
The GaN industry is poised for significant growth, driven by increasing demand for energy-efficient and high-performance electronics. Strategic opportunities exist for companies to invest in research and development, expand manufacturing capacity, and develop innovative applications. Strategic partnerships and collaborations will be crucial in accelerating technological advancements and expanding market reach. The long-term outlook is very positive, with potential for substantial market expansion across various sectors.
GaN Industry Segmentation
-
1. Type
- 1.1. Power Semiconductors
- 1.2. Opto-Semiconductors
- 1.3. RF Semiconductors
-
2. Devices
- 2.1. Transistors
- 2.2. Diodes
- 2.3. Rectifiers
- 2.4. Power ICs
-
3. End-user Industry
- 3.1. Automotive
- 3.2. Consumer Electronics
- 3.3. Aerospace and Defense
- 3.4. Medical
- 3.5. Information Communication and Technology
- 3.6. Other End-user Industries
GaN Industry Segmentation By Geography
- 1. United States
- 2. Europe
- 3. Japan
- 4. China
- 5. Korea
- 6. Taiwan
- 7. Latin America
- 8. Middle East and Africa
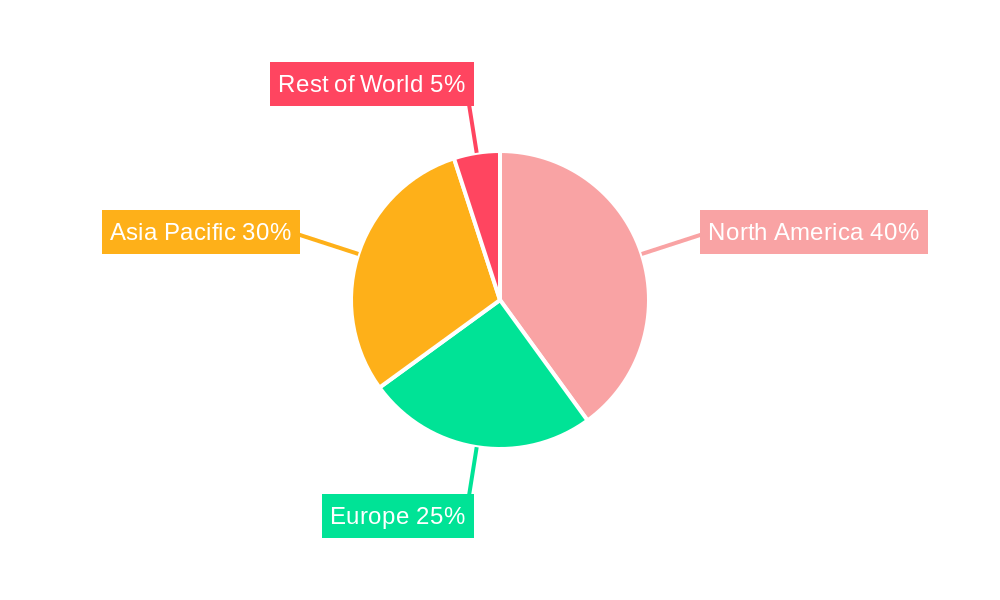
GaN Industry Regional Market Share
Geographic Coverage of GaN Industry
GaN Industry REPORT HIGHLIGHTS
| Aspects | Details |
|---|---|
| Study Period | 2020-2034 |
| Base Year | 2025 |
| Estimated Year | 2026 |
| Forecast Period | 2026-2034 |
| Historical Period | 2020-2025 |
| Growth Rate | CAGR of 6.06% from 2020-2034 |
| Segmentation |
|
Table of Contents
- 1. Introduction
- 1.1. Research Scope
- 1.2. Market Segmentation
- 1.3. Research Methodology
- 1.4. Definitions and Assumptions
- 2. Executive Summary
- 2.1. Introduction
- 3. Market Dynamics
- 3.1. Introduction
- 3.2. Market Drivers
- 3.2.1. Strong Demand from Telecom Infrastructure Segment Driven by Advancements in 5G Implementation; Favorable Attributes Such As High-performance and Small Form Factor to Drive Adoption in the Military Segment
- 3.3. Market Restrains
- 3.3.1. ; Declining Volume of Traditional Mails; High Adoption Costs
- 3.4. Market Trends
- 3.4.1. Consumer Electronics to Hold Significant Market Share
- 4. Market Factor Analysis
- 4.1. Porters Five Forces
- 4.2. Supply/Value Chain
- 4.3. PESTEL analysis
- 4.4. Market Entropy
- 4.5. Patent/Trademark Analysis
- 5. Global GaN Industry Analysis, Insights and Forecast, 2020-2032
- 5.1. Market Analysis, Insights and Forecast - by Type
- 5.1.1. Power Semiconductors
- 5.1.2. Opto-Semiconductors
- 5.1.3. RF Semiconductors
- 5.2. Market Analysis, Insights and Forecast - by Devices
- 5.2.1. Transistors
- 5.2.2. Diodes
- 5.2.3. Rectifiers
- 5.2.4. Power ICs
- 5.3. Market Analysis, Insights and Forecast - by End-user Industry
- 5.3.1. Automotive
- 5.3.2. Consumer Electronics
- 5.3.3. Aerospace and Defense
- 5.3.4. Medical
- 5.3.5. Information Communication and Technology
- 5.3.6. Other End-user Industries
- 5.4. Market Analysis, Insights and Forecast - by Region
- 5.4.1. United States
- 5.4.2. Europe
- 5.4.3. Japan
- 5.4.4. China
- 5.4.5. Korea
- 5.4.6. Taiwan
- 5.4.7. Latin America
- 5.4.8. Middle East and Africa
- 5.1. Market Analysis, Insights and Forecast - by Type
- 6. United States GaN Industry Analysis, Insights and Forecast, 2020-2032
- 6.1. Market Analysis, Insights and Forecast - by Type
- 6.1.1. Power Semiconductors
- 6.1.2. Opto-Semiconductors
- 6.1.3. RF Semiconductors
- 6.2. Market Analysis, Insights and Forecast - by Devices
- 6.2.1. Transistors
- 6.2.2. Diodes
- 6.2.3. Rectifiers
- 6.2.4. Power ICs
- 6.3. Market Analysis, Insights and Forecast - by End-user Industry
- 6.3.1. Automotive
- 6.3.2. Consumer Electronics
- 6.3.3. Aerospace and Defense
- 6.3.4. Medical
- 6.3.5. Information Communication and Technology
- 6.3.6. Other End-user Industries
- 6.1. Market Analysis, Insights and Forecast - by Type
- 7. Europe GaN Industry Analysis, Insights and Forecast, 2020-2032
- 7.1. Market Analysis, Insights and Forecast - by Type
- 7.1.1. Power Semiconductors
- 7.1.2. Opto-Semiconductors
- 7.1.3. RF Semiconductors
- 7.2. Market Analysis, Insights and Forecast - by Devices
- 7.2.1. Transistors
- 7.2.2. Diodes
- 7.2.3. Rectifiers
- 7.2.4. Power ICs
- 7.3. Market Analysis, Insights and Forecast - by End-user Industry
- 7.3.1. Automotive
- 7.3.2. Consumer Electronics
- 7.3.3. Aerospace and Defense
- 7.3.4. Medical
- 7.3.5. Information Communication and Technology
- 7.3.6. Other End-user Industries
- 7.1. Market Analysis, Insights and Forecast - by Type
- 8. Japan GaN Industry Analysis, Insights and Forecast, 2020-2032
- 8.1. Market Analysis, Insights and Forecast - by Type
- 8.1.1. Power Semiconductors
- 8.1.2. Opto-Semiconductors
- 8.1.3. RF Semiconductors
- 8.2. Market Analysis, Insights and Forecast - by Devices
- 8.2.1. Transistors
- 8.2.2. Diodes
- 8.2.3. Rectifiers
- 8.2.4. Power ICs
- 8.3. Market Analysis, Insights and Forecast - by End-user Industry
- 8.3.1. Automotive
- 8.3.2. Consumer Electronics
- 8.3.3. Aerospace and Defense
- 8.3.4. Medical
- 8.3.5. Information Communication and Technology
- 8.3.6. Other End-user Industries
- 8.1. Market Analysis, Insights and Forecast - by Type
- 9. China GaN Industry Analysis, Insights and Forecast, 2020-2032
- 9.1. Market Analysis, Insights and Forecast - by Type
- 9.1.1. Power Semiconductors
- 9.1.2. Opto-Semiconductors
- 9.1.3. RF Semiconductors
- 9.2. Market Analysis, Insights and Forecast - by Devices
- 9.2.1. Transistors
- 9.2.2. Diodes
- 9.2.3. Rectifiers
- 9.2.4. Power ICs
- 9.3. Market Analysis, Insights and Forecast - by End-user Industry
- 9.3.1. Automotive
- 9.3.2. Consumer Electronics
- 9.3.3. Aerospace and Defense
- 9.3.4. Medical
- 9.3.5. Information Communication and Technology
- 9.3.6. Other End-user Industries
- 9.1. Market Analysis, Insights and Forecast - by Type
- 10. Korea GaN Industry Analysis, Insights and Forecast, 2020-2032
- 10.1. Market Analysis, Insights and Forecast - by Type
- 10.1.1. Power Semiconductors
- 10.1.2. Opto-Semiconductors
- 10.1.3. RF Semiconductors
- 10.2. Market Analysis, Insights and Forecast - by Devices
- 10.2.1. Transistors
- 10.2.2. Diodes
- 10.2.3. Rectifiers
- 10.2.4. Power ICs
- 10.3. Market Analysis, Insights and Forecast - by End-user Industry
- 10.3.1. Automotive
- 10.3.2. Consumer Electronics
- 10.3.3. Aerospace and Defense
- 10.3.4. Medical
- 10.3.5. Information Communication and Technology
- 10.3.6. Other End-user Industries
- 10.1. Market Analysis, Insights and Forecast - by Type
- 11. Taiwan GaN Industry Analysis, Insights and Forecast, 2020-2032
- 11.1. Market Analysis, Insights and Forecast - by Type
- 11.1.1. Power Semiconductors
- 11.1.2. Opto-Semiconductors
- 11.1.3. RF Semiconductors
- 11.2. Market Analysis, Insights and Forecast - by Devices
- 11.2.1. Transistors
- 11.2.2. Diodes
- 11.2.3. Rectifiers
- 11.2.4. Power ICs
- 11.3. Market Analysis, Insights and Forecast - by End-user Industry
- 11.3.1. Automotive
- 11.3.2. Consumer Electronics
- 11.3.3. Aerospace and Defense
- 11.3.4. Medical
- 11.3.5. Information Communication and Technology
- 11.3.6. Other End-user Industries
- 11.1. Market Analysis, Insights and Forecast - by Type
- 12. Latin America GaN Industry Analysis, Insights and Forecast, 2020-2032
- 12.1. Market Analysis, Insights and Forecast - by Type
- 12.1.1. Power Semiconductors
- 12.1.2. Opto-Semiconductors
- 12.1.3. RF Semiconductors
- 12.2. Market Analysis, Insights and Forecast - by Devices
- 12.2.1. Transistors
- 12.2.2. Diodes
- 12.2.3. Rectifiers
- 12.2.4. Power ICs
- 12.3. Market Analysis, Insights and Forecast - by End-user Industry
- 12.3.1. Automotive
- 12.3.2. Consumer Electronics
- 12.3.3. Aerospace and Defense
- 12.3.4. Medical
- 12.3.5. Information Communication and Technology
- 12.3.6. Other End-user Industries
- 12.1. Market Analysis, Insights and Forecast - by Type
- 13. Middle East and Africa GaN Industry Analysis, Insights and Forecast, 2020-2032
- 13.1. Market Analysis, Insights and Forecast - by Type
- 13.1.1. Power Semiconductors
- 13.1.2. Opto-Semiconductors
- 13.1.3. RF Semiconductors
- 13.2. Market Analysis, Insights and Forecast - by Devices
- 13.2.1. Transistors
- 13.2.2. Diodes
- 13.2.3. Rectifiers
- 13.2.4. Power ICs
- 13.3. Market Analysis, Insights and Forecast - by End-user Industry
- 13.3.1. Automotive
- 13.3.2. Consumer Electronics
- 13.3.3. Aerospace and Defense
- 13.3.4. Medical
- 13.3.5. Information Communication and Technology
- 13.3.6. Other End-user Industries
- 13.1. Market Analysis, Insights and Forecast - by Type
- 14. Competitive Analysis
- 14.1. Global Market Share Analysis 2025
- 14.2. Company Profiles
- 14.2.1 Efficient Power Conversion Corporation
- 14.2.1.1. Overview
- 14.2.1.2. Products
- 14.2.1.3. SWOT Analysis
- 14.2.1.4. Recent Developments
- 14.2.1.5. Financials (Based on Availability)
- 14.2.2 Infineon Technologies AG
- 14.2.2.1. Overview
- 14.2.2.2. Products
- 14.2.2.3. SWOT Analysis
- 14.2.2.4. Recent Developments
- 14.2.2.5. Financials (Based on Availability)
- 14.2.3 Microchip Technology Inc
- 14.2.3.1. Overview
- 14.2.3.2. Products
- 14.2.3.3. SWOT Analysis
- 14.2.3.4. Recent Developments
- 14.2.3.5. Financials (Based on Availability)
- 14.2.4 GaN Systems
- 14.2.4.1. Overview
- 14.2.4.2. Products
- 14.2.4.3. SWOT Analysis
- 14.2.4.4. Recent Developments
- 14.2.4.5. Financials (Based on Availability)
- 14.2.5 NexGen Power Systems
- 14.2.5.1. Overview
- 14.2.5.2. Products
- 14.2.5.3. SWOT Analysis
- 14.2.5.4. Recent Developments
- 14.2.5.5. Financials (Based on Availability)
- 14.2.6 NXP Semiconductors
- 14.2.6.1. Overview
- 14.2.6.2. Products
- 14.2.6.3. SWOT Analysis
- 14.2.6.4. Recent Developments
- 14.2.6.5. Financials (Based on Availability)
- 14.2.7 Wolfspeed Inc
- 14.2.7.1. Overview
- 14.2.7.2. Products
- 14.2.7.3. SWOT Analysis
- 14.2.7.4. Recent Developments
- 14.2.7.5. Financials (Based on Availability)
- 14.2.8 Toshiba Electronic Devices & Storage Corporation
- 14.2.8.1. Overview
- 14.2.8.2. Products
- 14.2.8.3. SWOT Analysis
- 14.2.8.4. Recent Developments
- 14.2.8.5. Financials (Based on Availability)
- 14.2.9 Soitec
- 14.2.9.1. Overview
- 14.2.9.2. Products
- 14.2.9.3. SWOT Analysis
- 14.2.9.4. Recent Developments
- 14.2.9.5. Financials (Based on Availability)
- 14.2.10 Qorvo Inc
- 14.2.10.1. Overview
- 14.2.10.2. Products
- 14.2.10.3. SWOT Analysis
- 14.2.10.4. Recent Developments
- 14.2.10.5. Financials (Based on Availability)
- 14.2.11 Texas Instruments Incorporated
- 14.2.11.1. Overview
- 14.2.11.2. Products
- 14.2.11.3. SWOT Analysis
- 14.2.11.4. Recent Developments
- 14.2.11.5. Financials (Based on Availability)
- 14.2.12 NTT Advanced Technology Corporation*List Not Exhaustive
- 14.2.12.1. Overview
- 14.2.12.2. Products
- 14.2.12.3. SWOT Analysis
- 14.2.12.4. Recent Developments
- 14.2.12.5. Financials (Based on Availability)
- 14.2.1 Efficient Power Conversion Corporation
List of Figures
- Figure 1: Global GaN Industry Revenue Breakdown (Million, %) by Region 2025 & 2033
- Figure 2: United States GaN Industry Revenue (Million), by Type 2025 & 2033
- Figure 3: United States GaN Industry Revenue Share (%), by Type 2025 & 2033
- Figure 4: United States GaN Industry Revenue (Million), by Devices 2025 & 2033
- Figure 5: United States GaN Industry Revenue Share (%), by Devices 2025 & 2033
- Figure 6: United States GaN Industry Revenue (Million), by End-user Industry 2025 & 2033
- Figure 7: United States GaN Industry Revenue Share (%), by End-user Industry 2025 & 2033
- Figure 8: United States GaN Industry Revenue (Million), by Country 2025 & 2033
- Figure 9: United States GaN Industry Revenue Share (%), by Country 2025 & 2033
- Figure 10: Europe GaN Industry Revenue (Million), by Type 2025 & 2033
- Figure 11: Europe GaN Industry Revenue Share (%), by Type 2025 & 2033
- Figure 12: Europe GaN Industry Revenue (Million), by Devices 2025 & 2033
- Figure 13: Europe GaN Industry Revenue Share (%), by Devices 2025 & 2033
- Figure 14: Europe GaN Industry Revenue (Million), by End-user Industry 2025 & 2033
- Figure 15: Europe GaN Industry Revenue Share (%), by End-user Industry 2025 & 2033
- Figure 16: Europe GaN Industry Revenue (Million), by Country 2025 & 2033
- Figure 17: Europe GaN Industry Revenue Share (%), by Country 2025 & 2033
- Figure 18: Japan GaN Industry Revenue (Million), by Type 2025 & 2033
- Figure 19: Japan GaN Industry Revenue Share (%), by Type 2025 & 2033
- Figure 20: Japan GaN Industry Revenue (Million), by Devices 2025 & 2033
- Figure 21: Japan GaN Industry Revenue Share (%), by Devices 2025 & 2033
- Figure 22: Japan GaN Industry Revenue (Million), by End-user Industry 2025 & 2033
- Figure 23: Japan GaN Industry Revenue Share (%), by End-user Industry 2025 & 2033
- Figure 24: Japan GaN Industry Revenue (Million), by Country 2025 & 2033
- Figure 25: Japan GaN Industry Revenue Share (%), by Country 2025 & 2033
- Figure 26: China GaN Industry Revenue (Million), by Type 2025 & 2033
- Figure 27: China GaN Industry Revenue Share (%), by Type 2025 & 2033
- Figure 28: China GaN Industry Revenue (Million), by Devices 2025 & 2033
- Figure 29: China GaN Industry Revenue Share (%), by Devices 2025 & 2033
- Figure 30: China GaN Industry Revenue (Million), by End-user Industry 2025 & 2033
- Figure 31: China GaN Industry Revenue Share (%), by End-user Industry 2025 & 2033
- Figure 32: China GaN Industry Revenue (Million), by Country 2025 & 2033
- Figure 33: China GaN Industry Revenue Share (%), by Country 2025 & 2033
- Figure 34: Korea GaN Industry Revenue (Million), by Type 2025 & 2033
- Figure 35: Korea GaN Industry Revenue Share (%), by Type 2025 & 2033
- Figure 36: Korea GaN Industry Revenue (Million), by Devices 2025 & 2033
- Figure 37: Korea GaN Industry Revenue Share (%), by Devices 2025 & 2033
- Figure 38: Korea GaN Industry Revenue (Million), by End-user Industry 2025 & 2033
- Figure 39: Korea GaN Industry Revenue Share (%), by End-user Industry 2025 & 2033
- Figure 40: Korea GaN Industry Revenue (Million), by Country 2025 & 2033
- Figure 41: Korea GaN Industry Revenue Share (%), by Country 2025 & 2033
- Figure 42: Taiwan GaN Industry Revenue (Million), by Type 2025 & 2033
- Figure 43: Taiwan GaN Industry Revenue Share (%), by Type 2025 & 2033
- Figure 44: Taiwan GaN Industry Revenue (Million), by Devices 2025 & 2033
- Figure 45: Taiwan GaN Industry Revenue Share (%), by Devices 2025 & 2033
- Figure 46: Taiwan GaN Industry Revenue (Million), by End-user Industry 2025 & 2033
- Figure 47: Taiwan GaN Industry Revenue Share (%), by End-user Industry 2025 & 2033
- Figure 48: Taiwan GaN Industry Revenue (Million), by Country 2025 & 2033
- Figure 49: Taiwan GaN Industry Revenue Share (%), by Country 2025 & 2033
- Figure 50: Latin America GaN Industry Revenue (Million), by Type 2025 & 2033
- Figure 51: Latin America GaN Industry Revenue Share (%), by Type 2025 & 2033
- Figure 52: Latin America GaN Industry Revenue (Million), by Devices 2025 & 2033
- Figure 53: Latin America GaN Industry Revenue Share (%), by Devices 2025 & 2033
- Figure 54: Latin America GaN Industry Revenue (Million), by End-user Industry 2025 & 2033
- Figure 55: Latin America GaN Industry Revenue Share (%), by End-user Industry 2025 & 2033
- Figure 56: Latin America GaN Industry Revenue (Million), by Country 2025 & 2033
- Figure 57: Latin America GaN Industry Revenue Share (%), by Country 2025 & 2033
- Figure 58: Middle East and Africa GaN Industry Revenue (Million), by Type 2025 & 2033
- Figure 59: Middle East and Africa GaN Industry Revenue Share (%), by Type 2025 & 2033
- Figure 60: Middle East and Africa GaN Industry Revenue (Million), by Devices 2025 & 2033
- Figure 61: Middle East and Africa GaN Industry Revenue Share (%), by Devices 2025 & 2033
- Figure 62: Middle East and Africa GaN Industry Revenue (Million), by End-user Industry 2025 & 2033
- Figure 63: Middle East and Africa GaN Industry Revenue Share (%), by End-user Industry 2025 & 2033
- Figure 64: Middle East and Africa GaN Industry Revenue (Million), by Country 2025 & 2033
- Figure 65: Middle East and Africa GaN Industry Revenue Share (%), by Country 2025 & 2033
List of Tables
- Table 1: Global GaN Industry Revenue Million Forecast, by Type 2020 & 2033
- Table 2: Global GaN Industry Revenue Million Forecast, by Devices 2020 & 2033
- Table 3: Global GaN Industry Revenue Million Forecast, by End-user Industry 2020 & 2033
- Table 4: Global GaN Industry Revenue Million Forecast, by Region 2020 & 2033
- Table 5: Global GaN Industry Revenue Million Forecast, by Type 2020 & 2033
- Table 6: Global GaN Industry Revenue Million Forecast, by Devices 2020 & 2033
- Table 7: Global GaN Industry Revenue Million Forecast, by End-user Industry 2020 & 2033
- Table 8: Global GaN Industry Revenue Million Forecast, by Country 2020 & 2033
- Table 9: Global GaN Industry Revenue Million Forecast, by Type 2020 & 2033
- Table 10: Global GaN Industry Revenue Million Forecast, by Devices 2020 & 2033
- Table 11: Global GaN Industry Revenue Million Forecast, by End-user Industry 2020 & 2033
- Table 12: Global GaN Industry Revenue Million Forecast, by Country 2020 & 2033
- Table 13: Global GaN Industry Revenue Million Forecast, by Type 2020 & 2033
- Table 14: Global GaN Industry Revenue Million Forecast, by Devices 2020 & 2033
- Table 15: Global GaN Industry Revenue Million Forecast, by End-user Industry 2020 & 2033
- Table 16: Global GaN Industry Revenue Million Forecast, by Country 2020 & 2033
- Table 17: Global GaN Industry Revenue Million Forecast, by Type 2020 & 2033
- Table 18: Global GaN Industry Revenue Million Forecast, by Devices 2020 & 2033
- Table 19: Global GaN Industry Revenue Million Forecast, by End-user Industry 2020 & 2033
- Table 20: Global GaN Industry Revenue Million Forecast, by Country 2020 & 2033
- Table 21: Global GaN Industry Revenue Million Forecast, by Type 2020 & 2033
- Table 22: Global GaN Industry Revenue Million Forecast, by Devices 2020 & 2033
- Table 23: Global GaN Industry Revenue Million Forecast, by End-user Industry 2020 & 2033
- Table 24: Global GaN Industry Revenue Million Forecast, by Country 2020 & 2033
- Table 25: Global GaN Industry Revenue Million Forecast, by Type 2020 & 2033
- Table 26: Global GaN Industry Revenue Million Forecast, by Devices 2020 & 2033
- Table 27: Global GaN Industry Revenue Million Forecast, by End-user Industry 2020 & 2033
- Table 28: Global GaN Industry Revenue Million Forecast, by Country 2020 & 2033
- Table 29: Global GaN Industry Revenue Million Forecast, by Type 2020 & 2033
- Table 30: Global GaN Industry Revenue Million Forecast, by Devices 2020 & 2033
- Table 31: Global GaN Industry Revenue Million Forecast, by End-user Industry 2020 & 2033
- Table 32: Global GaN Industry Revenue Million Forecast, by Country 2020 & 2033
- Table 33: Global GaN Industry Revenue Million Forecast, by Type 2020 & 2033
- Table 34: Global GaN Industry Revenue Million Forecast, by Devices 2020 & 2033
- Table 35: Global GaN Industry Revenue Million Forecast, by End-user Industry 2020 & 2033
- Table 36: Global GaN Industry Revenue Million Forecast, by Country 2020 & 2033
Frequently Asked Questions
1. What is the projected Compound Annual Growth Rate (CAGR) of the GaN Industry?
The projected CAGR is approximately 6.06%.
2. Which companies are prominent players in the GaN Industry?
Key companies in the market include Efficient Power Conversion Corporation, Infineon Technologies AG, Microchip Technology Inc, GaN Systems, NexGen Power Systems, NXP Semiconductors, Wolfspeed Inc, Toshiba Electronic Devices & Storage Corporation, Soitec, Qorvo Inc, Texas Instruments Incorporated, NTT Advanced Technology Corporation*List Not Exhaustive.
3. What are the main segments of the GaN Industry?
The market segments include Type, Devices, End-user Industry.
4. Can you provide details about the market size?
The market size is estimated to be USD 21.18 Million as of 2022.
5. What are some drivers contributing to market growth?
Strong Demand from Telecom Infrastructure Segment Driven by Advancements in 5G Implementation; Favorable Attributes Such As High-performance and Small Form Factor to Drive Adoption in the Military Segment.
6. What are the notable trends driving market growth?
Consumer Electronics to Hold Significant Market Share.
7. Are there any restraints impacting market growth?
; Declining Volume of Traditional Mails; High Adoption Costs.
8. Can you provide examples of recent developments in the market?
Jan 2024: Silvaco Group, Inc., a leading provider of TCAD, EDA software, and design IP, partnered with GaN Valley to drive advancements in efficient gallium nitride (GaN) power device design. By leveraging its Victory TCAD platform, Silvaco aims to empower customers to innovate and optimize performance in GaN-based semiconductor power devices. The Victory TCAD platform offers a comprehensive simulation environment, incorporating diverse numerical methods, physical models, SPICE model generation, and a user-friendly graphical interface, tailored specifically for the latest generation of GaN-based power devices.
9. What pricing options are available for accessing the report?
Pricing options include single-user, multi-user, and enterprise licenses priced at USD 4750, USD 5250, and USD 8750 respectively.
10. Is the market size provided in terms of value or volume?
The market size is provided in terms of value, measured in Million.
11. Are there any specific market keywords associated with the report?
Yes, the market keyword associated with the report is "GaN Industry," which aids in identifying and referencing the specific market segment covered.
12. How do I determine which pricing option suits my needs best?
The pricing options vary based on user requirements and access needs. Individual users may opt for single-user licenses, while businesses requiring broader access may choose multi-user or enterprise licenses for cost-effective access to the report.
13. Are there any additional resources or data provided in the GaN Industry report?
While the report offers comprehensive insights, it's advisable to review the specific contents or supplementary materials provided to ascertain if additional resources or data are available.
14. How can I stay updated on further developments or reports in the GaN Industry?
To stay informed about further developments, trends, and reports in the GaN Industry, consider subscribing to industry newsletters, following relevant companies and organizations, or regularly checking reputable industry news sources and publications.
Methodology
Step 1 - Identification of Relevant Samples Size from Population Database


Step 2 - Approaches for Defining Global Market Size (Value, Volume* & Price*)

Note*: In applicable scenarios
Step 3 - Data Sources
Primary Research
- Web Analytics
- Survey Reports
- Research Institute
- Latest Research Reports
- Opinion Leaders
Secondary Research
- Annual Reports
- White Paper
- Latest Press Release
- Industry Association
- Paid Database
- Investor Presentations

Step 4 - Data Triangulation
Involves using different sources of information in order to increase the validity of a study
These sources are likely to be stakeholders in a program - participants, other researchers, program staff, other community members, and so on.
Then we put all data in single framework & apply various statistical tools to find out the dynamic on the market.
During the analysis stage, feedback from the stakeholder groups would be compared to determine areas of agreement as well as areas of divergence