
Key Insights
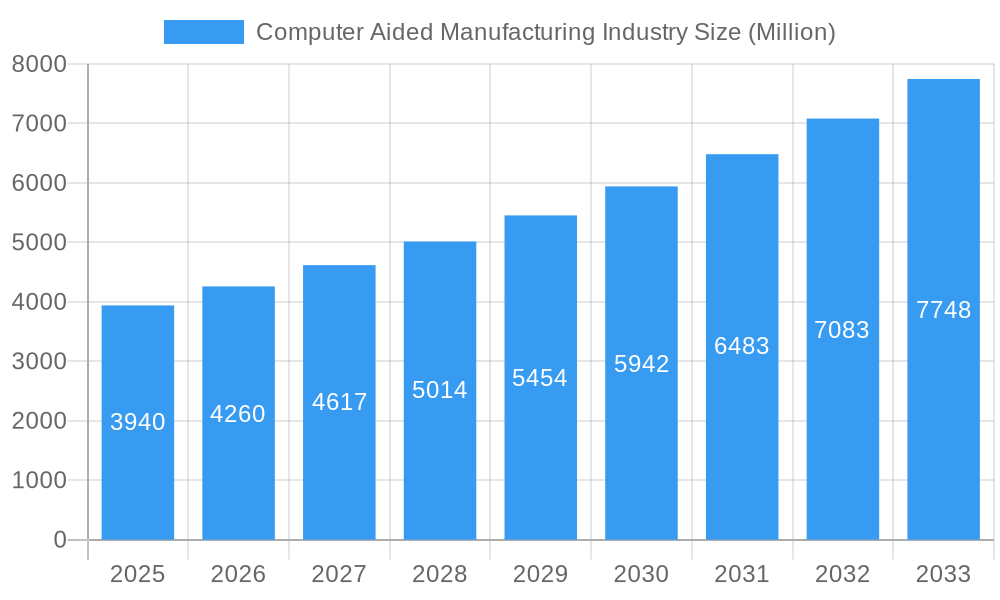
The Computer-Aided Manufacturing (CAM) industry is experiencing robust growth, projected to reach a market size of $3.94 billion in 2025, expanding at a Compound Annual Growth Rate (CAGR) of 8.13%. This growth is fueled by several key drivers. Increasing automation across various sectors, particularly aerospace & defense, automotive, and medical, demands sophisticated CAM software for optimized production processes. The trend towards Industry 4.0 and the adoption of digital twins are further accelerating market expansion. Companies are investing heavily in advanced CAM solutions to enhance efficiency, reduce production costs, and improve product quality. While the initial investment in CAM software can be a restraint for some smaller companies, the long-term return on investment (ROI) in terms of increased productivity and reduced waste is a compelling incentive. The market is segmented by end-user industry, with aerospace & defense and automotive likely representing the largest segments given their high reliance on precision manufacturing. Geographic distribution shows significant presence across North America, Europe, and Asia-Pacific, reflecting global manufacturing hubs. Key players like Dassault Systèmes, PTC, and Autodesk are actively innovating and consolidating market share through acquisitions and strategic partnerships. The forecast period (2025-2033) promises continued growth, driven by technological advancements such as AI-powered CAM solutions and the expansion of additive manufacturing capabilities. Competition among established players and emerging startups will intensify, driving further innovation and potentially leading to mergers and acquisitions within the industry. The continuous development of more user-friendly and affordable software solutions will broaden access to CAM technology, encouraging wider adoption amongst smaller and medium-sized enterprises (SMEs).

Computer Aided Manufacturing Industry Market Size (In Billion)
The future of the CAM market hinges on the successful integration of CAM solutions with other Industry 4.0 technologies like IoT, cloud computing, and big data analytics. This integration will enable real-time monitoring, predictive maintenance, and optimized resource allocation. Furthermore, the increasing demand for customized products and shorter product lifecycles necessitate flexible and adaptable CAM solutions. The ability of CAM software to handle complex geometries and materials, coupled with the rising adoption of sustainable manufacturing practices, will drive demand. The growing focus on cybersecurity within industrial automation will also play a crucial role, influencing the development and deployment of secure CAM solutions. Regional variations will likely persist, with developed economies continuing to dominate the market, although emerging economies in Asia-Pacific and South America are expected to exhibit faster growth rates due to increasing industrialization and investments in advanced manufacturing capabilities.
Computer Aided Manufacturing Industry Company Market Share
Computer Aided Manufacturing (CAM) Industry Market Report: 2019-2033
This comprehensive report provides a detailed analysis of the Computer Aided Manufacturing (CAM) industry, offering invaluable insights for stakeholders, investors, and industry professionals. With a study period spanning 2019-2033, a base year of 2025, and a forecast period of 2025-2033, this report leverages extensive data and expert analysis to paint a clear picture of the current market landscape and future growth trajectories. The report covers key segments, leading players like Dassault Systèmes, PTC, and Autodesk, and emerging trends shaping this dynamic sector. Expect detailed analysis of market size (in millions of USD), CAGR, market share, and key growth drivers. Download now to gain a competitive edge!
Computer Aided Manufacturing Industry Market Concentration & Dynamics
The Computer Aided Manufacturing (CAM) market is characterized by a moderately concentrated landscape, with a few major players holding significant market share. However, a vibrant ecosystem of smaller, specialized firms also contributes significantly to innovation and competition. The market's dynamics are driven by several key factors:
Market Concentration: The top 5 players likely hold approximately xx% of the global market share in 2025, indicating a moderately concentrated market. This concentration is expected to remain relatively stable over the forecast period, although the exact market shares may fluctuate due to mergers and acquisitions (M&A) activity and the emergence of new technologies.
Innovation Ecosystems: The CAM industry thrives on continuous innovation. Collaboration between software vendors, hardware manufacturers, and end-users fuels the development of advanced CAM solutions. Open-source initiatives and the availability of extensive APIs also contribute to fostering innovation.
Regulatory Frameworks: Government regulations concerning manufacturing processes, data security, and environmental compliance significantly impact the CAM market. Changes in regulations, particularly related to data privacy and automation standards, can create both opportunities and challenges.
Substitute Products: While traditional CAM software remains the dominant technology, the emergence of alternative approaches, such as generative design tools and AI-powered automation systems, poses a potential threat, but also creates new opportunities for integration.
End-User Trends: The increasing demand for customized products, shorter product lifecycles, and the need for enhanced manufacturing efficiency are key end-user trends driving the adoption of advanced CAM solutions. Businesses are increasingly prioritizing automation and data analytics to improve productivity and reduce costs.
M&A Activities: The CAM industry has witnessed a significant number of mergers and acquisitions (M&As) in recent years. xx M&A deals were recorded between 2019 and 2024. These activities reflect the consolidation of the market, the pursuit of technological synergies, and the expansion into new geographic regions.
Computer Aided Manufacturing Industry Industry Insights & Trends
The global Computer Aided Manufacturing (CAM) market is experiencing robust growth, driven by several key factors. The market size reached approximately $xx million in 2024 and is projected to reach $xx million by 2033, exhibiting a CAGR of xx% during the forecast period. This growth is fueled by several crucial factors:
Technological Disruptions: The industry is constantly evolving, with breakthroughs in areas like AI, cloud computing, and additive manufacturing transforming CAM capabilities. Integration of AI and machine learning into CAM software is enhancing automation, optimizing processes, and improving overall manufacturing efficiency. The adoption of cloud-based CAM solutions is simplifying access to software and facilitating collaboration among stakeholders.
Evolving Consumer Behaviors: The increasing demand for mass customization and personalized products necessitates more agile and flexible manufacturing processes. CAM software plays a crucial role in fulfilling this demand by enabling manufacturers to efficiently produce customized goods while maintaining high quality and accuracy.
Market Growth Drivers: The rising adoption of Industry 4.0 principles, the increased automation of manufacturing processes, and the growing demand for advanced manufacturing technologies in diverse industries are significant drivers of CAM market growth. Investments in research and development, particularly in areas such as generative design and digital twins, are further accelerating the market's expansion. Furthermore, the growing need for improved supply chain visibility and enhanced quality control is spurring the adoption of CAM solutions across various sectors.
Key Markets & Segments Leading Computer Aided Manufacturing Industry
The global CAM market shows significant regional variations, with North America and Europe currently dominating the market. However, the Asia-Pacific region is experiencing rapid growth due to its large manufacturing base and increasing investments in advanced technologies. Within end-user industries:
Aerospace & Defense: This segment is a significant driver due to the demanding quality and precision standards for aerospace components. Revenue in this sector was approximately $xx million in 2024 with a projected market share of xx%. Key growth drivers include increasing defense spending and the growing adoption of advanced manufacturing techniques in aerospace manufacturing.
Automotive: The automotive sector's large-scale production requirements drive substantial demand for CAM solutions, representing a market value of approximately $xx million in 2024, and a projected market share of xx%. Drivers include the rise of electric vehicles, increasing demand for lightweight materials, and the implementation of advanced manufacturing processes like automated guided vehicles (AGVs).
Medical: The medical device industry relies heavily on precise manufacturing for implants, prosthetics, and other medical instruments. This contributes approximately $xx million to the CAM market in 2024, with a market share of xx%. Drivers are the increasing demand for medical devices and the rising adoption of 3D printing techniques.
Energy & Utilities: This segment's demand for efficient and cost-effective manufacturing processes drives CAM adoption. The market value of the energy & utilities sector in 2024 was approximately $xx million, holding a xx% market share. Key drivers include the rising demand for renewable energy, increasing investments in infrastructure projects, and the need to improve operational efficiency.
Other End-User Industries: This segment includes sectors such as consumer goods, electronics, and machinery. These combined industries accounted for approximately $xx million in 2024, with a projected market share of xx%. Drivers within this segment include diverse industry-specific needs and increasing adoption of automation and digitalization initiatives.
Computer Aided Manufacturing Industry Product Developments
Recent advancements in CAM software have focused on enhancing automation, simulation capabilities, and integration with other manufacturing technologies. The introduction of generative design tools allows for the automatic creation of optimized designs based on specified parameters, while advancements in simulation capabilities improve the accuracy of manufacturing processes. Integration with additive manufacturing technologies (3D printing) enables hybrid manufacturing approaches, leading to improved efficiency and design flexibility. The competitive landscape is characterized by ongoing innovation in software algorithms, cloud-based solutions, and AI-driven features, ensuring that CAM solutions are constantly adapting to meet the changing needs of manufacturers.
Challenges in the Computer Aided Manufacturing Industry Market
The CAM industry faces several key challenges:
High initial investment costs for advanced CAM software and hardware can be a barrier for small and medium-sized enterprises (SMEs).
The complexity of integrating CAM solutions into existing manufacturing processes necessitates specialized expertise and can be time-consuming and expensive.
Cybersecurity risks associated with increasingly connected manufacturing environments necessitate robust security measures to protect sensitive data.
Supply chain disruptions can impact the availability of critical components and materials, hindering manufacturing operations.
Competition from emerging technologies such as generative design and AI-powered automation necessitates continuous adaptation and innovation.
Forces Driving Computer Aided Manufacturing Industry Growth
Several factors contribute to the growth of the CAM industry:
Technological advancements: AI, cloud computing, and IoT technologies are enhancing CAM capabilities, driving automation and efficiency gains.
Government initiatives: Government support for Industry 4.0 and advanced manufacturing encourages CAM adoption.
Economic growth: Rising global economic activity and increased industrial output directly influence CAM demand.
Demand for customized products: The growing preference for personalized goods fuels the need for flexible and efficient manufacturing solutions.
Long-Term Growth Catalysts in the Computer Aided Manufacturing Industry Market
Long-term growth in the CAM market will be driven by continued technological innovations, strategic partnerships among industry players, and market expansions into emerging economies. The development of next-generation CAM software with enhanced AI capabilities and seamless integration with other Industry 4.0 technologies will be key drivers of future growth. Collaborative efforts between software vendors, hardware manufacturers, and end-users will further accelerate the adoption of advanced CAM solutions. Expanding into new geographical markets, particularly in rapidly developing economies, will also contribute to the long-term growth of the CAM industry.
Emerging Opportunities in Computer Aided Manufacturing Industry
Emerging opportunities lie in several key areas:
Expansion into new markets: The increasing demand for advanced manufacturing in developing economies presents significant growth potential.
Integration with IoT and AI: Leveraging IoT and AI to create intelligent manufacturing systems offers enhanced efficiency and data-driven decision-making capabilities.
Development of specialized CAM solutions: Tailoring CAM software to meet the specific needs of various industry verticals can unlock further market expansion.
Leading Players in the Computer Aided Manufacturing Industry Sector
- Dassault Systèmes
- PTC
- MecSoft Corporation
- Hexagon AB
- NTT DATA Corporation
- Siemens AG
- SolidCAM Ltd
- OPEN MIND Technologies AG
- Autodesk Inc
- 3D Systems Inc
- BobCAD-CAM
- SmartCAMcnc
- ZWSOFTCO LTD (Guangzhou)
- HCL Technologies Limited
- CNC Software LLC (Mastercam)
Key Milestones in Computer Aided Manufacturing Industry Industry
November 2023: Microlight3D launched Luminis software, a CAM software specifically designed for microFAB-3D, enabling 3D printing of objects 100 times smaller than a strand of hair, with 3D visualization capturing 40-60 fps data. This significantly expands the possibilities of micro-manufacturing for applications in micro-robotics, microfluidics, and other micro-technologies.
May 2023: NVIDIA introduced NVIDIA Omniverse, a platform connecting CAD apps, APIs, and AI frameworks for generative AI, robot simulation (Isaac Sim), and automated optical inspection (Metropolis). This platform facilitates the creation of virtual factories, optimizing manufacturing workflows, and improving quality control and safety.
Strategic Outlook for Computer Aided Manufacturing Industry Market
The future of the CAM industry looks bright, with significant potential for growth driven by technological innovation, increasing automation, and the expanding adoption of digital manufacturing strategies. Companies that embrace AI, cloud computing, and other cutting-edge technologies will be well-positioned to capitalize on emerging opportunities. Strategic partnerships and collaborations will play a crucial role in driving innovation and market expansion. Focusing on developing user-friendly, versatile software solutions tailored to the specific needs of various industry verticals will be vital for capturing market share and securing long-term success.
Computer Aided Manufacturing Industry Segmentation
-
1. Deployment Model
- 1.1. On-Premises
- 1.2. Cloud-Based
-
2. End-User Industry
- 2.1. Aerospace & Defense
- 2.2. Automotive
- 2.3. Medical
- 2.4. Energy & Utilities
- 2.5. Other End-User Industries
Computer Aided Manufacturing Industry Segmentation By Geography
-
1. North America
- 1.1. United States
- 1.2. Canada
-
2. Europe
- 2.1. Germany
- 2.2. Switzerland
- 2.3. Spain
- 2.4. Austria
- 2.5. Belgium
- 2.6. Netherlands
- 2.7. United Kingdom
- 2.8. France
- 2.9. Italy
- 2.10. Sweden
- 2.11. Poland
-
3. Asia
- 3.1. China
- 3.2. Japan
- 3.3. South Korea
- 3.4. India
- 4. Australia and New Zealand
-
5. Latin America
- 5.1. Brazil
- 5.2. Mexico
-
6. Middle East and Africa
- 6.1. United Arab Emirates
- 6.2. Saudi Arabia
- 6.3. South Africa

Computer Aided Manufacturing Industry Regional Market Share
Geographic Coverage of Computer Aided Manufacturing Industry
Computer Aided Manufacturing Industry REPORT HIGHLIGHTS
| Aspects | Details |
|---|---|
| Study Period | 2020-2034 |
| Base Year | 2025 |
| Estimated Year | 2026 |
| Forecast Period | 2026-2034 |
| Historical Period | 2020-2025 |
| Growth Rate | CAGR of 8.13% from 2020-2034 |
| Segmentation |
|
Table of Contents
- 1. Introduction
- 1.1. Research Scope
- 1.2. Market Segmentation
- 1.3. Research Methodology
- 1.4. Definitions and Assumptions
- 2. Executive Summary
- 2.1. Introduction
- 3. Market Dynamics
- 3.1. Introduction
- 3.2. Market Drivers
- 3.2.1. Increasing Adoption of Industry 4.; Growing Utilization of CAM Software in the Packaging Machinery Sector
- 3.3. Market Restrains
- 3.3.1. Wide Availability of Open Source CAM Software
- 3.4. Market Trends
- 3.4.1. Automotive is Expected to Hold a Major Market Share
- 4. Market Factor Analysis
- 4.1. Porters Five Forces
- 4.2. Supply/Value Chain
- 4.3. PESTEL analysis
- 4.4. Market Entropy
- 4.5. Patent/Trademark Analysis
- 5. Global Computer Aided Manufacturing Industry Analysis, Insights and Forecast, 2020-2032
- 5.1. Market Analysis, Insights and Forecast - by Deployment Model
- 5.1.1. On-Premises
- 5.1.2. Cloud-Based
- 5.2. Market Analysis, Insights and Forecast - by End-User Industry
- 5.2.1. Aerospace & Defense
- 5.2.2. Automotive
- 5.2.3. Medical
- 5.2.4. Energy & Utilities
- 5.2.5. Other End-User Industries
- 5.3. Market Analysis, Insights and Forecast - by Region
- 5.3.1. North America
- 5.3.2. Europe
- 5.3.3. Asia
- 5.3.4. Australia and New Zealand
- 5.3.5. Latin America
- 5.3.6. Middle East and Africa
- 5.1. Market Analysis, Insights and Forecast - by Deployment Model
- 6. North America Computer Aided Manufacturing Industry Analysis, Insights and Forecast, 2020-2032
- 6.1. Market Analysis, Insights and Forecast - by Deployment Model
- 6.1.1. On-Premises
- 6.1.2. Cloud-Based
- 6.2. Market Analysis, Insights and Forecast - by End-User Industry
- 6.2.1. Aerospace & Defense
- 6.2.2. Automotive
- 6.2.3. Medical
- 6.2.4. Energy & Utilities
- 6.2.5. Other End-User Industries
- 6.1. Market Analysis, Insights and Forecast - by Deployment Model
- 7. Europe Computer Aided Manufacturing Industry Analysis, Insights and Forecast, 2020-2032
- 7.1. Market Analysis, Insights and Forecast - by Deployment Model
- 7.1.1. On-Premises
- 7.1.2. Cloud-Based
- 7.2. Market Analysis, Insights and Forecast - by End-User Industry
- 7.2.1. Aerospace & Defense
- 7.2.2. Automotive
- 7.2.3. Medical
- 7.2.4. Energy & Utilities
- 7.2.5. Other End-User Industries
- 7.1. Market Analysis, Insights and Forecast - by Deployment Model
- 8. Asia Computer Aided Manufacturing Industry Analysis, Insights and Forecast, 2020-2032
- 8.1. Market Analysis, Insights and Forecast - by Deployment Model
- 8.1.1. On-Premises
- 8.1.2. Cloud-Based
- 8.2. Market Analysis, Insights and Forecast - by End-User Industry
- 8.2.1. Aerospace & Defense
- 8.2.2. Automotive
- 8.2.3. Medical
- 8.2.4. Energy & Utilities
- 8.2.5. Other End-User Industries
- 8.1. Market Analysis, Insights and Forecast - by Deployment Model
- 9. Australia and New Zealand Computer Aided Manufacturing Industry Analysis, Insights and Forecast, 2020-2032
- 9.1. Market Analysis, Insights and Forecast - by Deployment Model
- 9.1.1. On-Premises
- 9.1.2. Cloud-Based
- 9.2. Market Analysis, Insights and Forecast - by End-User Industry
- 9.2.1. Aerospace & Defense
- 9.2.2. Automotive
- 9.2.3. Medical
- 9.2.4. Energy & Utilities
- 9.2.5. Other End-User Industries
- 9.1. Market Analysis, Insights and Forecast - by Deployment Model
- 10. Latin America Computer Aided Manufacturing Industry Analysis, Insights and Forecast, 2020-2032
- 10.1. Market Analysis, Insights and Forecast - by Deployment Model
- 10.1.1. On-Premises
- 10.1.2. Cloud-Based
- 10.2. Market Analysis, Insights and Forecast - by End-User Industry
- 10.2.1. Aerospace & Defense
- 10.2.2. Automotive
- 10.2.3. Medical
- 10.2.4. Energy & Utilities
- 10.2.5. Other End-User Industries
- 10.1. Market Analysis, Insights and Forecast - by Deployment Model
- 11. Middle East and Africa Computer Aided Manufacturing Industry Analysis, Insights and Forecast, 2020-2032
- 11.1. Market Analysis, Insights and Forecast - by Deployment Model
- 11.1.1. On-Premises
- 11.1.2. Cloud-Based
- 11.2. Market Analysis, Insights and Forecast - by End-User Industry
- 11.2.1. Aerospace & Defense
- 11.2.2. Automotive
- 11.2.3. Medical
- 11.2.4. Energy & Utilities
- 11.2.5. Other End-User Industries
- 11.1. Market Analysis, Insights and Forecast - by Deployment Model
- 12. North America Computer Aided Manufacturing Industry Analysis, Insights and Forecast, 2020-2032
- 12.1. Market Analysis, Insights and Forecast - By Country/Sub-region
- 12.1.1 United States
- 12.1.2 Canada
- 12.1.3 Mexico
- 13. Europe Computer Aided Manufacturing Industry Analysis, Insights and Forecast, 2020-2032
- 13.1. Market Analysis, Insights and Forecast - By Country/Sub-region
- 13.1.1 Germany
- 13.1.2 United Kingdom
- 13.1.3 France
- 13.1.4 Spain
- 13.1.5 Italy
- 13.1.6 Spain
- 13.1.7 Belgium
- 13.1.8 Netherland
- 13.1.9 Nordics
- 13.1.10 Rest of Europe
- 14. Asia Pacific Computer Aided Manufacturing Industry Analysis, Insights and Forecast, 2020-2032
- 14.1. Market Analysis, Insights and Forecast - By Country/Sub-region
- 14.1.1 China
- 14.1.2 Japan
- 14.1.3 India
- 14.1.4 South Korea
- 14.1.5 Southeast Asia
- 14.1.6 Australia
- 14.1.7 Indonesia
- 14.1.8 Phillipes
- 14.1.9 Singapore
- 14.1.10 Thailandc
- 14.1.11 Rest of Asia Pacific
- 15. South America Computer Aided Manufacturing Industry Analysis, Insights and Forecast, 2020-2032
- 15.1. Market Analysis, Insights and Forecast - By Country/Sub-region
- 15.1.1 Brazil
- 15.1.2 Argentina
- 15.1.3 Peru
- 15.1.4 Chile
- 15.1.5 Colombia
- 15.1.6 Ecuador
- 15.1.7 Venezuela
- 15.1.8 Rest of South America
- 16. North America Computer Aided Manufacturing Industry Analysis, Insights and Forecast, 2020-2032
- 16.1. Market Analysis, Insights and Forecast - By Country/Sub-region
- 16.1.1 United States
- 16.1.2 Canada
- 16.1.3 Mexico
- 17. MEA Computer Aided Manufacturing Industry Analysis, Insights and Forecast, 2020-2032
- 17.1. Market Analysis, Insights and Forecast - By Country/Sub-region
- 17.1.1 United Arab Emirates
- 17.1.2 Saudi Arabia
- 17.1.3 South Africa
- 17.1.4 Rest of Middle East and Africa
- 18. Competitive Analysis
- 18.1. Global Market Share Analysis 2025
- 18.2. Company Profiles
- 18.2.1 Dassault Systems
- 18.2.1.1. Overview
- 18.2.1.2. Products
- 18.2.1.3. SWOT Analysis
- 18.2.1.4. Recent Developments
- 18.2.1.5. Financials (Based on Availability)
- 18.2.2 PTC
- 18.2.2.1. Overview
- 18.2.2.2. Products
- 18.2.2.3. SWOT Analysis
- 18.2.2.4. Recent Developments
- 18.2.2.5. Financials (Based on Availability)
- 18.2.3 MecSoft Corporation
- 18.2.3.1. Overview
- 18.2.3.2. Products
- 18.2.3.3. SWOT Analysis
- 18.2.3.4. Recent Developments
- 18.2.3.5. Financials (Based on Availability)
- 18.2.4 Hexagon AB
- 18.2.4.1. Overview
- 18.2.4.2. Products
- 18.2.4.3. SWOT Analysis
- 18.2.4.4. Recent Developments
- 18.2.4.5. Financials (Based on Availability)
- 18.2.5 NTT DATA Corporation
- 18.2.5.1. Overview
- 18.2.5.2. Products
- 18.2.5.3. SWOT Analysis
- 18.2.5.4. Recent Developments
- 18.2.5.5. Financials (Based on Availability)
- 18.2.6 Siemens AG
- 18.2.6.1. Overview
- 18.2.6.2. Products
- 18.2.6.3. SWOT Analysis
- 18.2.6.4. Recent Developments
- 18.2.6.5. Financials (Based on Availability)
- 18.2.7 SolidCAM Ltd
- 18.2.7.1. Overview
- 18.2.7.2. Products
- 18.2.7.3. SWOT Analysis
- 18.2.7.4. Recent Developments
- 18.2.7.5. Financials (Based on Availability)
- 18.2.8 OPEN MIND Technologies AG
- 18.2.8.1. Overview
- 18.2.8.2. Products
- 18.2.8.3. SWOT Analysis
- 18.2.8.4. Recent Developments
- 18.2.8.5. Financials (Based on Availability)
- 18.2.9 Autodesk Inc
- 18.2.9.1. Overview
- 18.2.9.2. Products
- 18.2.9.3. SWOT Analysis
- 18.2.9.4. Recent Developments
- 18.2.9.5. Financials (Based on Availability)
- 18.2.10 3D Systems Inc
- 18.2.10.1. Overview
- 18.2.10.2. Products
- 18.2.10.3. SWOT Analysis
- 18.2.10.4. Recent Developments
- 18.2.10.5. Financials (Based on Availability)
- 18.2.11 BobCAD-CAM
- 18.2.11.1. Overview
- 18.2.11.2. Products
- 18.2.11.3. SWOT Analysis
- 18.2.11.4. Recent Developments
- 18.2.11.5. Financials (Based on Availability)
- 18.2.12 SmartCAMcnc
- 18.2.12.1. Overview
- 18.2.12.2. Products
- 18.2.12.3. SWOT Analysis
- 18.2.12.4. Recent Developments
- 18.2.12.5. Financials (Based on Availability)
- 18.2.13 ZWSOFTCO LTD (Guangzhou)
- 18.2.13.1. Overview
- 18.2.13.2. Products
- 18.2.13.3. SWOT Analysis
- 18.2.13.4. Recent Developments
- 18.2.13.5. Financials (Based on Availability)
- 18.2.14 HCL Technologies Limited
- 18.2.14.1. Overview
- 18.2.14.2. Products
- 18.2.14.3. SWOT Analysis
- 18.2.14.4. Recent Developments
- 18.2.14.5. Financials (Based on Availability)
- 18.2.15 CNC Software LLC (Mastercam)
- 18.2.15.1. Overview
- 18.2.15.2. Products
- 18.2.15.3. SWOT Analysis
- 18.2.15.4. Recent Developments
- 18.2.15.5. Financials (Based on Availability)
- 18.2.1 Dassault Systems
List of Figures
- Figure 1: Global Computer Aided Manufacturing Industry Revenue Breakdown (Million, %) by Region 2025 & 2033
- Figure 2: North America Computer Aided Manufacturing Industry Revenue (Million), by Country 2025 & 2033
- Figure 3: North America Computer Aided Manufacturing Industry Revenue Share (%), by Country 2025 & 2033
- Figure 4: Europe Computer Aided Manufacturing Industry Revenue (Million), by Country 2025 & 2033
- Figure 5: Europe Computer Aided Manufacturing Industry Revenue Share (%), by Country 2025 & 2033
- Figure 6: Asia Pacific Computer Aided Manufacturing Industry Revenue (Million), by Country 2025 & 2033
- Figure 7: Asia Pacific Computer Aided Manufacturing Industry Revenue Share (%), by Country 2025 & 2033
- Figure 8: South America Computer Aided Manufacturing Industry Revenue (Million), by Country 2025 & 2033
- Figure 9: South America Computer Aided Manufacturing Industry Revenue Share (%), by Country 2025 & 2033
- Figure 10: North America Computer Aided Manufacturing Industry Revenue (Million), by Country 2025 & 2033
- Figure 11: North America Computer Aided Manufacturing Industry Revenue Share (%), by Country 2025 & 2033
- Figure 12: MEA Computer Aided Manufacturing Industry Revenue (Million), by Country 2025 & 2033
- Figure 13: MEA Computer Aided Manufacturing Industry Revenue Share (%), by Country 2025 & 2033
- Figure 14: North America Computer Aided Manufacturing Industry Revenue (Million), by Deployment Model 2025 & 2033
- Figure 15: North America Computer Aided Manufacturing Industry Revenue Share (%), by Deployment Model 2025 & 2033
- Figure 16: North America Computer Aided Manufacturing Industry Revenue (Million), by End-User Industry 2025 & 2033
- Figure 17: North America Computer Aided Manufacturing Industry Revenue Share (%), by End-User Industry 2025 & 2033
- Figure 18: North America Computer Aided Manufacturing Industry Revenue (Million), by Country 2025 & 2033
- Figure 19: North America Computer Aided Manufacturing Industry Revenue Share (%), by Country 2025 & 2033
- Figure 20: Europe Computer Aided Manufacturing Industry Revenue (Million), by Deployment Model 2025 & 2033
- Figure 21: Europe Computer Aided Manufacturing Industry Revenue Share (%), by Deployment Model 2025 & 2033
- Figure 22: Europe Computer Aided Manufacturing Industry Revenue (Million), by End-User Industry 2025 & 2033
- Figure 23: Europe Computer Aided Manufacturing Industry Revenue Share (%), by End-User Industry 2025 & 2033
- Figure 24: Europe Computer Aided Manufacturing Industry Revenue (Million), by Country 2025 & 2033
- Figure 25: Europe Computer Aided Manufacturing Industry Revenue Share (%), by Country 2025 & 2033
- Figure 26: Asia Computer Aided Manufacturing Industry Revenue (Million), by Deployment Model 2025 & 2033
- Figure 27: Asia Computer Aided Manufacturing Industry Revenue Share (%), by Deployment Model 2025 & 2033
- Figure 28: Asia Computer Aided Manufacturing Industry Revenue (Million), by End-User Industry 2025 & 2033
- Figure 29: Asia Computer Aided Manufacturing Industry Revenue Share (%), by End-User Industry 2025 & 2033
- Figure 30: Asia Computer Aided Manufacturing Industry Revenue (Million), by Country 2025 & 2033
- Figure 31: Asia Computer Aided Manufacturing Industry Revenue Share (%), by Country 2025 & 2033
- Figure 32: Australia and New Zealand Computer Aided Manufacturing Industry Revenue (Million), by Deployment Model 2025 & 2033
- Figure 33: Australia and New Zealand Computer Aided Manufacturing Industry Revenue Share (%), by Deployment Model 2025 & 2033
- Figure 34: Australia and New Zealand Computer Aided Manufacturing Industry Revenue (Million), by End-User Industry 2025 & 2033
- Figure 35: Australia and New Zealand Computer Aided Manufacturing Industry Revenue Share (%), by End-User Industry 2025 & 2033
- Figure 36: Australia and New Zealand Computer Aided Manufacturing Industry Revenue (Million), by Country 2025 & 2033
- Figure 37: Australia and New Zealand Computer Aided Manufacturing Industry Revenue Share (%), by Country 2025 & 2033
- Figure 38: Latin America Computer Aided Manufacturing Industry Revenue (Million), by Deployment Model 2025 & 2033
- Figure 39: Latin America Computer Aided Manufacturing Industry Revenue Share (%), by Deployment Model 2025 & 2033
- Figure 40: Latin America Computer Aided Manufacturing Industry Revenue (Million), by End-User Industry 2025 & 2033
- Figure 41: Latin America Computer Aided Manufacturing Industry Revenue Share (%), by End-User Industry 2025 & 2033
- Figure 42: Latin America Computer Aided Manufacturing Industry Revenue (Million), by Country 2025 & 2033
- Figure 43: Latin America Computer Aided Manufacturing Industry Revenue Share (%), by Country 2025 & 2033
- Figure 44: Middle East and Africa Computer Aided Manufacturing Industry Revenue (Million), by Deployment Model 2025 & 2033
- Figure 45: Middle East and Africa Computer Aided Manufacturing Industry Revenue Share (%), by Deployment Model 2025 & 2033
- Figure 46: Middle East and Africa Computer Aided Manufacturing Industry Revenue (Million), by End-User Industry 2025 & 2033
- Figure 47: Middle East and Africa Computer Aided Manufacturing Industry Revenue Share (%), by End-User Industry 2025 & 2033
- Figure 48: Middle East and Africa Computer Aided Manufacturing Industry Revenue (Million), by Country 2025 & 2033
- Figure 49: Middle East and Africa Computer Aided Manufacturing Industry Revenue Share (%), by Country 2025 & 2033
List of Tables
- Table 1: Global Computer Aided Manufacturing Industry Revenue Million Forecast, by Region 2020 & 2033
- Table 2: Global Computer Aided Manufacturing Industry Revenue Million Forecast, by Deployment Model 2020 & 2033
- Table 3: Global Computer Aided Manufacturing Industry Revenue Million Forecast, by End-User Industry 2020 & 2033
- Table 4: Global Computer Aided Manufacturing Industry Revenue Million Forecast, by Region 2020 & 2033
- Table 5: Global Computer Aided Manufacturing Industry Revenue Million Forecast, by Country 2020 & 2033
- Table 6: United States Computer Aided Manufacturing Industry Revenue (Million) Forecast, by Application 2020 & 2033
- Table 7: Canada Computer Aided Manufacturing Industry Revenue (Million) Forecast, by Application 2020 & 2033
- Table 8: Mexico Computer Aided Manufacturing Industry Revenue (Million) Forecast, by Application 2020 & 2033
- Table 9: Global Computer Aided Manufacturing Industry Revenue Million Forecast, by Country 2020 & 2033
- Table 10: Germany Computer Aided Manufacturing Industry Revenue (Million) Forecast, by Application 2020 & 2033
- Table 11: United Kingdom Computer Aided Manufacturing Industry Revenue (Million) Forecast, by Application 2020 & 2033
- Table 12: France Computer Aided Manufacturing Industry Revenue (Million) Forecast, by Application 2020 & 2033
- Table 13: Spain Computer Aided Manufacturing Industry Revenue (Million) Forecast, by Application 2020 & 2033
- Table 14: Italy Computer Aided Manufacturing Industry Revenue (Million) Forecast, by Application 2020 & 2033
- Table 15: Spain Computer Aided Manufacturing Industry Revenue (Million) Forecast, by Application 2020 & 2033
- Table 16: Belgium Computer Aided Manufacturing Industry Revenue (Million) Forecast, by Application 2020 & 2033
- Table 17: Netherland Computer Aided Manufacturing Industry Revenue (Million) Forecast, by Application 2020 & 2033
- Table 18: Nordics Computer Aided Manufacturing Industry Revenue (Million) Forecast, by Application 2020 & 2033
- Table 19: Rest of Europe Computer Aided Manufacturing Industry Revenue (Million) Forecast, by Application 2020 & 2033
- Table 20: Global Computer Aided Manufacturing Industry Revenue Million Forecast, by Country 2020 & 2033
- Table 21: China Computer Aided Manufacturing Industry Revenue (Million) Forecast, by Application 2020 & 2033
- Table 22: Japan Computer Aided Manufacturing Industry Revenue (Million) Forecast, by Application 2020 & 2033
- Table 23: India Computer Aided Manufacturing Industry Revenue (Million) Forecast, by Application 2020 & 2033
- Table 24: South Korea Computer Aided Manufacturing Industry Revenue (Million) Forecast, by Application 2020 & 2033
- Table 25: Southeast Asia Computer Aided Manufacturing Industry Revenue (Million) Forecast, by Application 2020 & 2033
- Table 26: Australia Computer Aided Manufacturing Industry Revenue (Million) Forecast, by Application 2020 & 2033
- Table 27: Indonesia Computer Aided Manufacturing Industry Revenue (Million) Forecast, by Application 2020 & 2033
- Table 28: Phillipes Computer Aided Manufacturing Industry Revenue (Million) Forecast, by Application 2020 & 2033
- Table 29: Singapore Computer Aided Manufacturing Industry Revenue (Million) Forecast, by Application 2020 & 2033
- Table 30: Thailandc Computer Aided Manufacturing Industry Revenue (Million) Forecast, by Application 2020 & 2033
- Table 31: Rest of Asia Pacific Computer Aided Manufacturing Industry Revenue (Million) Forecast, by Application 2020 & 2033
- Table 32: Global Computer Aided Manufacturing Industry Revenue Million Forecast, by Country 2020 & 2033
- Table 33: Brazil Computer Aided Manufacturing Industry Revenue (Million) Forecast, by Application 2020 & 2033
- Table 34: Argentina Computer Aided Manufacturing Industry Revenue (Million) Forecast, by Application 2020 & 2033
- Table 35: Peru Computer Aided Manufacturing Industry Revenue (Million) Forecast, by Application 2020 & 2033
- Table 36: Chile Computer Aided Manufacturing Industry Revenue (Million) Forecast, by Application 2020 & 2033
- Table 37: Colombia Computer Aided Manufacturing Industry Revenue (Million) Forecast, by Application 2020 & 2033
- Table 38: Ecuador Computer Aided Manufacturing Industry Revenue (Million) Forecast, by Application 2020 & 2033
- Table 39: Venezuela Computer Aided Manufacturing Industry Revenue (Million) Forecast, by Application 2020 & 2033
- Table 40: Rest of South America Computer Aided Manufacturing Industry Revenue (Million) Forecast, by Application 2020 & 2033
- Table 41: Global Computer Aided Manufacturing Industry Revenue Million Forecast, by Country 2020 & 2033
- Table 42: United States Computer Aided Manufacturing Industry Revenue (Million) Forecast, by Application 2020 & 2033
- Table 43: Canada Computer Aided Manufacturing Industry Revenue (Million) Forecast, by Application 2020 & 2033
- Table 44: Mexico Computer Aided Manufacturing Industry Revenue (Million) Forecast, by Application 2020 & 2033
- Table 45: Global Computer Aided Manufacturing Industry Revenue Million Forecast, by Country 2020 & 2033
- Table 46: United Arab Emirates Computer Aided Manufacturing Industry Revenue (Million) Forecast, by Application 2020 & 2033
- Table 47: Saudi Arabia Computer Aided Manufacturing Industry Revenue (Million) Forecast, by Application 2020 & 2033
- Table 48: South Africa Computer Aided Manufacturing Industry Revenue (Million) Forecast, by Application 2020 & 2033
- Table 49: Rest of Middle East and Africa Computer Aided Manufacturing Industry Revenue (Million) Forecast, by Application 2020 & 2033
- Table 50: Global Computer Aided Manufacturing Industry Revenue Million Forecast, by Deployment Model 2020 & 2033
- Table 51: Global Computer Aided Manufacturing Industry Revenue Million Forecast, by End-User Industry 2020 & 2033
- Table 52: Global Computer Aided Manufacturing Industry Revenue Million Forecast, by Country 2020 & 2033
- Table 53: United States Computer Aided Manufacturing Industry Revenue (Million) Forecast, by Application 2020 & 2033
- Table 54: Canada Computer Aided Manufacturing Industry Revenue (Million) Forecast, by Application 2020 & 2033
- Table 55: Global Computer Aided Manufacturing Industry Revenue Million Forecast, by Deployment Model 2020 & 2033
- Table 56: Global Computer Aided Manufacturing Industry Revenue Million Forecast, by End-User Industry 2020 & 2033
- Table 57: Global Computer Aided Manufacturing Industry Revenue Million Forecast, by Country 2020 & 2033
- Table 58: Germany Computer Aided Manufacturing Industry Revenue (Million) Forecast, by Application 2020 & 2033
- Table 59: Switzerland Computer Aided Manufacturing Industry Revenue (Million) Forecast, by Application 2020 & 2033
- Table 60: Spain Computer Aided Manufacturing Industry Revenue (Million) Forecast, by Application 2020 & 2033
- Table 61: Austria Computer Aided Manufacturing Industry Revenue (Million) Forecast, by Application 2020 & 2033
- Table 62: Belgium Computer Aided Manufacturing Industry Revenue (Million) Forecast, by Application 2020 & 2033
- Table 63: Netherlands Computer Aided Manufacturing Industry Revenue (Million) Forecast, by Application 2020 & 2033
- Table 64: United Kingdom Computer Aided Manufacturing Industry Revenue (Million) Forecast, by Application 2020 & 2033
- Table 65: France Computer Aided Manufacturing Industry Revenue (Million) Forecast, by Application 2020 & 2033
- Table 66: Italy Computer Aided Manufacturing Industry Revenue (Million) Forecast, by Application 2020 & 2033
- Table 67: Sweden Computer Aided Manufacturing Industry Revenue (Million) Forecast, by Application 2020 & 2033
- Table 68: Poland Computer Aided Manufacturing Industry Revenue (Million) Forecast, by Application 2020 & 2033
- Table 69: Global Computer Aided Manufacturing Industry Revenue Million Forecast, by Deployment Model 2020 & 2033
- Table 70: Global Computer Aided Manufacturing Industry Revenue Million Forecast, by End-User Industry 2020 & 2033
- Table 71: Global Computer Aided Manufacturing Industry Revenue Million Forecast, by Country 2020 & 2033
- Table 72: China Computer Aided Manufacturing Industry Revenue (Million) Forecast, by Application 2020 & 2033
- Table 73: Japan Computer Aided Manufacturing Industry Revenue (Million) Forecast, by Application 2020 & 2033
- Table 74: South Korea Computer Aided Manufacturing Industry Revenue (Million) Forecast, by Application 2020 & 2033
- Table 75: India Computer Aided Manufacturing Industry Revenue (Million) Forecast, by Application 2020 & 2033
- Table 76: Global Computer Aided Manufacturing Industry Revenue Million Forecast, by Deployment Model 2020 & 2033
- Table 77: Global Computer Aided Manufacturing Industry Revenue Million Forecast, by End-User Industry 2020 & 2033
- Table 78: Global Computer Aided Manufacturing Industry Revenue Million Forecast, by Country 2020 & 2033
- Table 79: Global Computer Aided Manufacturing Industry Revenue Million Forecast, by Deployment Model 2020 & 2033
- Table 80: Global Computer Aided Manufacturing Industry Revenue Million Forecast, by End-User Industry 2020 & 2033
- Table 81: Global Computer Aided Manufacturing Industry Revenue Million Forecast, by Country 2020 & 2033
- Table 82: Brazil Computer Aided Manufacturing Industry Revenue (Million) Forecast, by Application 2020 & 2033
- Table 83: Mexico Computer Aided Manufacturing Industry Revenue (Million) Forecast, by Application 2020 & 2033
- Table 84: Global Computer Aided Manufacturing Industry Revenue Million Forecast, by Deployment Model 2020 & 2033
- Table 85: Global Computer Aided Manufacturing Industry Revenue Million Forecast, by End-User Industry 2020 & 2033
- Table 86: Global Computer Aided Manufacturing Industry Revenue Million Forecast, by Country 2020 & 2033
- Table 87: United Arab Emirates Computer Aided Manufacturing Industry Revenue (Million) Forecast, by Application 2020 & 2033
- Table 88: Saudi Arabia Computer Aided Manufacturing Industry Revenue (Million) Forecast, by Application 2020 & 2033
- Table 89: South Africa Computer Aided Manufacturing Industry Revenue (Million) Forecast, by Application 2020 & 2033
Frequently Asked Questions
1. What is the projected Compound Annual Growth Rate (CAGR) of the Computer Aided Manufacturing Industry?
The projected CAGR is approximately 8.13%.
2. Which companies are prominent players in the Computer Aided Manufacturing Industry?
Key companies in the market include Dassault Systems, PTC, MecSoft Corporation, Hexagon AB, NTT DATA Corporation, Siemens AG, SolidCAM Ltd, OPEN MIND Technologies AG, Autodesk Inc, 3D Systems Inc, BobCAD-CAM, SmartCAMcnc , ZWSOFTCO LTD (Guangzhou), HCL Technologies Limited, CNC Software LLC (Mastercam).
3. What are the main segments of the Computer Aided Manufacturing Industry?
The market segments include Deployment Model, End-User Industry.
4. Can you provide details about the market size?
The market size is estimated to be USD 3.94 Million as of 2022.
5. What are some drivers contributing to market growth?
Increasing Adoption of Industry 4.; Growing Utilization of CAM Software in the Packaging Machinery Sector.
6. What are the notable trends driving market growth?
Automotive is Expected to Hold a Major Market Share.
7. Are there any restraints impacting market growth?
Wide Availability of Open Source CAM Software.
8. Can you provide examples of recent developments in the market?
November 2023 - Microlight3D launched Luminis software, a computer-aided manufacturing (CAM) software built explicitly for the microFAB-3D. Luminis combines the ability to prepare objects for printing and control the printer, aiding to 3D print objects to 100× smaller than a strand of hair. Luminis features 3D visualization for the capturing of 40 fps - 60 fps data under the same load. The software enables printing prototypes of technologies used in micro-robotics, microfluidics, micro-optics, and cell culture and tissue engineering.
9. What pricing options are available for accessing the report?
Pricing options include single-user, multi-user, and enterprise licenses priced at USD 4750, USD 5250, and USD 8750 respectively.
10. Is the market size provided in terms of value or volume?
The market size is provided in terms of value, measured in Million.
11. Are there any specific market keywords associated with the report?
Yes, the market keyword associated with the report is "Computer Aided Manufacturing Industry," which aids in identifying and referencing the specific market segment covered.
12. How do I determine which pricing option suits my needs best?
The pricing options vary based on user requirements and access needs. Individual users may opt for single-user licenses, while businesses requiring broader access may choose multi-user or enterprise licenses for cost-effective access to the report.
13. Are there any additional resources or data provided in the Computer Aided Manufacturing Industry report?
While the report offers comprehensive insights, it's advisable to review the specific contents or supplementary materials provided to ascertain if additional resources or data are available.
14. How can I stay updated on further developments or reports in the Computer Aided Manufacturing Industry?
To stay informed about further developments, trends, and reports in the Computer Aided Manufacturing Industry, consider subscribing to industry newsletters, following relevant companies and organizations, or regularly checking reputable industry news sources and publications.
Methodology
Step 1 - Identification of Relevant Samples Size from Population Database


Step 2 - Approaches for Defining Global Market Size (Value, Volume* & Price*)

Note*: In applicable scenarios
Step 3 - Data Sources
Primary Research
- Web Analytics
- Survey Reports
- Research Institute
- Latest Research Reports
- Opinion Leaders
Secondary Research
- Annual Reports
- White Paper
- Latest Press Release
- Industry Association
- Paid Database
- Investor Presentations

Step 4 - Data Triangulation
Involves using different sources of information in order to increase the validity of a study
These sources are likely to be stakeholders in a program - participants, other researchers, program staff, other community members, and so on.
Then we put all data in single framework & apply various statistical tools to find out the dynamic on the market.
During the analysis stage, feedback from the stakeholder groups would be compared to determine areas of agreement as well as areas of divergence
