

Key Insights
The online travel sector demonstrates strong expansion, propelled by increasing global internet and smartphone adoption and a growing preference for efficient, cost-effective booking solutions. The market, estimated at $622.6 billion in 2025, is projected to grow at a compound annual growth rate (CAGR) of 9.75% through 2033. Key growth catalysts include the expansion of low-cost carriers, the widespread availability of travel comparison and review platforms, and the increasing adoption of mobile booking applications. Emerging trends such as sustainable travel, personalized itineraries, and AI-powered travel planning are set to redefine the industry's future. While economic fluctuations and geopolitical instability pose potential challenges, the long-term outlook for global travel and tourism remains positive.
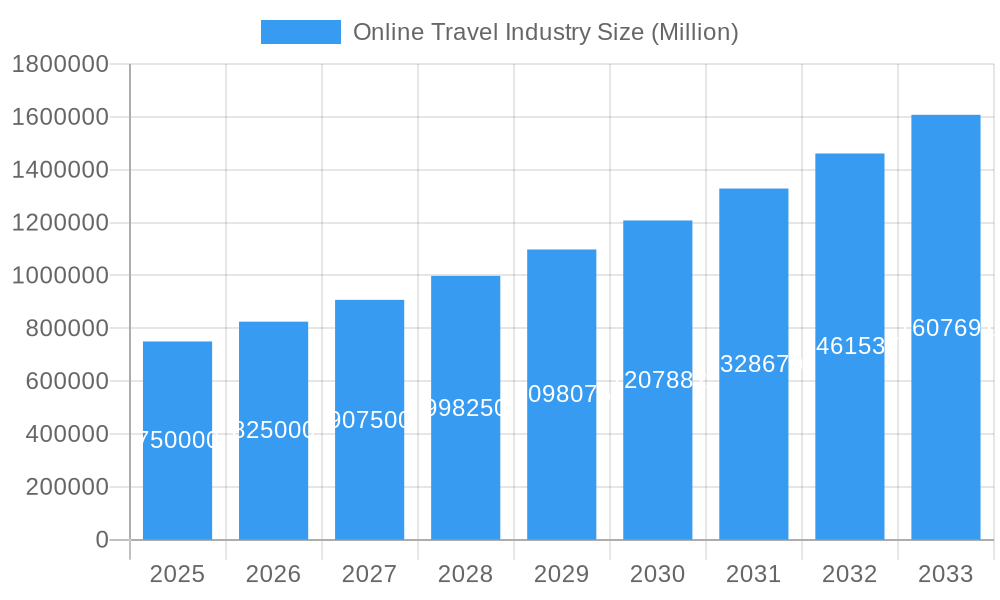
Online Travel Industry Market Size (In Billion)
The industry is segmented by platform (mobile applications, websites) and booking channel (third-party online travel agencies (OTAs), direct/captive portals). Mobile applications are rapidly increasing their market share due to their intuitive user experience and accessibility. Leading OTAs such as Booking Holdings, Expedia Group, and Trip.com, alongside specialized providers like Airbnb and Agoda, currently dominate the market, though direct bookings via airline and hotel websites are also on the rise. Significant market share is held by North America and Europe, with the Asia-Pacific region, especially China and India, presenting the most substantial growth opportunities. The competitive environment is intense, characterized by continuous innovation from established players and the emergence of new market entrants, fostering a dynamic and evolving landscape. Detailed regional analysis across North America, Europe, Asia-Pacific, South America, and the Middle East & Africa highlights the global scope and varied opportunities within the online travel market.
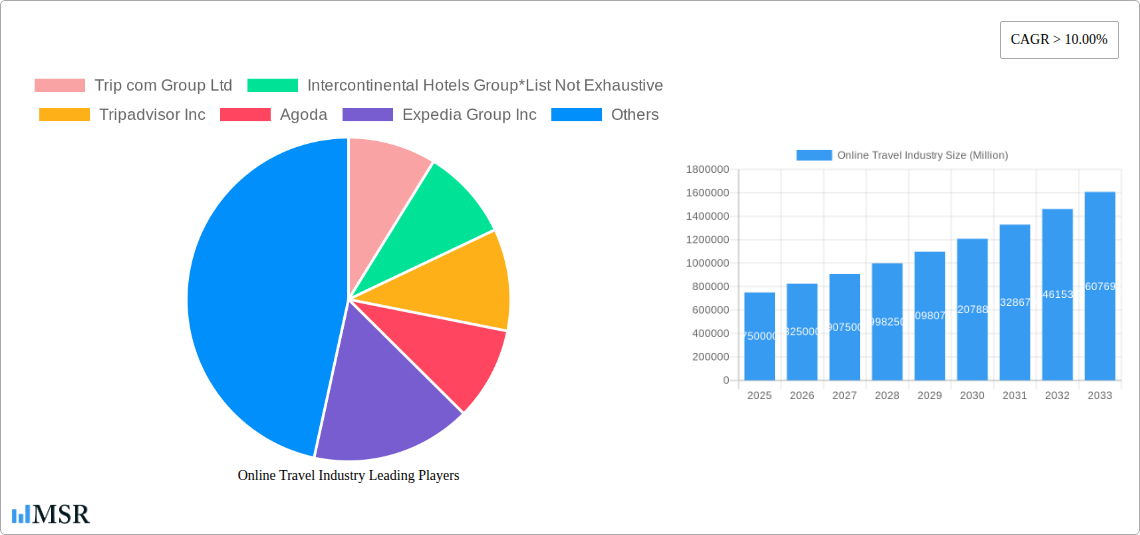
Online Travel Industry Company Market Share
Online Travel Industry Market Report: 2019-2033
This comprehensive report provides an in-depth analysis of the online travel industry, projecting a market valued at $XX Million by 2033. The study covers the historical period (2019-2024), the base year (2025), and forecasts until 2033, offering invaluable insights for investors, businesses, and industry stakeholders. Key players like Booking Holdings Inc, Expedia Group Inc, and Tripadvisor Inc. are analyzed alongside emerging players, highlighting market dynamics and future growth trajectories.
Online Travel Industry Market Concentration & Dynamics
The online travel industry exhibits a high degree of concentration, with a few major players holding significant market share. In 2025, Booking Holdings Inc. is estimated to command approximately XX% market share, followed by Expedia Group Inc. at XX%, and Tripadvisor Inc. at XX%. This concentration is influenced by significant economies of scale and high barriers to entry. The industry's dynamic landscape is characterized by frequent mergers and acquisitions (M&A) activities. Between 2019 and 2024, over XX M&A deals were recorded, with a notable increase in cross-border acquisitions driven by expansion strategies. Innovation ecosystems are flourishing, particularly around personalized travel experiences enabled by AI and Big Data. However, regulatory frameworks, particularly concerning data privacy and consumer protection, continue to evolve, impacting business strategies. Substitute products, like independent travel booking services and peer-to-peer accommodation platforms (e.g., Airbnb), present considerable competitive pressure. Evolving consumer preferences, emphasizing sustainability and unique experiences, further shape the industry's dynamic environment.
- Market Share (2025, Estimated): Booking Holdings Inc (XX%), Expedia Group Inc (XX%), Tripadvisor Inc (XX%)
- M&A Deal Count (2019-2024): XX
- Key Industry Trends: Increased focus on personalization, growing adoption of mobile booking, rise of sustainable travel options.
Online Travel Industry Industry Insights & Trends
The global online travel market exhibited robust growth between 2019 and 2024, reaching an estimated value of $XX Million in 2025. This growth is primarily driven by increasing internet and smartphone penetration, especially in emerging markets. The market is expected to continue its expansion at a Compound Annual Growth Rate (CAGR) of XX% during the forecast period (2025-2033), reaching a projected value of $XX Million by 2033. Technological disruptions, such as the increasing use of AI-powered chatbots for customer service and dynamic pricing algorithms, are reshaping the industry. Changing consumer behaviors, with a growing preference for personalized travel experiences and seamless booking processes, are creating new opportunities and challenges. The COVID-19 pandemic significantly impacted the industry but revealed resilience and adaptability, with the shift to contactless bookings and the increase in domestic travel further shaping the market. The rise of social commerce and the influence of online travel reviews are increasingly significant factors.
Key Markets & Segments Leading Online Travel Industry
The Asia-Pacific region dominates the online travel market, driven by strong economic growth, rising disposable incomes, and increasing tourism. Within this region, China and India are key markets, exhibiting high growth potential due to expanding middle classes and robust infrastructure development. The mobile application segment displays exceptional growth, accounting for an estimated XX% of bookings in 2025. This dominance is driven by the convenience and accessibility offered by mobile platforms. While third-party online travel portals still dominate the booking mode, direct/captive portals are witnessing accelerated growth, fueled by brands leveraging loyalty programs and personalized offers.
- Dominant Region: Asia-Pacific
- Key Market Drivers:
- Rapid economic growth in emerging markets
- Increased smartphone penetration
- Growing middle class with higher disposable incomes
- Improved transportation infrastructure
- Dominant Platform: Mobile Applications
- Dominant Booking Mode: Third-party online portals (gradually shifting towards direct/captive portals)
Online Travel Industry Product Developments
Recent product innovations focus on enhanced personalization, leveraging AI and machine learning to tailor travel recommendations and offers. The integration of augmented reality (AR) and virtual reality (VR) technologies offers immersive travel planning experiences. Several platforms are also incorporating sustainable travel options and carbon offsetting programs, catering to environmentally conscious travelers. These advancements provide a competitive edge by enhancing customer experience and offering unique value propositions.
Challenges in the Online Travel Industry Market
The industry faces challenges including increased competition, volatile fuel prices impacting airfare costs, and stringent regulatory compliance requirements. Supply chain disruptions, such as airline cancellations or hotel shortages, can significantly impact operational efficiency. Furthermore, security concerns regarding data breaches and fraudulent activities necessitate significant investments in cybersecurity.
Forces Driving Online Travel Industry Growth
Several factors drive the industry's growth: the rapid expansion of the middle class in developing economies, increasing smartphone adoption, and the rising popularity of online travel reviews and social media influence. Technological advancements, particularly in AI and data analytics, are enabling better personalization and more efficient operations. Favorable government policies promoting tourism also contribute to growth.
Challenges in the Online Travel Industry Market
Long-term growth depends on strategic partnerships, technological innovation, and expansion into new markets. Adapting to evolving consumer preferences, particularly sustainability and authenticity, will be crucial. Further investments in AI, VR, and AR technologies will also shape future growth.
Emerging Opportunities in Online Travel Industry
Emerging opportunities lie in niche markets like sustainable tourism and experiential travel. The integration of blockchain technology for secure transactions and the adoption of voice-search optimization present new avenues for growth. Expansion into underserved markets and the development of personalized travel itineraries using AI-driven recommendation engines are also key opportunities.
Leading Players in the Online Travel Industry Sector
- Trip.com Group Ltd
- Intercontinental Hotels Group
- Tripadvisor Inc
- Agoda
- Expedia Group Inc
- Traveloka Indonesia PT
- HRS GmbH
- Oravel Stays Pvt Ltd
- Airbnb Inc
- Hostelworld Group
- Hotelbeds Group SL
- Booking Holdings Inc
Key Milestones in Online Travel Industry Industry
- 2020: The COVID-19 pandemic significantly impacted the industry, leading to widespread travel restrictions and a sharp decline in bookings.
- 2021: The industry began to recover as vaccination rates increased and travel restrictions eased.
- 2022: A surge in revenge travel was observed, and the industry saw significant growth compared to the previous year.
- 2023: Continued growth with a focus on personalized experiences and sustainable travel options. Several mergers and acquisitions reshaped the competitive landscape.
Strategic Outlook for Online Travel Industry Market
The online travel industry's future is promising, driven by technological innovation, evolving consumer preferences, and the expansion of the middle class globally. Strategic opportunities exist in capitalizing on personalized travel experiences, integrating sustainable practices, and expanding into new and emerging markets. Companies that can adapt quickly to changing market conditions and leverage technology effectively are well-positioned for success.
Online Travel Industry Segmentation
-
1. Platform
- 1.1. Mobile Application
- 1.2. Website
-
2. Mode of Booking
- 2.1. Third party online portals
- 2.2. Direct / captive portals
Online Travel Industry Segmentation By Geography
-
1. North America
- 1.1. United States
- 1.2. Canada
- 1.3. Mexico
-
2. South America
- 2.1. Brazil
- 2.2. Argentina
- 2.3. Rest of South America
-
3. Europe
- 3.1. United Kingdom
- 3.2. Germany
- 3.3. France
- 3.4. Italy
- 3.5. Spain
- 3.6. Russia
- 3.7. Benelux
- 3.8. Nordics
- 3.9. Rest of Europe
-
4. Middle East & Africa
- 4.1. Turkey
- 4.2. Israel
- 4.3. GCC
- 4.4. North Africa
- 4.5. South Africa
- 4.6. Rest of Middle East & Africa
-
5. Asia Pacific
- 5.1. China
- 5.2. India
- 5.3. Japan
- 5.4. South Korea
- 5.5. ASEAN
- 5.6. Oceania
- 5.7. Rest of Asia Pacific
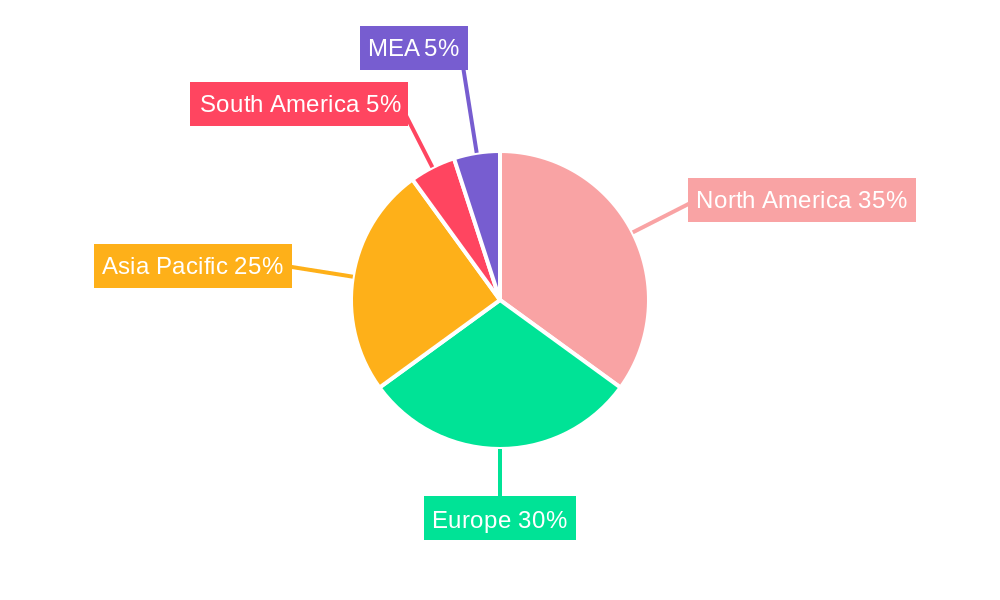
Online Travel Industry Regional Market Share
Geographic Coverage of Online Travel Industry
Online Travel Industry REPORT HIGHLIGHTS
| Aspects | Details |
|---|---|
| Study Period | 2020-2034 |
| Base Year | 2025 |
| Estimated Year | 2026 |
| Forecast Period | 2026-2034 |
| Historical Period | 2020-2025 |
| Growth Rate | CAGR of 9.75% from 2020-2034 |
| Segmentation |
|
Table of Contents
- 1. Introduction
- 1.1. Research Scope
- 1.2. Market Segmentation
- 1.3. Research Objective
- 1.4. Definitions and Assumptions
- 2. Executive Summary
- 2.1. Market Snapshot
- 3. Market Dynamics
- 3.1. Market Drivers
- 3.2. Market Restrains
- 3.3. Market Trends
- 3.4. Market Opportunities
- 4. Market Factor Analysis
- 4.1. Porters Five Forces
- 4.1.1. Bargaining Power of Suppliers
- 4.1.2. Bargaining Power of Buyers
- 4.1.3. Threat of New Entrants
- 4.1.4. Threat of Substitutes
- 4.1.5. Competitive Rivalry
- 4.2. PESTEL analysis
- 4.3. BCG Analysis
- 4.3.1. Stars (High Growth, High Market Share)
- 4.3.2. Cash Cows (Low Growth, High Market Share)
- 4.3.3. Question Mark (High Growth, Low Market Share)
- 4.3.4. Dogs (Low Growth, Low Market Share)
- 4.4. Ansoff Matrix Analysis
- 4.5. Supply Chain Analysis
- 4.6. Regulatory Landscape
- 4.7. Current Market Potential and Opportunity Assessment (TAM–SAM–SOM Framework)
- 4.8. MSR Analyst Note
- 4.1. Porters Five Forces
- 5. Market Analysis, Insights and Forecast 2021-2033
- 5.1. Market Analysis, Insights and Forecast - by Platform
- 5.1.1. Mobile Application
- 5.1.2. Website
- 5.2. Market Analysis, Insights and Forecast - by Mode of Booking
- 5.2.1. Third party online portals
- 5.2.2. Direct / captive portals
- 5.3. Market Analysis, Insights and Forecast - by Region
- 5.3.1. North America
- 5.3.2. South America
- 5.3.3. Europe
- 5.3.4. Middle East & Africa
- 5.3.5. Asia Pacific
- 5.1. Market Analysis, Insights and Forecast - by Platform
- 6. Global Online Travel Industry Analysis, Insights and Forecast, 2021-2033
- 6.1. Market Analysis, Insights and Forecast - by Platform
- 6.1.1. Mobile Application
- 6.1.2. Website
- 6.2. Market Analysis, Insights and Forecast - by Mode of Booking
- 6.2.1. Third party online portals
- 6.2.2. Direct / captive portals
- 6.1. Market Analysis, Insights and Forecast - by Platform
- 7. North America Online Travel Industry Analysis, Insights and Forecast, 2020-2032
- 7.1. Market Analysis, Insights and Forecast - by Platform
- 7.1.1. Mobile Application
- 7.1.2. Website
- 7.2. Market Analysis, Insights and Forecast - by Mode of Booking
- 7.2.1. Third party online portals
- 7.2.2. Direct / captive portals
- 7.1. Market Analysis, Insights and Forecast - by Platform
- 8. South America Online Travel Industry Analysis, Insights and Forecast, 2020-2032
- 8.1. Market Analysis, Insights and Forecast - by Platform
- 8.1.1. Mobile Application
- 8.1.2. Website
- 8.2. Market Analysis, Insights and Forecast - by Mode of Booking
- 8.2.1. Third party online portals
- 8.2.2. Direct / captive portals
- 8.1. Market Analysis, Insights and Forecast - by Platform
- 9. Europe Online Travel Industry Analysis, Insights and Forecast, 2020-2032
- 9.1. Market Analysis, Insights and Forecast - by Platform
- 9.1.1. Mobile Application
- 9.1.2. Website
- 9.2. Market Analysis, Insights and Forecast - by Mode of Booking
- 9.2.1. Third party online portals
- 9.2.2. Direct / captive portals
- 9.1. Market Analysis, Insights and Forecast - by Platform
- 10. Middle East & Africa Online Travel Industry Analysis, Insights and Forecast, 2020-2032
- 10.1. Market Analysis, Insights and Forecast - by Platform
- 10.1.1. Mobile Application
- 10.1.2. Website
- 10.2. Market Analysis, Insights and Forecast - by Mode of Booking
- 10.2.1. Third party online portals
- 10.2.2. Direct / captive portals
- 10.1. Market Analysis, Insights and Forecast - by Platform
- 11. Asia Pacific Online Travel Industry Analysis, Insights and Forecast, 2020-2032
- 11.1. Market Analysis, Insights and Forecast - by Platform
- 11.1.1. Mobile Application
- 11.1.2. Website
- 11.2. Market Analysis, Insights and Forecast - by Mode of Booking
- 11.2.1. Third party online portals
- 11.2.2. Direct / captive portals
- 11.1. Market Analysis, Insights and Forecast - by Platform
- 12. Competitive Analysis
- 12.1. Company Profiles
- 12.1.1 Trip com Group Ltd
- 12.1.1.1. Company Overview
- 12.1.1.2. Products
- 12.1.1.3. Company Financials
- 12.1.1.4. SWOT Analysis
- 12.1.2 Intercontinental Hotels Group*List Not Exhaustive
- 12.1.2.1. Company Overview
- 12.1.2.2. Products
- 12.1.2.3. Company Financials
- 12.1.2.4. SWOT Analysis
- 12.1.3 Tripadvisor Inc
- 12.1.3.1. Company Overview
- 12.1.3.2. Products
- 12.1.3.3. Company Financials
- 12.1.3.4. SWOT Analysis
- 12.1.4 Agoda
- 12.1.4.1. Company Overview
- 12.1.4.2. Products
- 12.1.4.3. Company Financials
- 12.1.4.4. SWOT Analysis
- 12.1.5 Expedia Group Inc
- 12.1.5.1. Company Overview
- 12.1.5.2. Products
- 12.1.5.3. Company Financials
- 12.1.5.4. SWOT Analysis
- 12.1.6 Traveloka Indonesia PT
- 12.1.6.1. Company Overview
- 12.1.6.2. Products
- 12.1.6.3. Company Financials
- 12.1.6.4. SWOT Analysis
- 12.1.7 HRS GmbH
- 12.1.7.1. Company Overview
- 12.1.7.2. Products
- 12.1.7.3. Company Financials
- 12.1.7.4. SWOT Analysis
- 12.1.8 Oravel Stays Pvt Ltd
- 12.1.8.1. Company Overview
- 12.1.8.2. Products
- 12.1.8.3. Company Financials
- 12.1.8.4. SWOT Analysis
- 12.1.9 Airbnb Inc
- 12.1.9.1. Company Overview
- 12.1.9.2. Products
- 12.1.9.3. Company Financials
- 12.1.9.4. SWOT Analysis
- 12.1.10 Hostelworld Group
- 12.1.10.1. Company Overview
- 12.1.10.2. Products
- 12.1.10.3. Company Financials
- 12.1.10.4. SWOT Analysis
- 12.1.11 Hotelbeds Group SL
- 12.1.11.1. Company Overview
- 12.1.11.2. Products
- 12.1.11.3. Company Financials
- 12.1.11.4. SWOT Analysis
- 12.1.12 Booking Holdings Inc
- 12.1.12.1. Company Overview
- 12.1.12.2. Products
- 12.1.12.3. Company Financials
- 12.1.12.4. SWOT Analysis
- 12.1.1 Trip com Group Ltd
- 12.2. Market Entropy
- 12.2.1 Company's Key Areas Served
- 12.2.2 Recent Developments
- 12.3. Company Market Share Analysis 2025
- 12.3.1 Top 5 Companies Market Share Analysis
- 12.3.2 Top 3 Companies Market Share Analysis
- 12.4. List of Potential Customers
- 13. Research Methodology
List of Figures
- Figure 1: Global Online Travel Industry Revenue Breakdown (billion, %) by Region 2025 & 2033
- Figure 2: North America Online Travel Industry Revenue (billion), by Platform 2025 & 2033
- Figure 3: North America Online Travel Industry Revenue Share (%), by Platform 2025 & 2033
- Figure 4: North America Online Travel Industry Revenue (billion), by Mode of Booking 2025 & 2033
- Figure 5: North America Online Travel Industry Revenue Share (%), by Mode of Booking 2025 & 2033
- Figure 6: North America Online Travel Industry Revenue (billion), by Country 2025 & 2033
- Figure 7: North America Online Travel Industry Revenue Share (%), by Country 2025 & 2033
- Figure 8: South America Online Travel Industry Revenue (billion), by Platform 2025 & 2033
- Figure 9: South America Online Travel Industry Revenue Share (%), by Platform 2025 & 2033
- Figure 10: South America Online Travel Industry Revenue (billion), by Mode of Booking 2025 & 2033
- Figure 11: South America Online Travel Industry Revenue Share (%), by Mode of Booking 2025 & 2033
- Figure 12: South America Online Travel Industry Revenue (billion), by Country 2025 & 2033
- Figure 13: South America Online Travel Industry Revenue Share (%), by Country 2025 & 2033
- Figure 14: Europe Online Travel Industry Revenue (billion), by Platform 2025 & 2033
- Figure 15: Europe Online Travel Industry Revenue Share (%), by Platform 2025 & 2033
- Figure 16: Europe Online Travel Industry Revenue (billion), by Mode of Booking 2025 & 2033
- Figure 17: Europe Online Travel Industry Revenue Share (%), by Mode of Booking 2025 & 2033
- Figure 18: Europe Online Travel Industry Revenue (billion), by Country 2025 & 2033
- Figure 19: Europe Online Travel Industry Revenue Share (%), by Country 2025 & 2033
- Figure 20: Middle East & Africa Online Travel Industry Revenue (billion), by Platform 2025 & 2033
- Figure 21: Middle East & Africa Online Travel Industry Revenue Share (%), by Platform 2025 & 2033
- Figure 22: Middle East & Africa Online Travel Industry Revenue (billion), by Mode of Booking 2025 & 2033
- Figure 23: Middle East & Africa Online Travel Industry Revenue Share (%), by Mode of Booking 2025 & 2033
- Figure 24: Middle East & Africa Online Travel Industry Revenue (billion), by Country 2025 & 2033
- Figure 25: Middle East & Africa Online Travel Industry Revenue Share (%), by Country 2025 & 2033
- Figure 26: Asia Pacific Online Travel Industry Revenue (billion), by Platform 2025 & 2033
- Figure 27: Asia Pacific Online Travel Industry Revenue Share (%), by Platform 2025 & 2033
- Figure 28: Asia Pacific Online Travel Industry Revenue (billion), by Mode of Booking 2025 & 2033
- Figure 29: Asia Pacific Online Travel Industry Revenue Share (%), by Mode of Booking 2025 & 2033
- Figure 30: Asia Pacific Online Travel Industry Revenue (billion), by Country 2025 & 2033
- Figure 31: Asia Pacific Online Travel Industry Revenue Share (%), by Country 2025 & 2033
List of Tables
- Table 1: Global Online Travel Industry Revenue billion Forecast, by Platform 2020 & 2033
- Table 2: Global Online Travel Industry Revenue billion Forecast, by Mode of Booking 2020 & 2033
- Table 3: Global Online Travel Industry Revenue billion Forecast, by Region 2020 & 2033
- Table 4: Global Online Travel Industry Revenue billion Forecast, by Platform 2020 & 2033
- Table 5: Global Online Travel Industry Revenue billion Forecast, by Mode of Booking 2020 & 2033
- Table 6: Global Online Travel Industry Revenue billion Forecast, by Country 2020 & 2033
- Table 7: United States Online Travel Industry Revenue (billion) Forecast, by Application 2020 & 2033
- Table 8: Canada Online Travel Industry Revenue (billion) Forecast, by Application 2020 & 2033
- Table 9: Mexico Online Travel Industry Revenue (billion) Forecast, by Application 2020 & 2033
- Table 10: Global Online Travel Industry Revenue billion Forecast, by Platform 2020 & 2033
- Table 11: Global Online Travel Industry Revenue billion Forecast, by Mode of Booking 2020 & 2033
- Table 12: Global Online Travel Industry Revenue billion Forecast, by Country 2020 & 2033
- Table 13: Brazil Online Travel Industry Revenue (billion) Forecast, by Application 2020 & 2033
- Table 14: Argentina Online Travel Industry Revenue (billion) Forecast, by Application 2020 & 2033
- Table 15: Rest of South America Online Travel Industry Revenue (billion) Forecast, by Application 2020 & 2033
- Table 16: Global Online Travel Industry Revenue billion Forecast, by Platform 2020 & 2033
- Table 17: Global Online Travel Industry Revenue billion Forecast, by Mode of Booking 2020 & 2033
- Table 18: Global Online Travel Industry Revenue billion Forecast, by Country 2020 & 2033
- Table 19: United Kingdom Online Travel Industry Revenue (billion) Forecast, by Application 2020 & 2033
- Table 20: Germany Online Travel Industry Revenue (billion) Forecast, by Application 2020 & 2033
- Table 21: France Online Travel Industry Revenue (billion) Forecast, by Application 2020 & 2033
- Table 22: Italy Online Travel Industry Revenue (billion) Forecast, by Application 2020 & 2033
- Table 23: Spain Online Travel Industry Revenue (billion) Forecast, by Application 2020 & 2033
- Table 24: Russia Online Travel Industry Revenue (billion) Forecast, by Application 2020 & 2033
- Table 25: Benelux Online Travel Industry Revenue (billion) Forecast, by Application 2020 & 2033
- Table 26: Nordics Online Travel Industry Revenue (billion) Forecast, by Application 2020 & 2033
- Table 27: Rest of Europe Online Travel Industry Revenue (billion) Forecast, by Application 2020 & 2033
- Table 28: Global Online Travel Industry Revenue billion Forecast, by Platform 2020 & 2033
- Table 29: Global Online Travel Industry Revenue billion Forecast, by Mode of Booking 2020 & 2033
- Table 30: Global Online Travel Industry Revenue billion Forecast, by Country 2020 & 2033
- Table 31: Turkey Online Travel Industry Revenue (billion) Forecast, by Application 2020 & 2033
- Table 32: Israel Online Travel Industry Revenue (billion) Forecast, by Application 2020 & 2033
- Table 33: GCC Online Travel Industry Revenue (billion) Forecast, by Application 2020 & 2033
- Table 34: North Africa Online Travel Industry Revenue (billion) Forecast, by Application 2020 & 2033
- Table 35: South Africa Online Travel Industry Revenue (billion) Forecast, by Application 2020 & 2033
- Table 36: Rest of Middle East & Africa Online Travel Industry Revenue (billion) Forecast, by Application 2020 & 2033
- Table 37: Global Online Travel Industry Revenue billion Forecast, by Platform 2020 & 2033
- Table 38: Global Online Travel Industry Revenue billion Forecast, by Mode of Booking 2020 & 2033
- Table 39: Global Online Travel Industry Revenue billion Forecast, by Country 2020 & 2033
- Table 40: China Online Travel Industry Revenue (billion) Forecast, by Application 2020 & 2033
- Table 41: India Online Travel Industry Revenue (billion) Forecast, by Application 2020 & 2033
- Table 42: Japan Online Travel Industry Revenue (billion) Forecast, by Application 2020 & 2033
- Table 43: South Korea Online Travel Industry Revenue (billion) Forecast, by Application 2020 & 2033
- Table 44: ASEAN Online Travel Industry Revenue (billion) Forecast, by Application 2020 & 2033
- Table 45: Oceania Online Travel Industry Revenue (billion) Forecast, by Application 2020 & 2033
- Table 46: Rest of Asia Pacific Online Travel Industry Revenue (billion) Forecast, by Application 2020 & 2033
Frequently Asked Questions
1. What is the projected Compound Annual Growth Rate (CAGR) of the Online Travel Industry?
The projected CAGR is approximately 9.75%.
2. Which companies are prominent players in the Online Travel Industry?
Key companies in the market include Trip com Group Ltd, Intercontinental Hotels Group*List Not Exhaustive, Tripadvisor Inc, Agoda, Expedia Group Inc, Traveloka Indonesia PT, HRS GmbH, Oravel Stays Pvt Ltd, Airbnb Inc, Hostelworld Group, Hotelbeds Group SL, Booking Holdings Inc.
3. What are the main segments of the Online Travel Industry?
The market segments include Platform, Mode of Booking.
4. Can you provide details about the market size?
The market size is estimated to be USD 622.6 billion as of 2022.
5. What are some drivers contributing to market growth?
Increase in Domestic Travel Driving the Market; Growing Tourist Footfall Driving the Market.
6. What are the notable trends driving market growth?
Increasing Internet Penetration has Huge Impact on the Market.
7. Are there any restraints impacting market growth?
Restrictions on Purchases of Number of Products; Customs Regulations and Taxation Policies.
8. Can you provide examples of recent developments in the market?
N/A
9. What pricing options are available for accessing the report?
Pricing options include single-user, multi-user, and enterprise licenses priced at USD 3800, USD 4500, and USD 5800 respectively.
10. Is the market size provided in terms of value or volume?
The market size is provided in terms of value, measured in billion.
11. Are there any specific market keywords associated with the report?
Yes, the market keyword associated with the report is "Online Travel Industry," which aids in identifying and referencing the specific market segment covered.
12. How do I determine which pricing option suits my needs best?
The pricing options vary based on user requirements and access needs. Individual users may opt for single-user licenses, while businesses requiring broader access may choose multi-user or enterprise licenses for cost-effective access to the report.
13. Are there any additional resources or data provided in the Online Travel Industry report?
While the report offers comprehensive insights, it's advisable to review the specific contents or supplementary materials provided to ascertain if additional resources or data are available.
14. How can I stay updated on further developments or reports in the Online Travel Industry?
To stay informed about further developments, trends, and reports in the Online Travel Industry, consider subscribing to industry newsletters, following relevant companies and organizations, or regularly checking reputable industry news sources and publications.
Methodology
Step 1 - Identification of Relevant Samples Size from Population Database


Step 2 - Approaches for Defining Global Market Size (Value, Volume* & Price*)

Note*: In applicable scenarios
Step 3 - Data Sources
Primary Research
- Web Analytics
- Survey Reports
- Research Institute
- Latest Research Reports
- Opinion Leaders
Secondary Research
- Annual Reports
- White Paper
- Latest Press Release
- Industry Association
- Paid Database
- Investor Presentations

Step 4 - Data Triangulation
Involves using different sources of information in order to increase the validity of a study
These sources are likely to be stakeholders in a program - participants, other researchers, program staff, other community members, and so on.
Then we put all data in single framework & apply various statistical tools to find out the dynamic on the market.
During the analysis stage, feedback from the stakeholder groups would be compared to determine areas of agreement as well as areas of divergence