

Key Insights
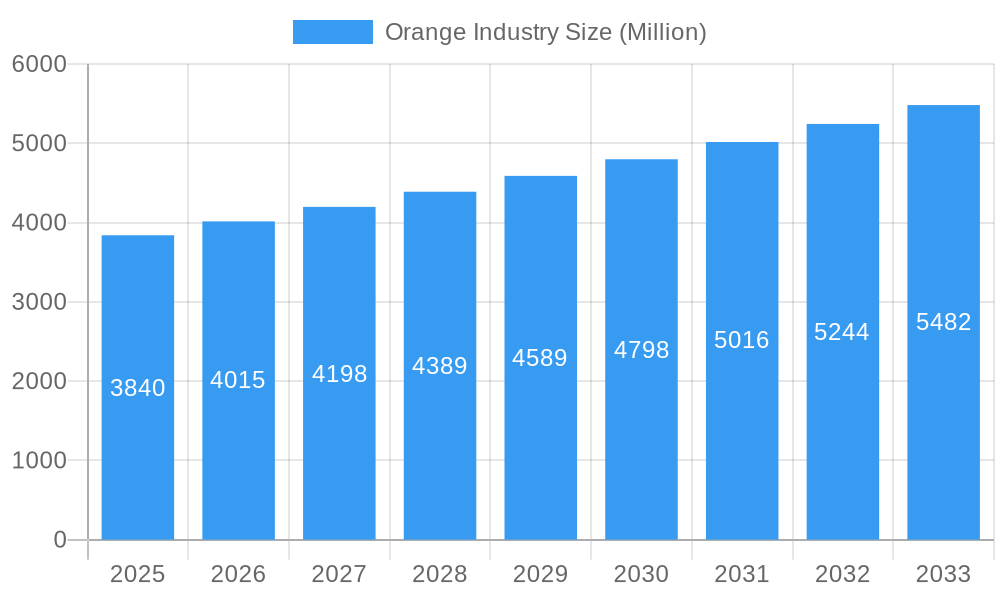
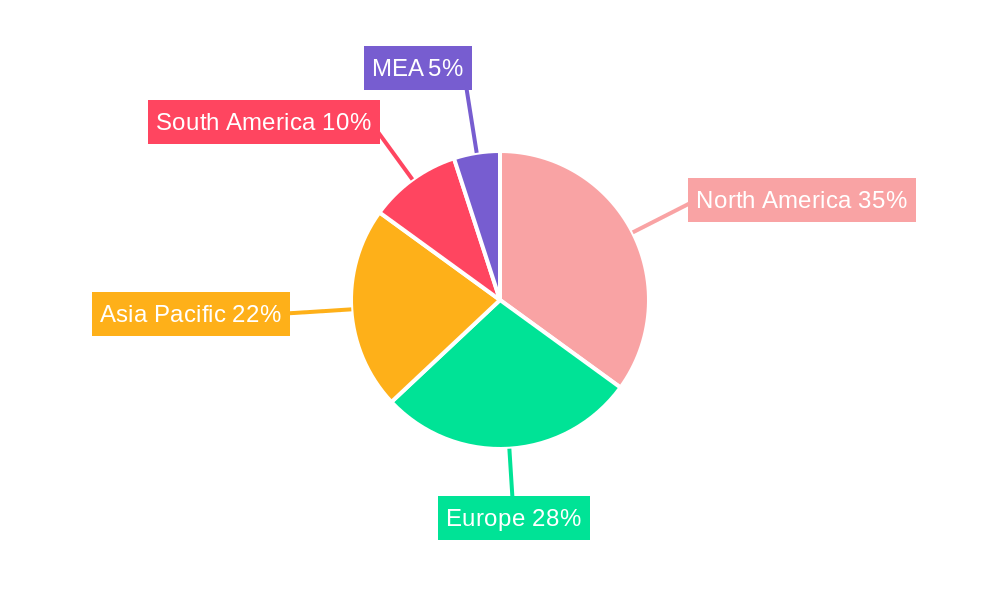
The global orange industry, valued at $3.84 billion in 2025, is projected to experience robust growth, driven by increasing consumer demand for healthy beverages and convenient food options. The Compound Annual Growth Rate (CAGR) of 4.53% from 2025 to 2033 signifies a promising outlook. Key drivers include the rising popularity of orange juice as a source of Vitamin C and antioxidants, coupled with the growing adoption of orange-based products in the food processing and beverage industries. Health consciousness and the increasing preference for natural ingredients are further fueling market expansion. Segment-wise, fresh oranges maintain a significant market share, closely followed by orange juice and concentrates. The beverage industry dominates the application segment, owing to the widespread use of orange juice and concentrates in various beverages. However, the industry faces challenges such as fluctuating orange yields due to weather patterns and increasing competition from other fruit juices. Despite these constraints, strategic partnerships between major players like The Coca-Cola Company, PepsiCo, Minute Maid, Tropicana Products, and Florida's Natural Growers, coupled with innovations in product development and distribution channels, will continue to shape market dynamics and growth. Regional analysis reveals North America and Europe as leading markets, with significant growth potential in Asia-Pacific driven by rising disposable incomes and changing consumption patterns. The market is expected to witness further consolidation as companies focus on brand building, expanding their product portfolio, and exploring new markets.
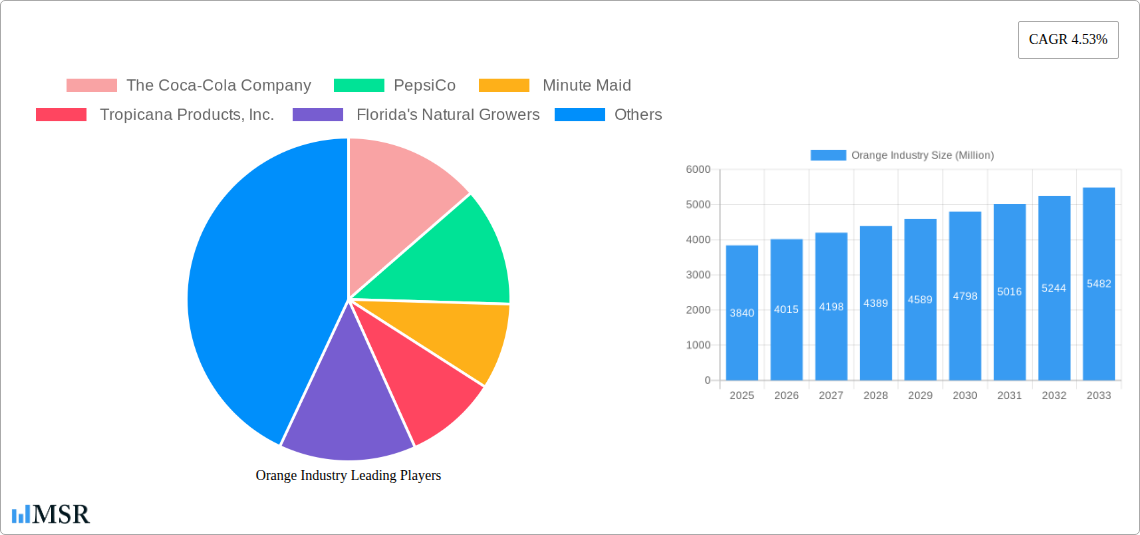
Orange Industry Market Size (In Billion)
The forecast period (2025-2033) anticipates continued growth, although the rate might fluctuate yearly based on factors such as climate change impacting orange yields and evolving consumer preferences. Strategic investments in research and development focused on improving orange varieties and processing techniques will be crucial. The industry's success hinges on addressing sustainability concerns related to water usage and environmental impact during cultivation and processing. Furthermore, effective marketing and branding strategies will be essential to capitalize on the growing health and wellness trends, maintaining consumer preference amidst evolving dietary choices. Market segmentation, tailored to regional preferences and consumer demographics, will also play a key role in maximizing revenue potential. Companies will likely invest in expanding their distribution networks, particularly in emerging markets to reach a wider consumer base and increase market penetration.
Orange Industry Company Market Share
Orange Industry Market Report: 2019-2033 Forecast
This comprehensive report provides an in-depth analysis of the global orange industry, covering market dynamics, key segments, leading players, and future growth prospects. With a study period spanning 2019-2033, a base year of 2025, and a forecast period of 2025-2033, this report offers invaluable insights for industry stakeholders, investors, and businesses operating within the orange juice, fresh orange, orange concentrate, and other orange product markets. The report analyzes a market valued at USD xx Million in 2025, projecting substantial growth over the forecast period.
Orange Industry Market Concentration & Dynamics
The global orange industry showcases a moderately concentrated market structure. Leading players such as The Coca-Cola Company, PepsiCo, Minute Maid, Tropicana Products, Inc., and Florida's Natural Growers command a significant portion of market share. Nevertheless, the industry also thrives with a robust presence of smaller, regional producers and specialized niche players, contributing to a diverse competitive landscape. The industry's dynamism is shaped by a confluence of influential factors:
- Market Share Dynamics: While the top five major corporations collectively hold a substantial market share, estimated at approximately [Insert Market Share Percentage Here]%, there remains considerable opportunity for smaller companies to carve out their own profitable niches. This balance fosters ongoing competition and innovation.
- Advancements in the Innovation Ecosystem: Continuous innovation is a cornerstone of the industry, with a strong focus on enhancing processing techniques for greater efficiency, developing solutions for extended shelf-life to reduce waste, and pioneering the creation of high-value products. This includes leveraging by-products like orange peel extracts for diverse applications and formulating specialized functional beverages designed to meet specific consumer needs.
- Navigating Regulatory Frameworks: The production and international trade of oranges are significantly influenced by a complex web of government regulations. These encompass stringent food safety standards, guidelines for pesticide use, and meticulous labeling requirements. The variation in these regulations across different countries presents a significant challenge and necessitates strategic adaptation for global market participants.
- Competition from Substitute Products: The orange industry faces considerable competition from a broad spectrum of substitute products. This includes a wide array of other fruit juices, various ready-to-drink beverages, and even vitamin supplements, all vying for consumer attention and disposable income. This competition directly impacts the demand for orange-based products.
- Evolving End-User Trends: A pronounced shift towards health-conscious lifestyles is a powerful driver shaping consumer demand. This trend is fueling a growing preference for organic oranges and juices, spurring significant investment in the organic segment. Furthermore, changing consumer preferences for healthier options and the demand for convenient packaging solutions are profoundly impacting the overall market dynamics.
- Mergers & Acquisitions (M&A) Activities: The past five years have witnessed a notable trend of consolidation within the orange industry, with approximately [Insert Number of M&A Deals Here] M&A deals taking place. These transactions have primarily been strategic, aimed at consolidating market share, expanding product portfolios, and achieving greater economies of scale.
Orange Industry Industry Insights & Trends
The global orange industry is poised for significant growth, driven by several factors. The market size was estimated at USD xx Million in 2025 and is projected to reach USD xx Million by 2033, exhibiting a CAGR of xx%. This expansion is fueled by:
- Rising Disposable Incomes: Increasing disposable incomes, particularly in developing economies, are boosting demand for processed orange products and premium orange juice varieties.
- Health & Wellness Trends: Growing awareness of the health benefits of oranges, rich in Vitamin C and antioxidants, drives consumption of fresh oranges and orange-based products.
- Technological Advancements: Improvements in processing technologies enhance product quality, shelf life, and yield, thus increasing profitability and market accessibility. Advances in packaging technology contribute to extended product shelf life.
- Evolving Consumer Behaviors: Consumers increasingly seek convenient, ready-to-drink options and value-added products. The increased demand for organic and sustainably sourced oranges is also affecting supply chains.
Key Markets & Segments Leading Orange Industry
The beverage industry stands as the predominant application segment for oranges, consuming a substantial portion of the global orange output. Key regional markets, each driven by unique factors, include the United States, Brazil, and China.
-
By Type: Orange juice reigns supreme as the largest segment, with fresh oranges following closely behind. Frozen oranges and orange concentrates also maintain significant market presence. Notably, the utilization of orange peel is on an upward trajectory, increasingly valued as a rich source of extracts for the food and beverage industries.
-
By Application:
- Beverage Industry: This segment is the single largest consumer of orange concentrates and juices, accounting for an estimated [Insert Beverage Industry Consumption Percentage Here]% of total orange consumption. The growth in this sector is propelled by continuous product innovation, such as the development of functional beverages, the overall expansion of the global beverage market, and sustained international demand.
- Food Processing: Oranges are integral to a wide array of processed food items, including confectionery, desserts, and various other culinary products, forming a substantial market segment. This demand is driven by the increasing global appetite for processed foods and the diverse applications of oranges in modern cooking and baking.
- Direct Consumption: The segment focused on the direct consumption of fresh oranges is experiencing steady growth. This rise is attributed to heightened consumer awareness regarding the significant nutritional and health benefits offered by fresh oranges, coupled with the convenience factor.
-
Regional Dominance and Growth: The United States and Brazil stand out as leaders in orange production, benefiting from conducive climate conditions and well-established agricultural practices. China, on the other hand, is witnessing remarkable growth in orange consumption, largely driven by increasing disposable incomes and a burgeoning population.
Orange Industry Product Developments
Recent product innovations within the orange industry are expanding the market's appeal and utility. These include the introduction of functional orange juices fortified with essential vitamins and minerals to enhance nutritional profiles, a growing variety of ready-to-drink orange juice blends incorporating diverse natural flavors, and the increasing incorporation of orange peel extracts into cosmetics and pharmaceuticals, capitalizing on their beneficial properties. These advancements are a direct result of leveraging cutting-edge technological breakthroughs in processing, extraction, and packaging. The strategic aim is to develop high-value-added products that resonate with evolving consumer preferences, thereby securing a competitive advantage in the dynamic global marketplace.
Challenges in the Orange Industry Market
The orange industry faces challenges such as fluctuations in orange yields due to climatic changes, increased competition from substitute products, and rising input costs (labor, fertilizers, packaging). These factors impact profitability and require adaptive strategies from producers and processors. Supply chain disruptions, particularly transportation bottlenecks, have also impacted the timely delivery of oranges and processed products.
Forces Driving Orange Industry Growth
Technological advancements in farming practices (e.g., precision agriculture, improved irrigation), growing global demand for healthy and convenient food and beverage options, and government support for the agricultural sector are driving growth. The increasing use of advanced processing techniques leads to more efficient use of resources, enhancing profitability.
Long-Term Growth Catalysts in the Orange Industry
Long-term growth will be fueled by continuous innovation in processing, packaging, and product development. Strategic partnerships between producers, processors, and distributors will enhance supply chain efficiency and global market access. Expanding into new markets and tapping into niche consumer segments will also contribute significantly to the future growth trajectory.
Emerging Opportunities in Orange Industry
The industry is seeing increased demand for organic and sustainably sourced oranges, and opportunities exist in expanding value-added product offerings using orange peel waste and by-products. Functional orange juices enhanced with added benefits, such as immunity-boosting properties, offer substantial potential. Demand for convenient, single-serve packaging and ready-to-drink options will remain a significant factor.
Leading Players in the Orange Industry Sector
- The Coca-Cola Company
- PepsiCo
- Minute Maid
- Tropicana Products, Inc.
- Florida's Natural Growers
Key Milestones in Orange Industry Industry
- May 2022: A pivotal agreement was established between APEDA and the Agrovision Foundation with the ambitious goal of escalating orange exports from USD 61.2 Million to USD 612.0 Million. This strategic initiative is to be achieved through the promotion of organic farming practices and the development of hybrid orange varieties, underscoring a commitment to enhancing market presence and revenue generation.
- September 2022: Virtue Clean Energy marked its entry into the UK market with the launch of an orange-flavored energy drink. This move signifies diversification and potential growth in related product categories and expanding market reach, demonstrating agility and innovation within the broader beverage sector.
- November 2022: Arunachal Pradesh achieved a significant milestone by successfully exporting oranges to the United Arab Emirates (UAE) and Qatar. This achievement signifies a successful penetration into new and promising international export markets, highlighting the global potential for orange producers in emerging regions.
Strategic Outlook for Orange Industry Market
The future trajectory of the orange industry appears exceptionally promising, with sustained growth anticipated across its key segments. To maintain and enhance competitiveness, strategic investments will be paramount. These investments should focus on robust research and development initiatives, the implementation of innovative packaging solutions that address consumer convenience and sustainability, and the optimization of supply chain management for greater efficiency and reduced waste. Furthermore, the strategic expansion into new geographical markets and the continuous development of value-added orange products will be indispensable in driving long-term growth and ensuring sustained profitability within this vibrant and evolving industry.
Orange Industry Segmentation
- 1. Production Analysis
- 2. Consumption Analysis
- 3. Import Market Analysis (Value & Volume)
- 4. Export Market Analysis (Value & Volume)
- 5. Price Trend Analysis
Orange Industry Segmentation By Geography
- 1. Brazil
- 2. China
- 3. India
- 4. Mexico
- 5. United States
- 6. European Union
- 7. Egypt
- 8. South Africa
- 9. Indonesia
- 10. Turkey
Orange Industry Regional Market Share
Geographic Coverage of Orange Industry
Orange Industry REPORT HIGHLIGHTS
| Aspects | Details |
|---|---|
| Study Period | 2020-2034 |
| Base Year | 2025 |
| Estimated Year | 2026 |
| Forecast Period | 2026-2034 |
| Historical Period | 2020-2025 |
| Growth Rate | CAGR of 4.53% from 2020-2034 |
| Segmentation |
|
Table of Contents
- 1. Introduction
- 1.1. Research Scope
- 1.2. Market Segmentation
- 1.3. Research Objective
- 1.4. Definitions and Assumptions
- 2. Executive Summary
- 2.1. Market Snapshot
- 3. Market Dynamics
- 3.1. Market Drivers
- 3.2. Market Restrains
- 3.3. Market Trends
- 3.4. Market Opportunities
- 4. Market Factor Analysis
- 4.1. Porters Five Forces
- 4.1.1. Bargaining Power of Suppliers
- 4.1.2. Bargaining Power of Buyers
- 4.1.3. Threat of New Entrants
- 4.1.4. Threat of Substitutes
- 4.1.5. Competitive Rivalry
- 4.2. PESTEL analysis
- 4.3. BCG Analysis
- 4.3.1. Stars (High Growth, High Market Share)
- 4.3.2. Cash Cows (Low Growth, High Market Share)
- 4.3.3. Question Mark (High Growth, Low Market Share)
- 4.3.4. Dogs (Low Growth, Low Market Share)
- 4.4. Ansoff Matrix Analysis
- 4.5. Supply Chain Analysis
- 4.6. Regulatory Landscape
- 4.7. Current Market Potential and Opportunity Assessment (TAM–SAM–SOM Framework)
- 4.8. MSR Analyst Note
- 4.1. Porters Five Forces
- 5. Market Analysis, Insights and Forecast 2021-2033
- 5.1. Market Analysis, Insights and Forecast - by Production Analysis
- 5.2. Market Analysis, Insights and Forecast - by Consumption Analysis
- 5.3. Market Analysis, Insights and Forecast - by Import Market Analysis (Value & Volume)
- 5.4. Market Analysis, Insights and Forecast - by Export Market Analysis (Value & Volume)
- 5.5. Market Analysis, Insights and Forecast - by Price Trend Analysis
- 5.6. Market Analysis, Insights and Forecast - by Region
- 5.6.1. Brazil
- 5.6.2. China
- 5.6.3. India
- 5.6.4. Mexico
- 5.6.5. United States
- 5.6.6. European Union
- 5.6.7. Egypt
- 5.6.8. South Africa
- 5.6.9. Indonesia
- 5.6.10. Turkey
- 6. Global Orange Industry Analysis, Insights and Forecast, 2021-2033
- 6.1. Market Analysis, Insights and Forecast - by Production Analysis
- 6.2. Market Analysis, Insights and Forecast - by Consumption Analysis
- 6.3. Market Analysis, Insights and Forecast - by Import Market Analysis (Value & Volume)
- 6.4. Market Analysis, Insights and Forecast - by Export Market Analysis (Value & Volume)
- 6.5. Market Analysis, Insights and Forecast - by Price Trend Analysis
- 7. Brazil Orange Industry Analysis, Insights and Forecast, 2020-2032
- 7.1. Market Analysis, Insights and Forecast - by Production Analysis
- 7.2. Market Analysis, Insights and Forecast - by Consumption Analysis
- 7.3. Market Analysis, Insights and Forecast - by Import Market Analysis (Value & Volume)
- 7.4. Market Analysis, Insights and Forecast - by Export Market Analysis (Value & Volume)
- 7.5. Market Analysis, Insights and Forecast - by Price Trend Analysis
- 8. China Orange Industry Analysis, Insights and Forecast, 2020-2032
- 8.1. Market Analysis, Insights and Forecast - by Production Analysis
- 8.2. Market Analysis, Insights and Forecast - by Consumption Analysis
- 8.3. Market Analysis, Insights and Forecast - by Import Market Analysis (Value & Volume)
- 8.4. Market Analysis, Insights and Forecast - by Export Market Analysis (Value & Volume)
- 8.5. Market Analysis, Insights and Forecast - by Price Trend Analysis
- 9. India Orange Industry Analysis, Insights and Forecast, 2020-2032
- 9.1. Market Analysis, Insights and Forecast - by Production Analysis
- 9.2. Market Analysis, Insights and Forecast - by Consumption Analysis
- 9.3. Market Analysis, Insights and Forecast - by Import Market Analysis (Value & Volume)
- 9.4. Market Analysis, Insights and Forecast - by Export Market Analysis (Value & Volume)
- 9.5. Market Analysis, Insights and Forecast - by Price Trend Analysis
- 10. Mexico Orange Industry Analysis, Insights and Forecast, 2020-2032
- 10.1. Market Analysis, Insights and Forecast - by Production Analysis
- 10.2. Market Analysis, Insights and Forecast - by Consumption Analysis
- 10.3. Market Analysis, Insights and Forecast - by Import Market Analysis (Value & Volume)
- 10.4. Market Analysis, Insights and Forecast - by Export Market Analysis (Value & Volume)
- 10.5. Market Analysis, Insights and Forecast - by Price Trend Analysis
- 11. United States Orange Industry Analysis, Insights and Forecast, 2020-2032
- 11.1. Market Analysis, Insights and Forecast - by Production Analysis
- 11.2. Market Analysis, Insights and Forecast - by Consumption Analysis
- 11.3. Market Analysis, Insights and Forecast - by Import Market Analysis (Value & Volume)
- 11.4. Market Analysis, Insights and Forecast - by Export Market Analysis (Value & Volume)
- 11.5. Market Analysis, Insights and Forecast - by Price Trend Analysis
- 12. European Union Orange Industry Analysis, Insights and Forecast, 2020-2032
- 12.1. Market Analysis, Insights and Forecast - by Production Analysis
- 12.2. Market Analysis, Insights and Forecast - by Consumption Analysis
- 12.3. Market Analysis, Insights and Forecast - by Import Market Analysis (Value & Volume)
- 12.4. Market Analysis, Insights and Forecast - by Export Market Analysis (Value & Volume)
- 12.5. Market Analysis, Insights and Forecast - by Price Trend Analysis
- 13. Egypt Orange Industry Analysis, Insights and Forecast, 2020-2032
- 13.1. Market Analysis, Insights and Forecast - by Production Analysis
- 13.2. Market Analysis, Insights and Forecast - by Consumption Analysis
- 13.3. Market Analysis, Insights and Forecast - by Import Market Analysis (Value & Volume)
- 13.4. Market Analysis, Insights and Forecast - by Export Market Analysis (Value & Volume)
- 13.5. Market Analysis, Insights and Forecast - by Price Trend Analysis
- 14. South Africa Orange Industry Analysis, Insights and Forecast, 2020-2032
- 14.1. Market Analysis, Insights and Forecast - by Production Analysis
- 14.2. Market Analysis, Insights and Forecast - by Consumption Analysis
- 14.3. Market Analysis, Insights and Forecast - by Import Market Analysis (Value & Volume)
- 14.4. Market Analysis, Insights and Forecast - by Export Market Analysis (Value & Volume)
- 14.5. Market Analysis, Insights and Forecast - by Price Trend Analysis
- 15. Indonesia Orange Industry Analysis, Insights and Forecast, 2020-2032
- 15.1. Market Analysis, Insights and Forecast - by Production Analysis
- 15.2. Market Analysis, Insights and Forecast - by Consumption Analysis
- 15.3. Market Analysis, Insights and Forecast - by Import Market Analysis (Value & Volume)
- 15.4. Market Analysis, Insights and Forecast - by Export Market Analysis (Value & Volume)
- 15.5. Market Analysis, Insights and Forecast - by Price Trend Analysis
- 16. Turkey Orange Industry Analysis, Insights and Forecast, 2020-2032
- 16.1. Market Analysis, Insights and Forecast - by Production Analysis
- 16.2. Market Analysis, Insights and Forecast - by Consumption Analysis
- 16.3. Market Analysis, Insights and Forecast - by Import Market Analysis (Value & Volume)
- 16.4. Market Analysis, Insights and Forecast - by Export Market Analysis (Value & Volume)
- 16.5. Market Analysis, Insights and Forecast - by Price Trend Analysis
- 17. Competitive Analysis
- 17.1. Company Profiles
- 17.1.1 The Coca-Cola Company
- 17.1.1.1. Company Overview
- 17.1.1.2. Products
- 17.1.1.3. Company Financials
- 17.1.1.4. SWOT Analysis
- 17.1.2 PepsiCo
- 17.1.2.1. Company Overview
- 17.1.2.2. Products
- 17.1.2.3. Company Financials
- 17.1.2.4. SWOT Analysis
- 17.1.3 Minute Maid
- 17.1.3.1. Company Overview
- 17.1.3.2. Products
- 17.1.3.3. Company Financials
- 17.1.3.4. SWOT Analysis
- 17.1.4 Tropicana Products Inc.
- 17.1.4.1. Company Overview
- 17.1.4.2. Products
- 17.1.4.3. Company Financials
- 17.1.4.4. SWOT Analysis
- 17.1.5 Florida's Natural Growers
- 17.1.5.1. Company Overview
- 17.1.5.2. Products
- 17.1.5.3. Company Financials
- 17.1.5.4. SWOT Analysis
- 17.1.1 The Coca-Cola Company
- 17.2. Market Entropy
- 17.2.1 Company's Key Areas Served
- 17.2.2 Recent Developments
- 17.3. Company Market Share Analysis 2025
- 17.3.1 Top 5 Companies Market Share Analysis
- 17.3.2 Top 3 Companies Market Share Analysis
- 17.4. List of Potential Customers
- 18. Research Methodology
List of Figures
- Figure 1: Global Orange Industry Revenue Breakdown (Million, %) by Region 2025 & 2033
- Figure 2: Global Orange Industry Volume Breakdown (Kiloton, %) by Region 2025 & 2033
- Figure 3: Brazil Orange Industry Revenue (Million), by Production Analysis 2025 & 2033
- Figure 4: Brazil Orange Industry Volume (Kiloton), by Production Analysis 2025 & 2033
- Figure 5: Brazil Orange Industry Revenue Share (%), by Production Analysis 2025 & 2033
- Figure 6: Brazil Orange Industry Volume Share (%), by Production Analysis 2025 & 2033
- Figure 7: Brazil Orange Industry Revenue (Million), by Consumption Analysis 2025 & 2033
- Figure 8: Brazil Orange Industry Volume (Kiloton), by Consumption Analysis 2025 & 2033
- Figure 9: Brazil Orange Industry Revenue Share (%), by Consumption Analysis 2025 & 2033
- Figure 10: Brazil Orange Industry Volume Share (%), by Consumption Analysis 2025 & 2033
- Figure 11: Brazil Orange Industry Revenue (Million), by Import Market Analysis (Value & Volume) 2025 & 2033
- Figure 12: Brazil Orange Industry Volume (Kiloton), by Import Market Analysis (Value & Volume) 2025 & 2033
- Figure 13: Brazil Orange Industry Revenue Share (%), by Import Market Analysis (Value & Volume) 2025 & 2033
- Figure 14: Brazil Orange Industry Volume Share (%), by Import Market Analysis (Value & Volume) 2025 & 2033
- Figure 15: Brazil Orange Industry Revenue (Million), by Export Market Analysis (Value & Volume) 2025 & 2033
- Figure 16: Brazil Orange Industry Volume (Kiloton), by Export Market Analysis (Value & Volume) 2025 & 2033
- Figure 17: Brazil Orange Industry Revenue Share (%), by Export Market Analysis (Value & Volume) 2025 & 2033
- Figure 18: Brazil Orange Industry Volume Share (%), by Export Market Analysis (Value & Volume) 2025 & 2033
- Figure 19: Brazil Orange Industry Revenue (Million), by Price Trend Analysis 2025 & 2033
- Figure 20: Brazil Orange Industry Volume (Kiloton), by Price Trend Analysis 2025 & 2033
- Figure 21: Brazil Orange Industry Revenue Share (%), by Price Trend Analysis 2025 & 2033
- Figure 22: Brazil Orange Industry Volume Share (%), by Price Trend Analysis 2025 & 2033
- Figure 23: Brazil Orange Industry Revenue (Million), by Country 2025 & 2033
- Figure 24: Brazil Orange Industry Volume (Kiloton), by Country 2025 & 2033
- Figure 25: Brazil Orange Industry Revenue Share (%), by Country 2025 & 2033
- Figure 26: Brazil Orange Industry Volume Share (%), by Country 2025 & 2033
- Figure 27: China Orange Industry Revenue (Million), by Production Analysis 2025 & 2033
- Figure 28: China Orange Industry Volume (Kiloton), by Production Analysis 2025 & 2033
- Figure 29: China Orange Industry Revenue Share (%), by Production Analysis 2025 & 2033
- Figure 30: China Orange Industry Volume Share (%), by Production Analysis 2025 & 2033
- Figure 31: China Orange Industry Revenue (Million), by Consumption Analysis 2025 & 2033
- Figure 32: China Orange Industry Volume (Kiloton), by Consumption Analysis 2025 & 2033
- Figure 33: China Orange Industry Revenue Share (%), by Consumption Analysis 2025 & 2033
- Figure 34: China Orange Industry Volume Share (%), by Consumption Analysis 2025 & 2033
- Figure 35: China Orange Industry Revenue (Million), by Import Market Analysis (Value & Volume) 2025 & 2033
- Figure 36: China Orange Industry Volume (Kiloton), by Import Market Analysis (Value & Volume) 2025 & 2033
- Figure 37: China Orange Industry Revenue Share (%), by Import Market Analysis (Value & Volume) 2025 & 2033
- Figure 38: China Orange Industry Volume Share (%), by Import Market Analysis (Value & Volume) 2025 & 2033
- Figure 39: China Orange Industry Revenue (Million), by Export Market Analysis (Value & Volume) 2025 & 2033
- Figure 40: China Orange Industry Volume (Kiloton), by Export Market Analysis (Value & Volume) 2025 & 2033
- Figure 41: China Orange Industry Revenue Share (%), by Export Market Analysis (Value & Volume) 2025 & 2033
- Figure 42: China Orange Industry Volume Share (%), by Export Market Analysis (Value & Volume) 2025 & 2033
- Figure 43: China Orange Industry Revenue (Million), by Price Trend Analysis 2025 & 2033
- Figure 44: China Orange Industry Volume (Kiloton), by Price Trend Analysis 2025 & 2033
- Figure 45: China Orange Industry Revenue Share (%), by Price Trend Analysis 2025 & 2033
- Figure 46: China Orange Industry Volume Share (%), by Price Trend Analysis 2025 & 2033
- Figure 47: China Orange Industry Revenue (Million), by Country 2025 & 2033
- Figure 48: China Orange Industry Volume (Kiloton), by Country 2025 & 2033
- Figure 49: China Orange Industry Revenue Share (%), by Country 2025 & 2033
- Figure 50: China Orange Industry Volume Share (%), by Country 2025 & 2033
- Figure 51: India Orange Industry Revenue (Million), by Production Analysis 2025 & 2033
- Figure 52: India Orange Industry Volume (Kiloton), by Production Analysis 2025 & 2033
- Figure 53: India Orange Industry Revenue Share (%), by Production Analysis 2025 & 2033
- Figure 54: India Orange Industry Volume Share (%), by Production Analysis 2025 & 2033
- Figure 55: India Orange Industry Revenue (Million), by Consumption Analysis 2025 & 2033
- Figure 56: India Orange Industry Volume (Kiloton), by Consumption Analysis 2025 & 2033
- Figure 57: India Orange Industry Revenue Share (%), by Consumption Analysis 2025 & 2033
- Figure 58: India Orange Industry Volume Share (%), by Consumption Analysis 2025 & 2033
- Figure 59: India Orange Industry Revenue (Million), by Import Market Analysis (Value & Volume) 2025 & 2033
- Figure 60: India Orange Industry Volume (Kiloton), by Import Market Analysis (Value & Volume) 2025 & 2033
- Figure 61: India Orange Industry Revenue Share (%), by Import Market Analysis (Value & Volume) 2025 & 2033
- Figure 62: India Orange Industry Volume Share (%), by Import Market Analysis (Value & Volume) 2025 & 2033
- Figure 63: India Orange Industry Revenue (Million), by Export Market Analysis (Value & Volume) 2025 & 2033
- Figure 64: India Orange Industry Volume (Kiloton), by Export Market Analysis (Value & Volume) 2025 & 2033
- Figure 65: India Orange Industry Revenue Share (%), by Export Market Analysis (Value & Volume) 2025 & 2033
- Figure 66: India Orange Industry Volume Share (%), by Export Market Analysis (Value & Volume) 2025 & 2033
- Figure 67: India Orange Industry Revenue (Million), by Price Trend Analysis 2025 & 2033
- Figure 68: India Orange Industry Volume (Kiloton), by Price Trend Analysis 2025 & 2033
- Figure 69: India Orange Industry Revenue Share (%), by Price Trend Analysis 2025 & 2033
- Figure 70: India Orange Industry Volume Share (%), by Price Trend Analysis 2025 & 2033
- Figure 71: India Orange Industry Revenue (Million), by Country 2025 & 2033
- Figure 72: India Orange Industry Volume (Kiloton), by Country 2025 & 2033
- Figure 73: India Orange Industry Revenue Share (%), by Country 2025 & 2033
- Figure 74: India Orange Industry Volume Share (%), by Country 2025 & 2033
- Figure 75: Mexico Orange Industry Revenue (Million), by Production Analysis 2025 & 2033
- Figure 76: Mexico Orange Industry Volume (Kiloton), by Production Analysis 2025 & 2033
- Figure 77: Mexico Orange Industry Revenue Share (%), by Production Analysis 2025 & 2033
- Figure 78: Mexico Orange Industry Volume Share (%), by Production Analysis 2025 & 2033
- Figure 79: Mexico Orange Industry Revenue (Million), by Consumption Analysis 2025 & 2033
- Figure 80: Mexico Orange Industry Volume (Kiloton), by Consumption Analysis 2025 & 2033
- Figure 81: Mexico Orange Industry Revenue Share (%), by Consumption Analysis 2025 & 2033
- Figure 82: Mexico Orange Industry Volume Share (%), by Consumption Analysis 2025 & 2033
- Figure 83: Mexico Orange Industry Revenue (Million), by Import Market Analysis (Value & Volume) 2025 & 2033
- Figure 84: Mexico Orange Industry Volume (Kiloton), by Import Market Analysis (Value & Volume) 2025 & 2033
- Figure 85: Mexico Orange Industry Revenue Share (%), by Import Market Analysis (Value & Volume) 2025 & 2033
- Figure 86: Mexico Orange Industry Volume Share (%), by Import Market Analysis (Value & Volume) 2025 & 2033
- Figure 87: Mexico Orange Industry Revenue (Million), by Export Market Analysis (Value & Volume) 2025 & 2033
- Figure 88: Mexico Orange Industry Volume (Kiloton), by Export Market Analysis (Value & Volume) 2025 & 2033
- Figure 89: Mexico Orange Industry Revenue Share (%), by Export Market Analysis (Value & Volume) 2025 & 2033
- Figure 90: Mexico Orange Industry Volume Share (%), by Export Market Analysis (Value & Volume) 2025 & 2033
- Figure 91: Mexico Orange Industry Revenue (Million), by Price Trend Analysis 2025 & 2033
- Figure 92: Mexico Orange Industry Volume (Kiloton), by Price Trend Analysis 2025 & 2033
- Figure 93: Mexico Orange Industry Revenue Share (%), by Price Trend Analysis 2025 & 2033
- Figure 94: Mexico Orange Industry Volume Share (%), by Price Trend Analysis 2025 & 2033
- Figure 95: Mexico Orange Industry Revenue (Million), by Country 2025 & 2033
- Figure 96: Mexico Orange Industry Volume (Kiloton), by Country 2025 & 2033
- Figure 97: Mexico Orange Industry Revenue Share (%), by Country 2025 & 2033
- Figure 98: Mexico Orange Industry Volume Share (%), by Country 2025 & 2033
- Figure 99: United States Orange Industry Revenue (Million), by Production Analysis 2025 & 2033
- Figure 100: United States Orange Industry Volume (Kiloton), by Production Analysis 2025 & 2033
- Figure 101: United States Orange Industry Revenue Share (%), by Production Analysis 2025 & 2033
- Figure 102: United States Orange Industry Volume Share (%), by Production Analysis 2025 & 2033
- Figure 103: United States Orange Industry Revenue (Million), by Consumption Analysis 2025 & 2033
- Figure 104: United States Orange Industry Volume (Kiloton), by Consumption Analysis 2025 & 2033
- Figure 105: United States Orange Industry Revenue Share (%), by Consumption Analysis 2025 & 2033
- Figure 106: United States Orange Industry Volume Share (%), by Consumption Analysis 2025 & 2033
- Figure 107: United States Orange Industry Revenue (Million), by Import Market Analysis (Value & Volume) 2025 & 2033
- Figure 108: United States Orange Industry Volume (Kiloton), by Import Market Analysis (Value & Volume) 2025 & 2033
- Figure 109: United States Orange Industry Revenue Share (%), by Import Market Analysis (Value & Volume) 2025 & 2033
- Figure 110: United States Orange Industry Volume Share (%), by Import Market Analysis (Value & Volume) 2025 & 2033
- Figure 111: United States Orange Industry Revenue (Million), by Export Market Analysis (Value & Volume) 2025 & 2033
- Figure 112: United States Orange Industry Volume (Kiloton), by Export Market Analysis (Value & Volume) 2025 & 2033
- Figure 113: United States Orange Industry Revenue Share (%), by Export Market Analysis (Value & Volume) 2025 & 2033
- Figure 114: United States Orange Industry Volume Share (%), by Export Market Analysis (Value & Volume) 2025 & 2033
- Figure 115: United States Orange Industry Revenue (Million), by Price Trend Analysis 2025 & 2033
- Figure 116: United States Orange Industry Volume (Kiloton), by Price Trend Analysis 2025 & 2033
- Figure 117: United States Orange Industry Revenue Share (%), by Price Trend Analysis 2025 & 2033
- Figure 118: United States Orange Industry Volume Share (%), by Price Trend Analysis 2025 & 2033
- Figure 119: United States Orange Industry Revenue (Million), by Country 2025 & 2033
- Figure 120: United States Orange Industry Volume (Kiloton), by Country 2025 & 2033
- Figure 121: United States Orange Industry Revenue Share (%), by Country 2025 & 2033
- Figure 122: United States Orange Industry Volume Share (%), by Country 2025 & 2033
- Figure 123: European Union Orange Industry Revenue (Million), by Production Analysis 2025 & 2033
- Figure 124: European Union Orange Industry Volume (Kiloton), by Production Analysis 2025 & 2033
- Figure 125: European Union Orange Industry Revenue Share (%), by Production Analysis 2025 & 2033
- Figure 126: European Union Orange Industry Volume Share (%), by Production Analysis 2025 & 2033
- Figure 127: European Union Orange Industry Revenue (Million), by Consumption Analysis 2025 & 2033
- Figure 128: European Union Orange Industry Volume (Kiloton), by Consumption Analysis 2025 & 2033
- Figure 129: European Union Orange Industry Revenue Share (%), by Consumption Analysis 2025 & 2033
- Figure 130: European Union Orange Industry Volume Share (%), by Consumption Analysis 2025 & 2033
- Figure 131: European Union Orange Industry Revenue (Million), by Import Market Analysis (Value & Volume) 2025 & 2033
- Figure 132: European Union Orange Industry Volume (Kiloton), by Import Market Analysis (Value & Volume) 2025 & 2033
- Figure 133: European Union Orange Industry Revenue Share (%), by Import Market Analysis (Value & Volume) 2025 & 2033
- Figure 134: European Union Orange Industry Volume Share (%), by Import Market Analysis (Value & Volume) 2025 & 2033
- Figure 135: European Union Orange Industry Revenue (Million), by Export Market Analysis (Value & Volume) 2025 & 2033
- Figure 136: European Union Orange Industry Volume (Kiloton), by Export Market Analysis (Value & Volume) 2025 & 2033
- Figure 137: European Union Orange Industry Revenue Share (%), by Export Market Analysis (Value & Volume) 2025 & 2033
- Figure 138: European Union Orange Industry Volume Share (%), by Export Market Analysis (Value & Volume) 2025 & 2033
- Figure 139: European Union Orange Industry Revenue (Million), by Price Trend Analysis 2025 & 2033
- Figure 140: European Union Orange Industry Volume (Kiloton), by Price Trend Analysis 2025 & 2033
- Figure 141: European Union Orange Industry Revenue Share (%), by Price Trend Analysis 2025 & 2033
- Figure 142: European Union Orange Industry Volume Share (%), by Price Trend Analysis 2025 & 2033
- Figure 143: European Union Orange Industry Revenue (Million), by Country 2025 & 2033
- Figure 144: European Union Orange Industry Volume (Kiloton), by Country 2025 & 2033
- Figure 145: European Union Orange Industry Revenue Share (%), by Country 2025 & 2033
- Figure 146: European Union Orange Industry Volume Share (%), by Country 2025 & 2033
- Figure 147: Egypt Orange Industry Revenue (Million), by Production Analysis 2025 & 2033
- Figure 148: Egypt Orange Industry Volume (Kiloton), by Production Analysis 2025 & 2033
- Figure 149: Egypt Orange Industry Revenue Share (%), by Production Analysis 2025 & 2033
- Figure 150: Egypt Orange Industry Volume Share (%), by Production Analysis 2025 & 2033
- Figure 151: Egypt Orange Industry Revenue (Million), by Consumption Analysis 2025 & 2033
- Figure 152: Egypt Orange Industry Volume (Kiloton), by Consumption Analysis 2025 & 2033
- Figure 153: Egypt Orange Industry Revenue Share (%), by Consumption Analysis 2025 & 2033
- Figure 154: Egypt Orange Industry Volume Share (%), by Consumption Analysis 2025 & 2033
- Figure 155: Egypt Orange Industry Revenue (Million), by Import Market Analysis (Value & Volume) 2025 & 2033
- Figure 156: Egypt Orange Industry Volume (Kiloton), by Import Market Analysis (Value & Volume) 2025 & 2033
- Figure 157: Egypt Orange Industry Revenue Share (%), by Import Market Analysis (Value & Volume) 2025 & 2033
- Figure 158: Egypt Orange Industry Volume Share (%), by Import Market Analysis (Value & Volume) 2025 & 2033
- Figure 159: Egypt Orange Industry Revenue (Million), by Export Market Analysis (Value & Volume) 2025 & 2033
- Figure 160: Egypt Orange Industry Volume (Kiloton), by Export Market Analysis (Value & Volume) 2025 & 2033
- Figure 161: Egypt Orange Industry Revenue Share (%), by Export Market Analysis (Value & Volume) 2025 & 2033
- Figure 162: Egypt Orange Industry Volume Share (%), by Export Market Analysis (Value & Volume) 2025 & 2033
- Figure 163: Egypt Orange Industry Revenue (Million), by Price Trend Analysis 2025 & 2033
- Figure 164: Egypt Orange Industry Volume (Kiloton), by Price Trend Analysis 2025 & 2033
- Figure 165: Egypt Orange Industry Revenue Share (%), by Price Trend Analysis 2025 & 2033
- Figure 166: Egypt Orange Industry Volume Share (%), by Price Trend Analysis 2025 & 2033
- Figure 167: Egypt Orange Industry Revenue (Million), by Country 2025 & 2033
- Figure 168: Egypt Orange Industry Volume (Kiloton), by Country 2025 & 2033
- Figure 169: Egypt Orange Industry Revenue Share (%), by Country 2025 & 2033
- Figure 170: Egypt Orange Industry Volume Share (%), by Country 2025 & 2033
- Figure 171: South Africa Orange Industry Revenue (Million), by Production Analysis 2025 & 2033
- Figure 172: South Africa Orange Industry Volume (Kiloton), by Production Analysis 2025 & 2033
- Figure 173: South Africa Orange Industry Revenue Share (%), by Production Analysis 2025 & 2033
- Figure 174: South Africa Orange Industry Volume Share (%), by Production Analysis 2025 & 2033
- Figure 175: South Africa Orange Industry Revenue (Million), by Consumption Analysis 2025 & 2033
- Figure 176: South Africa Orange Industry Volume (Kiloton), by Consumption Analysis 2025 & 2033
- Figure 177: South Africa Orange Industry Revenue Share (%), by Consumption Analysis 2025 & 2033
- Figure 178: South Africa Orange Industry Volume Share (%), by Consumption Analysis 2025 & 2033
- Figure 179: South Africa Orange Industry Revenue (Million), by Import Market Analysis (Value & Volume) 2025 & 2033
- Figure 180: South Africa Orange Industry Volume (Kiloton), by Import Market Analysis (Value & Volume) 2025 & 2033
- Figure 181: South Africa Orange Industry Revenue Share (%), by Import Market Analysis (Value & Volume) 2025 & 2033
- Figure 182: South Africa Orange Industry Volume Share (%), by Import Market Analysis (Value & Volume) 2025 & 2033
- Figure 183: South Africa Orange Industry Revenue (Million), by Export Market Analysis (Value & Volume) 2025 & 2033
- Figure 184: South Africa Orange Industry Volume (Kiloton), by Export Market Analysis (Value & Volume) 2025 & 2033
- Figure 185: South Africa Orange Industry Revenue Share (%), by Export Market Analysis (Value & Volume) 2025 & 2033
- Figure 186: South Africa Orange Industry Volume Share (%), by Export Market Analysis (Value & Volume) 2025 & 2033
- Figure 187: South Africa Orange Industry Revenue (Million), by Price Trend Analysis 2025 & 2033
- Figure 188: South Africa Orange Industry Volume (Kiloton), by Price Trend Analysis 2025 & 2033
- Figure 189: South Africa Orange Industry Revenue Share (%), by Price Trend Analysis 2025 & 2033
- Figure 190: South Africa Orange Industry Volume Share (%), by Price Trend Analysis 2025 & 2033
- Figure 191: South Africa Orange Industry Revenue (Million), by Country 2025 & 2033
- Figure 192: South Africa Orange Industry Volume (Kiloton), by Country 2025 & 2033
- Figure 193: South Africa Orange Industry Revenue Share (%), by Country 2025 & 2033
- Figure 194: South Africa Orange Industry Volume Share (%), by Country 2025 & 2033
- Figure 195: Indonesia Orange Industry Revenue (Million), by Production Analysis 2025 & 2033
- Figure 196: Indonesia Orange Industry Volume (Kiloton), by Production Analysis 2025 & 2033
- Figure 197: Indonesia Orange Industry Revenue Share (%), by Production Analysis 2025 & 2033
- Figure 198: Indonesia Orange Industry Volume Share (%), by Production Analysis 2025 & 2033
- Figure 199: Indonesia Orange Industry Revenue (Million), by Consumption Analysis 2025 & 2033
- Figure 200: Indonesia Orange Industry Volume (Kiloton), by Consumption Analysis 2025 & 2033
- Figure 201: Indonesia Orange Industry Revenue Share (%), by Consumption Analysis 2025 & 2033
- Figure 202: Indonesia Orange Industry Volume Share (%), by Consumption Analysis 2025 & 2033
- Figure 203: Indonesia Orange Industry Revenue (Million), by Import Market Analysis (Value & Volume) 2025 & 2033
- Figure 204: Indonesia Orange Industry Volume (Kiloton), by Import Market Analysis (Value & Volume) 2025 & 2033
- Figure 205: Indonesia Orange Industry Revenue Share (%), by Import Market Analysis (Value & Volume) 2025 & 2033
- Figure 206: Indonesia Orange Industry Volume Share (%), by Import Market Analysis (Value & Volume) 2025 & 2033
- Figure 207: Indonesia Orange Industry Revenue (Million), by Export Market Analysis (Value & Volume) 2025 & 2033
- Figure 208: Indonesia Orange Industry Volume (Kiloton), by Export Market Analysis (Value & Volume) 2025 & 2033
- Figure 209: Indonesia Orange Industry Revenue Share (%), by Export Market Analysis (Value & Volume) 2025 & 2033
- Figure 210: Indonesia Orange Industry Volume Share (%), by Export Market Analysis (Value & Volume) 2025 & 2033
- Figure 211: Indonesia Orange Industry Revenue (Million), by Price Trend Analysis 2025 & 2033
- Figure 212: Indonesia Orange Industry Volume (Kiloton), by Price Trend Analysis 2025 & 2033
- Figure 213: Indonesia Orange Industry Revenue Share (%), by Price Trend Analysis 2025 & 2033
- Figure 214: Indonesia Orange Industry Volume Share (%), by Price Trend Analysis 2025 & 2033
- Figure 215: Indonesia Orange Industry Revenue (Million), by Country 2025 & 2033
- Figure 216: Indonesia Orange Industry Volume (Kiloton), by Country 2025 & 2033
- Figure 217: Indonesia Orange Industry Revenue Share (%), by Country 2025 & 2033
- Figure 218: Indonesia Orange Industry Volume Share (%), by Country 2025 & 2033
- Figure 219: Turkey Orange Industry Revenue (Million), by Production Analysis 2025 & 2033
- Figure 220: Turkey Orange Industry Volume (Kiloton), by Production Analysis 2025 & 2033
- Figure 221: Turkey Orange Industry Revenue Share (%), by Production Analysis 2025 & 2033
- Figure 222: Turkey Orange Industry Volume Share (%), by Production Analysis 2025 & 2033
- Figure 223: Turkey Orange Industry Revenue (Million), by Consumption Analysis 2025 & 2033
- Figure 224: Turkey Orange Industry Volume (Kiloton), by Consumption Analysis 2025 & 2033
- Figure 225: Turkey Orange Industry Revenue Share (%), by Consumption Analysis 2025 & 2033
- Figure 226: Turkey Orange Industry Volume Share (%), by Consumption Analysis 2025 & 2033
- Figure 227: Turkey Orange Industry Revenue (Million), by Import Market Analysis (Value & Volume) 2025 & 2033
- Figure 228: Turkey Orange Industry Volume (Kiloton), by Import Market Analysis (Value & Volume) 2025 & 2033
- Figure 229: Turkey Orange Industry Revenue Share (%), by Import Market Analysis (Value & Volume) 2025 & 2033
- Figure 230: Turkey Orange Industry Volume Share (%), by Import Market Analysis (Value & Volume) 2025 & 2033
- Figure 231: Turkey Orange Industry Revenue (Million), by Export Market Analysis (Value & Volume) 2025 & 2033
- Figure 232: Turkey Orange Industry Volume (Kiloton), by Export Market Analysis (Value & Volume) 2025 & 2033
- Figure 233: Turkey Orange Industry Revenue Share (%), by Export Market Analysis (Value & Volume) 2025 & 2033
- Figure 234: Turkey Orange Industry Volume Share (%), by Export Market Analysis (Value & Volume) 2025 & 2033
- Figure 235: Turkey Orange Industry Revenue (Million), by Price Trend Analysis 2025 & 2033
- Figure 236: Turkey Orange Industry Volume (Kiloton), by Price Trend Analysis 2025 & 2033
- Figure 237: Turkey Orange Industry Revenue Share (%), by Price Trend Analysis 2025 & 2033
- Figure 238: Turkey Orange Industry Volume Share (%), by Price Trend Analysis 2025 & 2033
- Figure 239: Turkey Orange Industry Revenue (Million), by Country 2025 & 2033
- Figure 240: Turkey Orange Industry Volume (Kiloton), by Country 2025 & 2033
- Figure 241: Turkey Orange Industry Revenue Share (%), by Country 2025 & 2033
- Figure 242: Turkey Orange Industry Volume Share (%), by Country 2025 & 2033
List of Tables
- Table 1: Global Orange Industry Revenue Million Forecast, by Production Analysis 2020 & 2033
- Table 2: Global Orange Industry Volume Kiloton Forecast, by Production Analysis 2020 & 2033
- Table 3: Global Orange Industry Revenue Million Forecast, by Consumption Analysis 2020 & 2033
- Table 4: Global Orange Industry Volume Kiloton Forecast, by Consumption Analysis 2020 & 2033
- Table 5: Global Orange Industry Revenue Million Forecast, by Import Market Analysis (Value & Volume) 2020 & 2033
- Table 6: Global Orange Industry Volume Kiloton Forecast, by Import Market Analysis (Value & Volume) 2020 & 2033
- Table 7: Global Orange Industry Revenue Million Forecast, by Export Market Analysis (Value & Volume) 2020 & 2033
- Table 8: Global Orange Industry Volume Kiloton Forecast, by Export Market Analysis (Value & Volume) 2020 & 2033
- Table 9: Global Orange Industry Revenue Million Forecast, by Price Trend Analysis 2020 & 2033
- Table 10: Global Orange Industry Volume Kiloton Forecast, by Price Trend Analysis 2020 & 2033
- Table 11: Global Orange Industry Revenue Million Forecast, by Region 2020 & 2033
- Table 12: Global Orange Industry Volume Kiloton Forecast, by Region 2020 & 2033
- Table 13: Global Orange Industry Revenue Million Forecast, by Production Analysis 2020 & 2033
- Table 14: Global Orange Industry Volume Kiloton Forecast, by Production Analysis 2020 & 2033
- Table 15: Global Orange Industry Revenue Million Forecast, by Consumption Analysis 2020 & 2033
- Table 16: Global Orange Industry Volume Kiloton Forecast, by Consumption Analysis 2020 & 2033
- Table 17: Global Orange Industry Revenue Million Forecast, by Import Market Analysis (Value & Volume) 2020 & 2033
- Table 18: Global Orange Industry Volume Kiloton Forecast, by Import Market Analysis (Value & Volume) 2020 & 2033
- Table 19: Global Orange Industry Revenue Million Forecast, by Export Market Analysis (Value & Volume) 2020 & 2033
- Table 20: Global Orange Industry Volume Kiloton Forecast, by Export Market Analysis (Value & Volume) 2020 & 2033
- Table 21: Global Orange Industry Revenue Million Forecast, by Price Trend Analysis 2020 & 2033
- Table 22: Global Orange Industry Volume Kiloton Forecast, by Price Trend Analysis 2020 & 2033
- Table 23: Global Orange Industry Revenue Million Forecast, by Country 2020 & 2033
- Table 24: Global Orange Industry Volume Kiloton Forecast, by Country 2020 & 2033
- Table 25: Global Orange Industry Revenue Million Forecast, by Production Analysis 2020 & 2033
- Table 26: Global Orange Industry Volume Kiloton Forecast, by Production Analysis 2020 & 2033
- Table 27: Global Orange Industry Revenue Million Forecast, by Consumption Analysis 2020 & 2033
- Table 28: Global Orange Industry Volume Kiloton Forecast, by Consumption Analysis 2020 & 2033
- Table 29: Global Orange Industry Revenue Million Forecast, by Import Market Analysis (Value & Volume) 2020 & 2033
- Table 30: Global Orange Industry Volume Kiloton Forecast, by Import Market Analysis (Value & Volume) 2020 & 2033
- Table 31: Global Orange Industry Revenue Million Forecast, by Export Market Analysis (Value & Volume) 2020 & 2033
- Table 32: Global Orange Industry Volume Kiloton Forecast, by Export Market Analysis (Value & Volume) 2020 & 2033
- Table 33: Global Orange Industry Revenue Million Forecast, by Price Trend Analysis 2020 & 2033
- Table 34: Global Orange Industry Volume Kiloton Forecast, by Price Trend Analysis 2020 & 2033
- Table 35: Global Orange Industry Revenue Million Forecast, by Country 2020 & 2033
- Table 36: Global Orange Industry Volume Kiloton Forecast, by Country 2020 & 2033
- Table 37: Global Orange Industry Revenue Million Forecast, by Production Analysis 2020 & 2033
- Table 38: Global Orange Industry Volume Kiloton Forecast, by Production Analysis 2020 & 2033
- Table 39: Global Orange Industry Revenue Million Forecast, by Consumption Analysis 2020 & 2033
- Table 40: Global Orange Industry Volume Kiloton Forecast, by Consumption Analysis 2020 & 2033
- Table 41: Global Orange Industry Revenue Million Forecast, by Import Market Analysis (Value & Volume) 2020 & 2033
- Table 42: Global Orange Industry Volume Kiloton Forecast, by Import Market Analysis (Value & Volume) 2020 & 2033
- Table 43: Global Orange Industry Revenue Million Forecast, by Export Market Analysis (Value & Volume) 2020 & 2033
- Table 44: Global Orange Industry Volume Kiloton Forecast, by Export Market Analysis (Value & Volume) 2020 & 2033
- Table 45: Global Orange Industry Revenue Million Forecast, by Price Trend Analysis 2020 & 2033
- Table 46: Global Orange Industry Volume Kiloton Forecast, by Price Trend Analysis 2020 & 2033
- Table 47: Global Orange Industry Revenue Million Forecast, by Country 2020 & 2033
- Table 48: Global Orange Industry Volume Kiloton Forecast, by Country 2020 & 2033
- Table 49: Global Orange Industry Revenue Million Forecast, by Production Analysis 2020 & 2033
- Table 50: Global Orange Industry Volume Kiloton Forecast, by Production Analysis 2020 & 2033
- Table 51: Global Orange Industry Revenue Million Forecast, by Consumption Analysis 2020 & 2033
- Table 52: Global Orange Industry Volume Kiloton Forecast, by Consumption Analysis 2020 & 2033
- Table 53: Global Orange Industry Revenue Million Forecast, by Import Market Analysis (Value & Volume) 2020 & 2033
- Table 54: Global Orange Industry Volume Kiloton Forecast, by Import Market Analysis (Value & Volume) 2020 & 2033
- Table 55: Global Orange Industry Revenue Million Forecast, by Export Market Analysis (Value & Volume) 2020 & 2033
- Table 56: Global Orange Industry Volume Kiloton Forecast, by Export Market Analysis (Value & Volume) 2020 & 2033
- Table 57: Global Orange Industry Revenue Million Forecast, by Price Trend Analysis 2020 & 2033
- Table 58: Global Orange Industry Volume Kiloton Forecast, by Price Trend Analysis 2020 & 2033
- Table 59: Global Orange Industry Revenue Million Forecast, by Country 2020 & 2033
- Table 60: Global Orange Industry Volume Kiloton Forecast, by Country 2020 & 2033
- Table 61: Global Orange Industry Revenue Million Forecast, by Production Analysis 2020 & 2033
- Table 62: Global Orange Industry Volume Kiloton Forecast, by Production Analysis 2020 & 2033
- Table 63: Global Orange Industry Revenue Million Forecast, by Consumption Analysis 2020 & 2033
- Table 64: Global Orange Industry Volume Kiloton Forecast, by Consumption Analysis 2020 & 2033
- Table 65: Global Orange Industry Revenue Million Forecast, by Import Market Analysis (Value & Volume) 2020 & 2033
- Table 66: Global Orange Industry Volume Kiloton Forecast, by Import Market Analysis (Value & Volume) 2020 & 2033
- Table 67: Global Orange Industry Revenue Million Forecast, by Export Market Analysis (Value & Volume) 2020 & 2033
- Table 68: Global Orange Industry Volume Kiloton Forecast, by Export Market Analysis (Value & Volume) 2020 & 2033
- Table 69: Global Orange Industry Revenue Million Forecast, by Price Trend Analysis 2020 & 2033
- Table 70: Global Orange Industry Volume Kiloton Forecast, by Price Trend Analysis 2020 & 2033
- Table 71: Global Orange Industry Revenue Million Forecast, by Country 2020 & 2033
- Table 72: Global Orange Industry Volume Kiloton Forecast, by Country 2020 & 2033
- Table 73: Global Orange Industry Revenue Million Forecast, by Production Analysis 2020 & 2033
- Table 74: Global Orange Industry Volume Kiloton Forecast, by Production Analysis 2020 & 2033
- Table 75: Global Orange Industry Revenue Million Forecast, by Consumption Analysis 2020 & 2033
- Table 76: Global Orange Industry Volume Kiloton Forecast, by Consumption Analysis 2020 & 2033
- Table 77: Global Orange Industry Revenue Million Forecast, by Import Market Analysis (Value & Volume) 2020 & 2033
- Table 78: Global Orange Industry Volume Kiloton Forecast, by Import Market Analysis (Value & Volume) 2020 & 2033
- Table 79: Global Orange Industry Revenue Million Forecast, by Export Market Analysis (Value & Volume) 2020 & 2033
- Table 80: Global Orange Industry Volume Kiloton Forecast, by Export Market Analysis (Value & Volume) 2020 & 2033
- Table 81: Global Orange Industry Revenue Million Forecast, by Price Trend Analysis 2020 & 2033
- Table 82: Global Orange Industry Volume Kiloton Forecast, by Price Trend Analysis 2020 & 2033
- Table 83: Global Orange Industry Revenue Million Forecast, by Country 2020 & 2033
- Table 84: Global Orange Industry Volume Kiloton Forecast, by Country 2020 & 2033
- Table 85: Global Orange Industry Revenue Million Forecast, by Production Analysis 2020 & 2033
- Table 86: Global Orange Industry Volume Kiloton Forecast, by Production Analysis 2020 & 2033
- Table 87: Global Orange Industry Revenue Million Forecast, by Consumption Analysis 2020 & 2033
- Table 88: Global Orange Industry Volume Kiloton Forecast, by Consumption Analysis 2020 & 2033
- Table 89: Global Orange Industry Revenue Million Forecast, by Import Market Analysis (Value & Volume) 2020 & 2033
- Table 90: Global Orange Industry Volume Kiloton Forecast, by Import Market Analysis (Value & Volume) 2020 & 2033
- Table 91: Global Orange Industry Revenue Million Forecast, by Export Market Analysis (Value & Volume) 2020 & 2033
- Table 92: Global Orange Industry Volume Kiloton Forecast, by Export Market Analysis (Value & Volume) 2020 & 2033
- Table 93: Global Orange Industry Revenue Million Forecast, by Price Trend Analysis 2020 & 2033
- Table 94: Global Orange Industry Volume Kiloton Forecast, by Price Trend Analysis 2020 & 2033
- Table 95: Global Orange Industry Revenue Million Forecast, by Country 2020 & 2033
- Table 96: Global Orange Industry Volume Kiloton Forecast, by Country 2020 & 2033
- Table 97: Global Orange Industry Revenue Million Forecast, by Production Analysis 2020 & 2033
- Table 98: Global Orange Industry Volume Kiloton Forecast, by Production Analysis 2020 & 2033
- Table 99: Global Orange Industry Revenue Million Forecast, by Consumption Analysis 2020 & 2033
- Table 100: Global Orange Industry Volume Kiloton Forecast, by Consumption Analysis 2020 & 2033
- Table 101: Global Orange Industry Revenue Million Forecast, by Import Market Analysis (Value & Volume) 2020 & 2033
- Table 102: Global Orange Industry Volume Kiloton Forecast, by Import Market Analysis (Value & Volume) 2020 & 2033
- Table 103: Global Orange Industry Revenue Million Forecast, by Export Market Analysis (Value & Volume) 2020 & 2033
- Table 104: Global Orange Industry Volume Kiloton Forecast, by Export Market Analysis (Value & Volume) 2020 & 2033
- Table 105: Global Orange Industry Revenue Million Forecast, by Price Trend Analysis 2020 & 2033
- Table 106: Global Orange Industry Volume Kiloton Forecast, by Price Trend Analysis 2020 & 2033
- Table 107: Global Orange Industry Revenue Million Forecast, by Country 2020 & 2033
- Table 108: Global Orange Industry Volume Kiloton Forecast, by Country 2020 & 2033
- Table 109: Global Orange Industry Revenue Million Forecast, by Production Analysis 2020 & 2033
- Table 110: Global Orange Industry Volume Kiloton Forecast, by Production Analysis 2020 & 2033
- Table 111: Global Orange Industry Revenue Million Forecast, by Consumption Analysis 2020 & 2033
- Table 112: Global Orange Industry Volume Kiloton Forecast, by Consumption Analysis 2020 & 2033
- Table 113: Global Orange Industry Revenue Million Forecast, by Import Market Analysis (Value & Volume) 2020 & 2033
- Table 114: Global Orange Industry Volume Kiloton Forecast, by Import Market Analysis (Value & Volume) 2020 & 2033
- Table 115: Global Orange Industry Revenue Million Forecast, by Export Market Analysis (Value & Volume) 2020 & 2033
- Table 116: Global Orange Industry Volume Kiloton Forecast, by Export Market Analysis (Value & Volume) 2020 & 2033
- Table 117: Global Orange Industry Revenue Million Forecast, by Price Trend Analysis 2020 & 2033
- Table 118: Global Orange Industry Volume Kiloton Forecast, by Price Trend Analysis 2020 & 2033
- Table 119: Global Orange Industry Revenue Million Forecast, by Country 2020 & 2033
- Table 120: Global Orange Industry Volume Kiloton Forecast, by Country 2020 & 2033
- Table 121: Global Orange Industry Revenue Million Forecast, by Production Analysis 2020 & 2033
- Table 122: Global Orange Industry Volume Kiloton Forecast, by Production Analysis 2020 & 2033
- Table 123: Global Orange Industry Revenue Million Forecast, by Consumption Analysis 2020 & 2033
- Table 124: Global Orange Industry Volume Kiloton Forecast, by Consumption Analysis 2020 & 2033
- Table 125: Global Orange Industry Revenue Million Forecast, by Import Market Analysis (Value & Volume) 2020 & 2033
- Table 126: Global Orange Industry Volume Kiloton Forecast, by Import Market Analysis (Value & Volume) 2020 & 2033
- Table 127: Global Orange Industry Revenue Million Forecast, by Export Market Analysis (Value & Volume) 2020 & 2033
- Table 128: Global Orange Industry Volume Kiloton Forecast, by Export Market Analysis (Value & Volume) 2020 & 2033
- Table 129: Global Orange Industry Revenue Million Forecast, by Price Trend Analysis 2020 & 2033
- Table 130: Global Orange Industry Volume Kiloton Forecast, by Price Trend Analysis 2020 & 2033
- Table 131: Global Orange Industry Revenue Million Forecast, by Country 2020 & 2033
- Table 132: Global Orange Industry Volume Kiloton Forecast, by Country 2020 & 2033
Frequently Asked Questions
1. What is the projected Compound Annual Growth Rate (CAGR) of the Orange Industry?
The projected CAGR is approximately 4.53%.
2. Which companies are prominent players in the Orange Industry?
Key companies in the market include The Coca-Cola Company , PepsiCo , Minute Maid, Tropicana Products, Inc. , Florida's Natural Growers.
3. What are the main segments of the Orange Industry?
The market segments include Production Analysis, Consumption Analysis, Import Market Analysis (Value & Volume), Export Market Analysis (Value & Volume), Price Trend Analysis.
4. Can you provide details about the market size?
The market size is estimated to be USD 3.84 Million as of 2022.
5. What are some drivers contributing to market growth?
Rising Consumption of Cashew Nuts as a Healthy Snack; Increasing Government initiatives; Growing Cashew Nut Imports in The United States.
6. What are the notable trends driving market growth?
Growing Seasonal Consumption of Orange.
7. Are there any restraints impacting market growth?
Hazardous Climatic Condition Hinders Cashew Production; Stringent Regulations Related To Food Quality Standards.
8. Can you provide examples of recent developments in the market?
November 2022: Arunachal Pradesh Agriculture Marketing Board exported the first 6 metric tons of oranges consignment to the UAE and Qatar in collaboration with the Agricultural and Processed Food Products Export Development Authority, the central government, and the Dubai-based Lulu Group International. The oranges will be launched at the Lulu Group's hypermarkets in the UAE and Qatar.
9. What pricing options are available for accessing the report?
Pricing options include single-user, multi-user, and enterprise licenses priced at USD 4750, USD 5250, and USD 8750 respectively.
10. Is the market size provided in terms of value or volume?
The market size is provided in terms of value, measured in Million and volume, measured in Kiloton.
11. Are there any specific market keywords associated with the report?
Yes, the market keyword associated with the report is "Orange Industry," which aids in identifying and referencing the specific market segment covered.
12. How do I determine which pricing option suits my needs best?
The pricing options vary based on user requirements and access needs. Individual users may opt for single-user licenses, while businesses requiring broader access may choose multi-user or enterprise licenses for cost-effective access to the report.
13. Are there any additional resources or data provided in the Orange Industry report?
While the report offers comprehensive insights, it's advisable to review the specific contents or supplementary materials provided to ascertain if additional resources or data are available.
14. How can I stay updated on further developments or reports in the Orange Industry?
To stay informed about further developments, trends, and reports in the Orange Industry, consider subscribing to industry newsletters, following relevant companies and organizations, or regularly checking reputable industry news sources and publications.
Methodology
Step 1 - Identification of Relevant Samples Size from Population Database


Step 2 - Approaches for Defining Global Market Size (Value, Volume* & Price*)

Note*: In applicable scenarios
Step 3 - Data Sources
Primary Research
- Web Analytics
- Survey Reports
- Research Institute
- Latest Research Reports
- Opinion Leaders
Secondary Research
- Annual Reports
- White Paper
- Latest Press Release
- Industry Association
- Paid Database
- Investor Presentations

Step 4 - Data Triangulation
Involves using different sources of information in order to increase the validity of a study
These sources are likely to be stakeholders in a program - participants, other researchers, program staff, other community members, and so on.
Then we put all data in single framework & apply various statistical tools to find out the dynamic on the market.
During the analysis stage, feedback from the stakeholder groups would be compared to determine areas of agreement as well as areas of divergence