

Key Insights
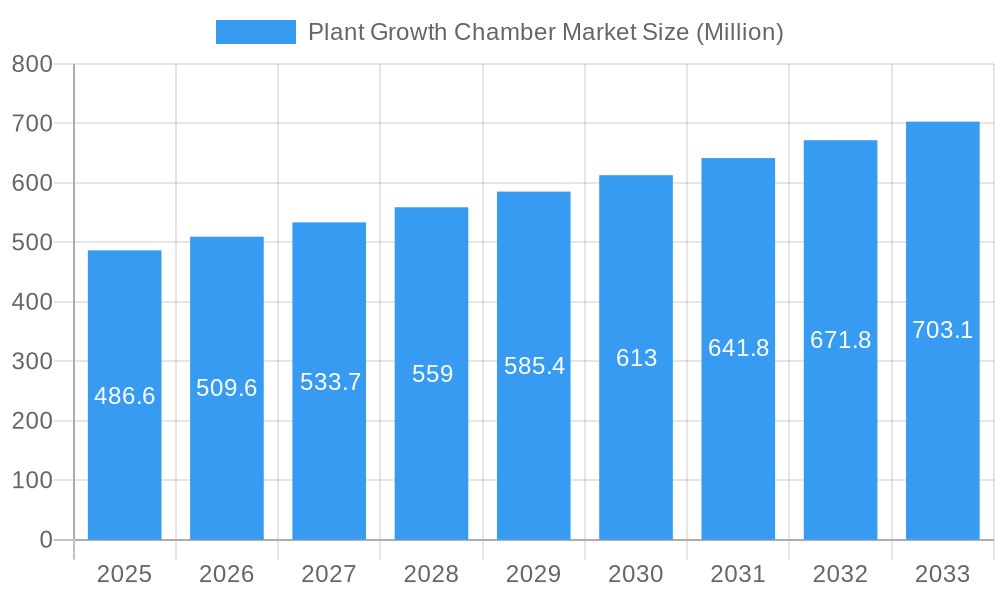
The global Plant Growth Chamber market, valued at $486.60 million in 2025, is projected to experience robust growth, driven by increasing demand for controlled environment agriculture and advancements in plant research. The Compound Annual Growth Rate (CAGR) of 4.70% from 2025 to 2033 indicates a significant market expansion, reaching an estimated $675 million by 2033. This growth is fueled by several key factors. Firstly, the rising global population and increasing food security concerns are pushing the adoption of controlled environment agriculture techniques, enhancing crop yield and quality regardless of external climatic conditions. Secondly, the pharmaceutical and biotechnology industries are significantly investing in plant-based research, necessitating advanced plant growth chambers for precise experimental control and consistent results. Furthermore, technological advancements in chamber design, such as improved climate control systems, automated monitoring, and energy-efficient lighting solutions, are further driving market expansion. Finally, the increasing adoption of tissue culture techniques for plant propagation is also contributing to this growth.
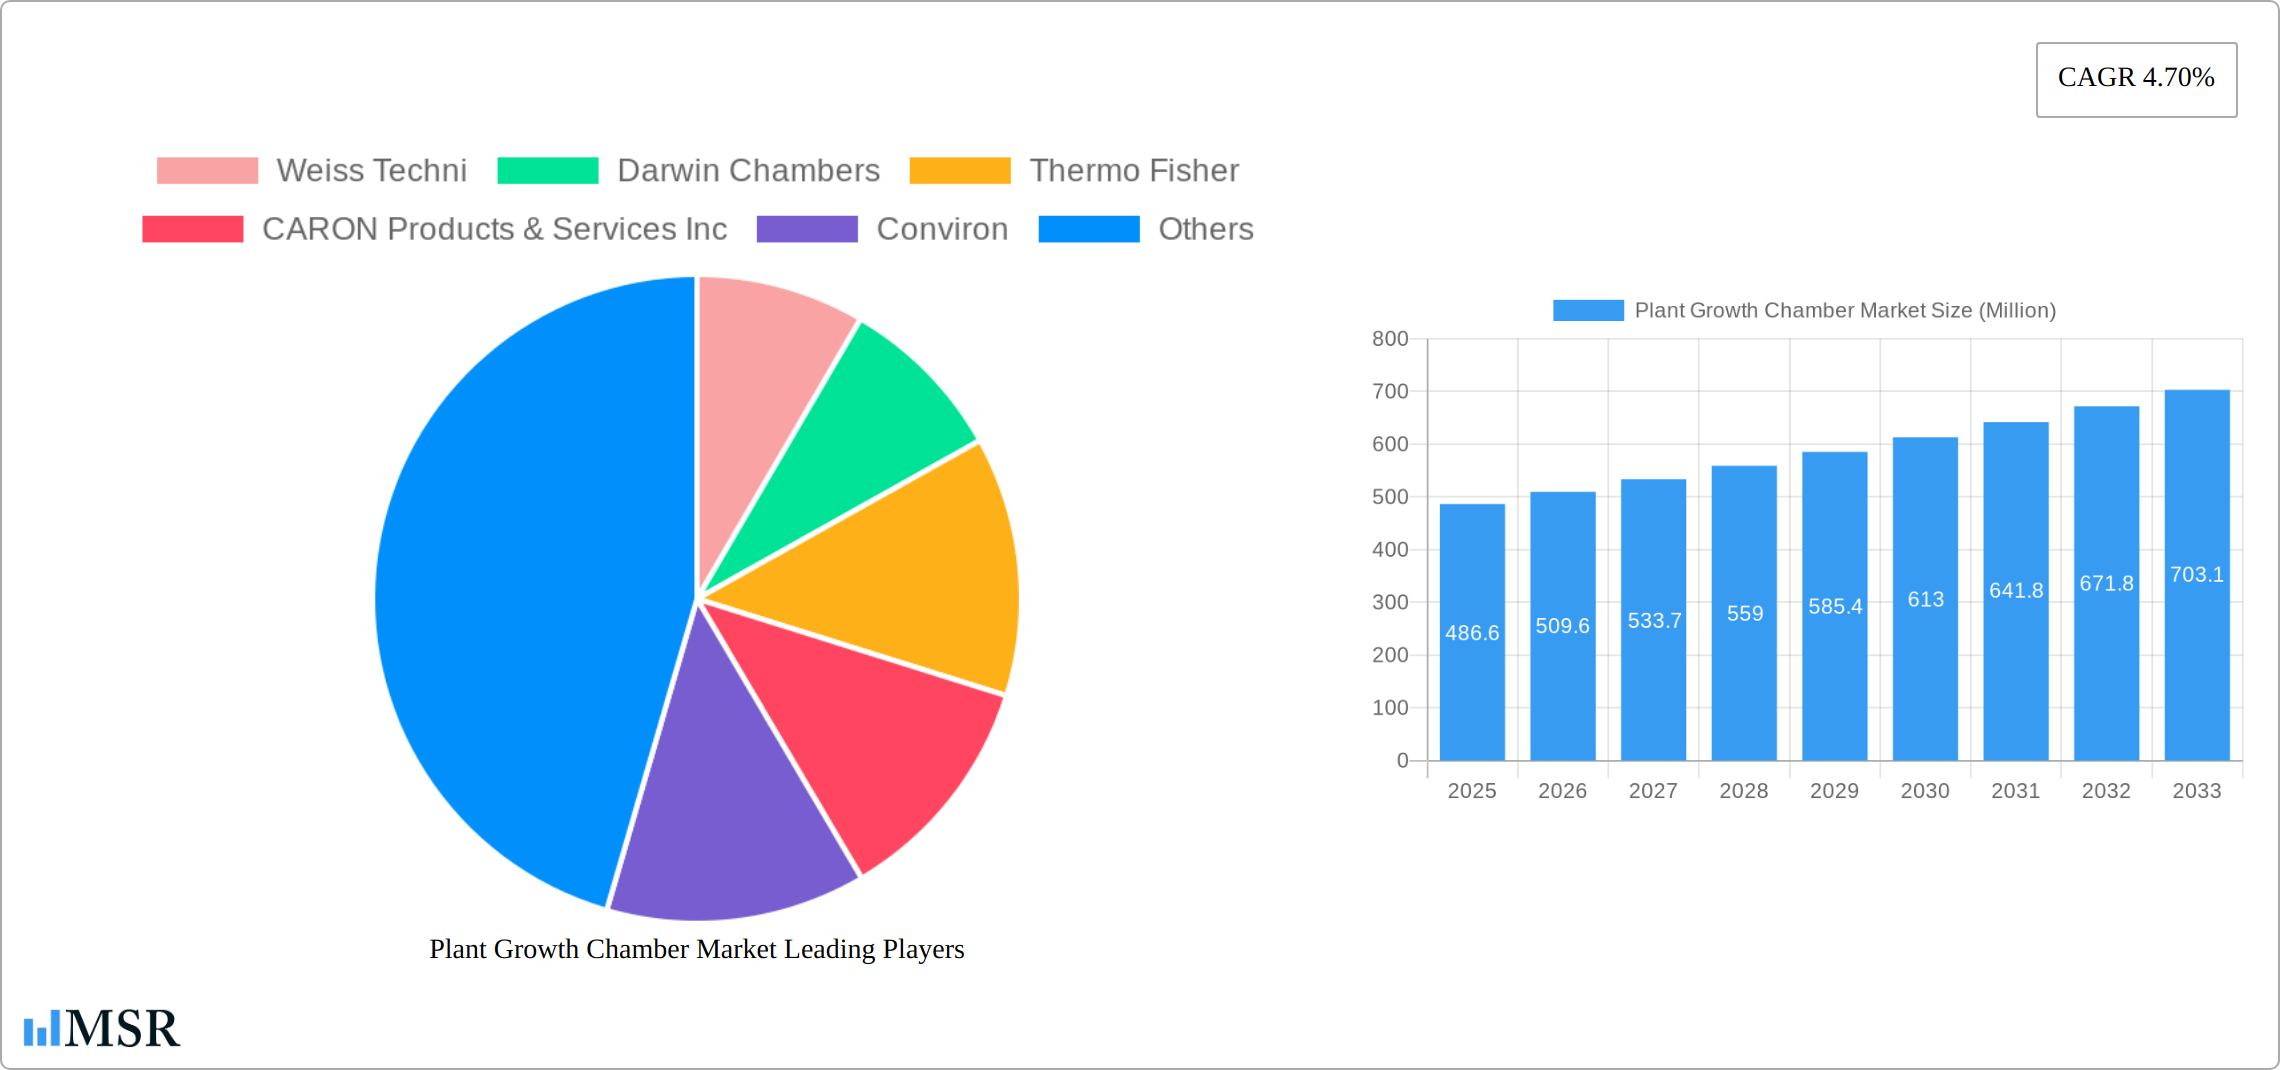
Plant Growth Chamber Market Market Size (In Million)
Market segmentation reveals a dynamic landscape. Reach-in and walk-in chambers dominate the equipment type segment, catering to varying research and production needs. Application-wise, short-plant and tall-plant chambers see significant demand, with applications spanning plant growth studies, seed germination experiments, environment optimization for specific plant species, and tissue culture applications. Key players like Weiss Technik, Darwin Chambers, and Thermo Fisher Scientific are shaping the market through innovation and strategic partnerships, while regional analysis shows strong growth in North America and Asia Pacific, driven by robust research investments and expanding agricultural sectors. However, high initial investment costs and the need for specialized maintenance could potentially restrain market growth to some extent. Nevertheless, the overall outlook for the Plant Growth Chamber market remains highly positive, presenting substantial opportunities for established players and new entrants alike.
Plant Growth Chamber Market Company Market Share
Plant Growth Chamber Market: A Comprehensive Report (2019-2033)
This in-depth report provides a comprehensive analysis of the global Plant Growth Chamber market, covering the period 2019-2033. It delves into market dynamics, industry trends, key segments, leading players, and future opportunities, offering actionable insights for stakeholders across the agricultural technology, research, and pharmaceutical sectors. The report uses 2025 as its base year and provides estimations and forecasts until 2033. The total market size in 2025 is estimated at xx Million, exhibiting a CAGR of xx% during the forecast period.
Plant Growth Chamber Market Concentration & Dynamics
The Plant Growth Chamber market is characterized by a moderately consolidated landscape with several major players holding significant market share. Weiss Techni, Darwin Chambers, Thermo Fisher, CARON Products & Services Inc, Conviron, Aralab, Percival Scientific Inc, Brs Bvba, BINDER GmbH, Hettich Benelux BV, Saveer Biotech Limited, and Freezers India are key contributors. Market share data for 2025 reveals that Thermo Fisher Scientific holds an estimated xx% share, followed by Conviron with approximately xx% and Weiss Techni with xx%. The remaining players collectively account for the remaining share.
The market's dynamic nature is fueled by several factors:
- Innovation Ecosystem: Continuous advancements in environmental control technologies, automation, and data analytics drive innovation.
- Regulatory Frameworks: Stringent regulations concerning research and development, particularly in the pharmaceutical and agricultural sectors, shape market growth.
- Substitute Products: Limited direct substitutes exist, but alternative methods for plant cultivation could indirectly impact market growth.
- End-User Trends: The increasing demand for controlled environments in plant research and commercial cultivation drives market expansion.
- M&A Activities: The recent merger of Weiss Umwelttechnik GmbH and Vötsch Industrietechnik GmbH (May 2021) and the acquisition of Bigneat by Caron (August 2021) highlight the strategic importance of consolidation within the sector. A total of xx M&A deals were recorded during the historical period (2019-2024).
Plant Growth Chamber Market Industry Insights & Trends
The global Plant Growth Chamber market is experiencing robust growth, driven by several key factors. The market size in 2024 was estimated to be xx Million. The increasing demand for controlled environment agriculture (CEA), particularly in urban farming and vertical agriculture, is a significant driver. Technological advancements such as LED lighting, automated control systems, and data-driven analytics enhance efficiency and yield, further fueling market expansion. Growing research activities in plant biology, pharmaceuticals, and biotechnology also contribute to the market's growth trajectory. The rising awareness about food security and the need for sustainable agricultural practices are further propelling the adoption of plant growth chambers across various sectors. These advancements and market trends result in a positive market outlook, with a projected CAGR of xx% from 2025 to 2033.
Key Markets & Segments Leading Plant Growth Chamber Market
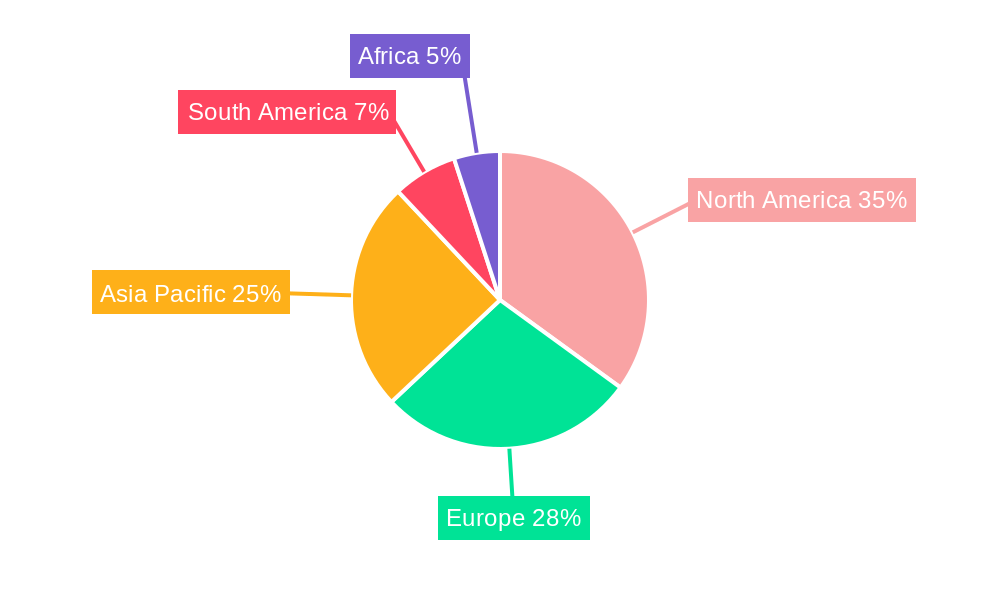
The North American region is currently the dominant market for plant growth chambers, driven by robust research funding, technological advancements, and established agricultural sectors. Europe also holds a significant market share, followed by the Asia-Pacific region, which is witnessing rapid growth due to increasing investment in agricultural technology and infrastructure.
Dominant Segments:
- Equipment Type: Walk-in chambers currently hold a larger market share than reach-in chambers due to their capacity to accommodate larger plants and research projects.
- Application: The demand for plant growth chambers is high across various applications, with short plants currently holding a larger market share, however, the segment for tall plants is showing increased growth potential due to the cultivation of high-value crops.
- Function: Plant growth and tissue culture are the primary functions driving demand, although seed germination and environment optimization are also significant application areas.
Drivers:
- Economic Growth: Strong economic conditions in developed nations stimulate investment in agricultural and research technologies.
- Infrastructure Development: Investment in research facilities and agricultural infrastructure supports the adoption of plant growth chambers.
- Technological Advancements: Continuous improvements in chamber technology and automation enhance efficiency and market appeal.
Plant Growth Chamber Market Product Developments
Recent innovations in the plant growth chamber market are revolutionizing controlled environment agriculture (CEA). A key trend is the widespread adoption of highly precise environmental control systems, driven by advancements in automation and data analytics integration. LED lighting systems are at the forefront of this change, offering adjustable spectral outputs tailored to specific plant needs and boasting significantly improved energy efficiency compared to traditional lighting solutions. Automated monitoring and control systems allow for remote management and real-time data analysis, optimizing growing conditions, minimizing resource waste, and reducing operational costs. Furthermore, the market is witnessing the development of highly customized chambers designed to meet the unique requirements of diverse plant species and research applications. These sophisticated solutions provide manufacturers with a substantial competitive advantage, attracting both academic researchers and large-scale commercial growers seeking enhanced productivity and yield predictability.
Challenges in the Plant Growth Chamber Market
Several factors hinder market growth. High initial investment costs for sophisticated chambers can pose a barrier to entry for smaller research facilities. Supply chain disruptions and component shortages can impact production and lead times. Intense competition from existing players and the emergence of new entrants exert pressure on pricing and margins. Furthermore, regulatory compliance requirements and the complexity of obtaining permits can create challenges for manufacturers and users. These challenges collectively impact the overall growth of the market by approximately xx% yearly.
Forces Driving Plant Growth Chamber Market Growth
Several powerful factors are converging to fuel the robust growth of the plant growth chamber market. Technological advancements, particularly the widespread adoption of energy-efficient LED lighting and sophisticated environmental control technologies, are significantly impacting market expansion. Government initiatives are also playing a crucial role, with increasing support and funding for agricultural research and development activities driving demand. Crucially, the global push towards sustainable agricultural practices is a major catalyst, as plant growth chambers become increasingly vital tools for maximizing yields while minimizing environmental impact within CEA facilities. The growing need for year-round food production, independent of climatic conditions, further contributes to this upward trajectory.
Challenges in the Plant Growth Chamber Market
Long-term growth will depend on addressing the high initial investment costs through financing options and leasing programs. Strategic partnerships between manufacturers and research institutions can foster the development of innovative technologies and applications. Expanding into emerging markets with strong agricultural sectors will further stimulate long-term growth and create new opportunities.
Emerging Opportunities in Plant Growth Chamber Market
Emerging opportunities exist in developing tailored plant growth chambers for specific crops and research applications. The integration of artificial intelligence (AI) and machine learning (ML) for predictive modeling and optimization of growth conditions presents significant potential. Moreover, the expansion into new markets, such as developing countries with growing agricultural sectors, offers significant growth prospects.
Leading Players in the Plant Growth Chamber Market Sector
- Weiss Techni
- Darwin Chambers
- Thermo Fisher
- CARON Products & Services Inc
- Conviron
- Aralab
- Percival Scientific Inc
- Brs Bvba
- BINDER GmbH
- Hettich Benelux BV
- Saveer Biotech Limited
- Freezers India
Key Milestones in Plant Growth Chamber Market Industry
- January 2022: Conviron's launch of its EVO series plant growth chambers marked a significant advancement, enhancing spatial uniformity of environmental conditions and accommodating a wider range of plant heights. This innovation significantly boosted Conviron's market competitiveness.
- August 2021: Caron's acquisition of Bigneat expanded its product portfolio and market reach within the life sciences sector, strengthening its position as a major player and broadening its customer base.
- May 2021: The merger of Weiss Umwelttechnik GmbH and Vötsch Industrietechnik GmbH created a powerful new entity in the plant growth chamber market, leveraging combined R&D capabilities and a significantly expanded market presence. This consolidation reshaped the competitive landscape.
- [Add another recent milestone here – e.g., a new product launch, a significant partnership, or a major market entry] Example: October 2023: [Company Name] introduced a new AI-powered growth chamber control system, significantly improving automation and yield optimization.
Strategic Outlook for Plant Growth Chamber Market
The Plant Growth Chamber market is projected to experience continued, robust growth, driven by the synergistic effects of technological innovation, increased research and development investment, and the global expansion of controlled environment agriculture. Companies strategically investing in cutting-edge research and development, fostering strategic partnerships to expand market reach, and proactively penetrating new geographical markets will be best positioned to capitalize on this substantial market opportunity. A particular focus on energy efficiency, advanced automation, and seamless data analytics integration will be paramount for achieving sustained success in this dynamic and rapidly evolving market. The integration of artificial intelligence and machine learning for predictive modeling and optimized control will further differentiate market leaders.
Plant Growth Chamber Market Segmentation
- 1. Production Analysis
- 2. Consumption Analysis
- 3. Import Market Analysis (Value & Volume)
- 4. Export Market Analysis (Value & Volume)
- 5. Price Trend Analysis
Plant Growth Chamber Market Segmentation By Geography
-
1. North America
- 1.1. United States
- 1.2. Canada
- 1.3. Mexico
-
2. South America
- 2.1. Brazil
- 2.2. Argentina
- 2.3. Rest of South America
-
3. Europe
- 3.1. United Kingdom
- 3.2. Germany
- 3.3. France
- 3.4. Italy
- 3.5. Spain
- 3.6. Russia
- 3.7. Benelux
- 3.8. Nordics
- 3.9. Rest of Europe
-
4. Middle East & Africa
- 4.1. Turkey
- 4.2. Israel
- 4.3. GCC
- 4.4. North Africa
- 4.5. South Africa
- 4.6. Rest of Middle East & Africa
-
5. Asia Pacific
- 5.1. China
- 5.2. India
- 5.3. Japan
- 5.4. South Korea
- 5.5. ASEAN
- 5.6. Oceania
- 5.7. Rest of Asia Pacific
Plant Growth Chamber Market Regional Market Share
Geographic Coverage of Plant Growth Chamber Market
Plant Growth Chamber Market REPORT HIGHLIGHTS
| Aspects | Details |
|---|---|
| Study Period | 2020-2034 |
| Base Year | 2025 |
| Estimated Year | 2026 |
| Forecast Period | 2026-2034 |
| Historical Period | 2020-2025 |
| Growth Rate | CAGR of 4.70% from 2020-2034 |
| Segmentation |
|
Table of Contents
- 1. Introduction
- 1.1. Research Scope
- 1.2. Market Segmentation
- 1.3. Research Objective
- 1.4. Definitions and Assumptions
- 2. Executive Summary
- 2.1. Market Snapshot
- 3. Market Dynamics
- 3.1. Market Drivers
- 3.2. Market Restrains
- 3.3. Market Trends
- 3.4. Market Opportunities
- 4. Market Factor Analysis
- 4.1. Porters Five Forces
- 4.1.1. Bargaining Power of Suppliers
- 4.1.2. Bargaining Power of Buyers
- 4.1.3. Threat of New Entrants
- 4.1.4. Threat of Substitutes
- 4.1.5. Competitive Rivalry
- 4.2. PESTEL analysis
- 4.3. BCG Analysis
- 4.3.1. Stars (High Growth, High Market Share)
- 4.3.2. Cash Cows (Low Growth, High Market Share)
- 4.3.3. Question Mark (High Growth, Low Market Share)
- 4.3.4. Dogs (Low Growth, Low Market Share)
- 4.4. Ansoff Matrix Analysis
- 4.5. Supply Chain Analysis
- 4.6. Regulatory Landscape
- 4.7. Current Market Potential and Opportunity Assessment (TAM–SAM–SOM Framework)
- 4.8. MSR Analyst Note
- 4.1. Porters Five Forces
- 5. Market Analysis, Insights and Forecast 2021-2033
- 5.1. Market Analysis, Insights and Forecast - by Production Analysis
- 5.2. Market Analysis, Insights and Forecast - by Consumption Analysis
- 5.3. Market Analysis, Insights and Forecast - by Import Market Analysis (Value & Volume)
- 5.4. Market Analysis, Insights and Forecast - by Export Market Analysis (Value & Volume)
- 5.5. Market Analysis, Insights and Forecast - by Price Trend Analysis
- 5.6. Market Analysis, Insights and Forecast - by Region
- 5.6.1. North America
- 5.6.2. South America
- 5.6.3. Europe
- 5.6.4. Middle East & Africa
- 5.6.5. Asia Pacific
- 6. Global Plant Growth Chamber Market Analysis, Insights and Forecast, 2021-2033
- 6.1. Market Analysis, Insights and Forecast - by Production Analysis
- 6.2. Market Analysis, Insights and Forecast - by Consumption Analysis
- 6.3. Market Analysis, Insights and Forecast - by Import Market Analysis (Value & Volume)
- 6.4. Market Analysis, Insights and Forecast - by Export Market Analysis (Value & Volume)
- 6.5. Market Analysis, Insights and Forecast - by Price Trend Analysis
- 7. North America Plant Growth Chamber Market Analysis, Insights and Forecast, 2020-2032
- 7.1. Market Analysis, Insights and Forecast - by Production Analysis
- 7.2. Market Analysis, Insights and Forecast - by Consumption Analysis
- 7.3. Market Analysis, Insights and Forecast - by Import Market Analysis (Value & Volume)
- 7.4. Market Analysis, Insights and Forecast - by Export Market Analysis (Value & Volume)
- 7.5. Market Analysis, Insights and Forecast - by Price Trend Analysis
- 8. South America Plant Growth Chamber Market Analysis, Insights and Forecast, 2020-2032
- 8.1. Market Analysis, Insights and Forecast - by Production Analysis
- 8.2. Market Analysis, Insights and Forecast - by Consumption Analysis
- 8.3. Market Analysis, Insights and Forecast - by Import Market Analysis (Value & Volume)
- 8.4. Market Analysis, Insights and Forecast - by Export Market Analysis (Value & Volume)
- 8.5. Market Analysis, Insights and Forecast - by Price Trend Analysis
- 9. Europe Plant Growth Chamber Market Analysis, Insights and Forecast, 2020-2032
- 9.1. Market Analysis, Insights and Forecast - by Production Analysis
- 9.2. Market Analysis, Insights and Forecast - by Consumption Analysis
- 9.3. Market Analysis, Insights and Forecast - by Import Market Analysis (Value & Volume)
- 9.4. Market Analysis, Insights and Forecast - by Export Market Analysis (Value & Volume)
- 9.5. Market Analysis, Insights and Forecast - by Price Trend Analysis
- 10. Middle East & Africa Plant Growth Chamber Market Analysis, Insights and Forecast, 2020-2032
- 10.1. Market Analysis, Insights and Forecast - by Production Analysis
- 10.2. Market Analysis, Insights and Forecast - by Consumption Analysis
- 10.3. Market Analysis, Insights and Forecast - by Import Market Analysis (Value & Volume)
- 10.4. Market Analysis, Insights and Forecast - by Export Market Analysis (Value & Volume)
- 10.5. Market Analysis, Insights and Forecast - by Price Trend Analysis
- 11. Asia Pacific Plant Growth Chamber Market Analysis, Insights and Forecast, 2020-2032
- 11.1. Market Analysis, Insights and Forecast - by Production Analysis
- 11.2. Market Analysis, Insights and Forecast - by Consumption Analysis
- 11.3. Market Analysis, Insights and Forecast - by Import Market Analysis (Value & Volume)
- 11.4. Market Analysis, Insights and Forecast - by Export Market Analysis (Value & Volume)
- 11.5. Market Analysis, Insights and Forecast - by Price Trend Analysis
- 12. Competitive Analysis
- 12.1. Company Profiles
- 12.1.1 Weiss Techni
- 12.1.1.1. Company Overview
- 12.1.1.2. Products
- 12.1.1.3. Company Financials
- 12.1.1.4. SWOT Analysis
- 12.1.2 Darwin Chambers
- 12.1.2.1. Company Overview
- 12.1.2.2. Products
- 12.1.2.3. Company Financials
- 12.1.2.4. SWOT Analysis
- 12.1.3 Thermo Fisher
- 12.1.3.1. Company Overview
- 12.1.3.2. Products
- 12.1.3.3. Company Financials
- 12.1.3.4. SWOT Analysis
- 12.1.4 CARON Products & Services Inc
- 12.1.4.1. Company Overview
- 12.1.4.2. Products
- 12.1.4.3. Company Financials
- 12.1.4.4. SWOT Analysis
- 12.1.5 Conviron
- 12.1.5.1. Company Overview
- 12.1.5.2. Products
- 12.1.5.3. Company Financials
- 12.1.5.4. SWOT Analysis
- 12.1.6 Aralab
- 12.1.6.1. Company Overview
- 12.1.6.2. Products
- 12.1.6.3. Company Financials
- 12.1.6.4. SWOT Analysis
- 12.1.7 Percival Scientific Inc
- 12.1.7.1. Company Overview
- 12.1.7.2. Products
- 12.1.7.3. Company Financials
- 12.1.7.4. SWOT Analysis
- 12.1.8 Brs Bvba
- 12.1.8.1. Company Overview
- 12.1.8.2. Products
- 12.1.8.3. Company Financials
- 12.1.8.4. SWOT Analysis
- 12.1.9 BINDER GmbH
- 12.1.9.1. Company Overview
- 12.1.9.2. Products
- 12.1.9.3. Company Financials
- 12.1.9.4. SWOT Analysis
- 12.1.10 Hettich Benelux BV
- 12.1.10.1. Company Overview
- 12.1.10.2. Products
- 12.1.10.3. Company Financials
- 12.1.10.4. SWOT Analysis
- 12.1.11 Saveer Biotech Limited
- 12.1.11.1. Company Overview
- 12.1.11.2. Products
- 12.1.11.3. Company Financials
- 12.1.11.4. SWOT Analysis
- 12.1.12 Freezers India
- 12.1.12.1. Company Overview
- 12.1.12.2. Products
- 12.1.12.3. Company Financials
- 12.1.12.4. SWOT Analysis
- 12.1.1 Weiss Techni
- 12.2. Market Entropy
- 12.2.1 Company's Key Areas Served
- 12.2.2 Recent Developments
- 12.3. Company Market Share Analysis 2025
- 12.3.1 Top 5 Companies Market Share Analysis
- 12.3.2 Top 3 Companies Market Share Analysis
- 12.4. List of Potential Customers
- 13. Research Methodology
List of Figures
- Figure 1: Global Plant Growth Chamber Market Revenue Breakdown (Million, %) by Region 2025 & 2033
- Figure 2: North America Plant Growth Chamber Market Revenue (Million), by Production Analysis 2025 & 2033
- Figure 3: North America Plant Growth Chamber Market Revenue Share (%), by Production Analysis 2025 & 2033
- Figure 4: North America Plant Growth Chamber Market Revenue (Million), by Consumption Analysis 2025 & 2033
- Figure 5: North America Plant Growth Chamber Market Revenue Share (%), by Consumption Analysis 2025 & 2033
- Figure 6: North America Plant Growth Chamber Market Revenue (Million), by Import Market Analysis (Value & Volume) 2025 & 2033
- Figure 7: North America Plant Growth Chamber Market Revenue Share (%), by Import Market Analysis (Value & Volume) 2025 & 2033
- Figure 8: North America Plant Growth Chamber Market Revenue (Million), by Export Market Analysis (Value & Volume) 2025 & 2033
- Figure 9: North America Plant Growth Chamber Market Revenue Share (%), by Export Market Analysis (Value & Volume) 2025 & 2033
- Figure 10: North America Plant Growth Chamber Market Revenue (Million), by Price Trend Analysis 2025 & 2033
- Figure 11: North America Plant Growth Chamber Market Revenue Share (%), by Price Trend Analysis 2025 & 2033
- Figure 12: North America Plant Growth Chamber Market Revenue (Million), by Country 2025 & 2033
- Figure 13: North America Plant Growth Chamber Market Revenue Share (%), by Country 2025 & 2033
- Figure 14: South America Plant Growth Chamber Market Revenue (Million), by Production Analysis 2025 & 2033
- Figure 15: South America Plant Growth Chamber Market Revenue Share (%), by Production Analysis 2025 & 2033
- Figure 16: South America Plant Growth Chamber Market Revenue (Million), by Consumption Analysis 2025 & 2033
- Figure 17: South America Plant Growth Chamber Market Revenue Share (%), by Consumption Analysis 2025 & 2033
- Figure 18: South America Plant Growth Chamber Market Revenue (Million), by Import Market Analysis (Value & Volume) 2025 & 2033
- Figure 19: South America Plant Growth Chamber Market Revenue Share (%), by Import Market Analysis (Value & Volume) 2025 & 2033
- Figure 20: South America Plant Growth Chamber Market Revenue (Million), by Export Market Analysis (Value & Volume) 2025 & 2033
- Figure 21: South America Plant Growth Chamber Market Revenue Share (%), by Export Market Analysis (Value & Volume) 2025 & 2033
- Figure 22: South America Plant Growth Chamber Market Revenue (Million), by Price Trend Analysis 2025 & 2033
- Figure 23: South America Plant Growth Chamber Market Revenue Share (%), by Price Trend Analysis 2025 & 2033
- Figure 24: South America Plant Growth Chamber Market Revenue (Million), by Country 2025 & 2033
- Figure 25: South America Plant Growth Chamber Market Revenue Share (%), by Country 2025 & 2033
- Figure 26: Europe Plant Growth Chamber Market Revenue (Million), by Production Analysis 2025 & 2033
- Figure 27: Europe Plant Growth Chamber Market Revenue Share (%), by Production Analysis 2025 & 2033
- Figure 28: Europe Plant Growth Chamber Market Revenue (Million), by Consumption Analysis 2025 & 2033
- Figure 29: Europe Plant Growth Chamber Market Revenue Share (%), by Consumption Analysis 2025 & 2033
- Figure 30: Europe Plant Growth Chamber Market Revenue (Million), by Import Market Analysis (Value & Volume) 2025 & 2033
- Figure 31: Europe Plant Growth Chamber Market Revenue Share (%), by Import Market Analysis (Value & Volume) 2025 & 2033
- Figure 32: Europe Plant Growth Chamber Market Revenue (Million), by Export Market Analysis (Value & Volume) 2025 & 2033
- Figure 33: Europe Plant Growth Chamber Market Revenue Share (%), by Export Market Analysis (Value & Volume) 2025 & 2033
- Figure 34: Europe Plant Growth Chamber Market Revenue (Million), by Price Trend Analysis 2025 & 2033
- Figure 35: Europe Plant Growth Chamber Market Revenue Share (%), by Price Trend Analysis 2025 & 2033
- Figure 36: Europe Plant Growth Chamber Market Revenue (Million), by Country 2025 & 2033
- Figure 37: Europe Plant Growth Chamber Market Revenue Share (%), by Country 2025 & 2033
- Figure 38: Middle East & Africa Plant Growth Chamber Market Revenue (Million), by Production Analysis 2025 & 2033
- Figure 39: Middle East & Africa Plant Growth Chamber Market Revenue Share (%), by Production Analysis 2025 & 2033
- Figure 40: Middle East & Africa Plant Growth Chamber Market Revenue (Million), by Consumption Analysis 2025 & 2033
- Figure 41: Middle East & Africa Plant Growth Chamber Market Revenue Share (%), by Consumption Analysis 2025 & 2033
- Figure 42: Middle East & Africa Plant Growth Chamber Market Revenue (Million), by Import Market Analysis (Value & Volume) 2025 & 2033
- Figure 43: Middle East & Africa Plant Growth Chamber Market Revenue Share (%), by Import Market Analysis (Value & Volume) 2025 & 2033
- Figure 44: Middle East & Africa Plant Growth Chamber Market Revenue (Million), by Export Market Analysis (Value & Volume) 2025 & 2033
- Figure 45: Middle East & Africa Plant Growth Chamber Market Revenue Share (%), by Export Market Analysis (Value & Volume) 2025 & 2033
- Figure 46: Middle East & Africa Plant Growth Chamber Market Revenue (Million), by Price Trend Analysis 2025 & 2033
- Figure 47: Middle East & Africa Plant Growth Chamber Market Revenue Share (%), by Price Trend Analysis 2025 & 2033
- Figure 48: Middle East & Africa Plant Growth Chamber Market Revenue (Million), by Country 2025 & 2033
- Figure 49: Middle East & Africa Plant Growth Chamber Market Revenue Share (%), by Country 2025 & 2033
- Figure 50: Asia Pacific Plant Growth Chamber Market Revenue (Million), by Production Analysis 2025 & 2033
- Figure 51: Asia Pacific Plant Growth Chamber Market Revenue Share (%), by Production Analysis 2025 & 2033
- Figure 52: Asia Pacific Plant Growth Chamber Market Revenue (Million), by Consumption Analysis 2025 & 2033
- Figure 53: Asia Pacific Plant Growth Chamber Market Revenue Share (%), by Consumption Analysis 2025 & 2033
- Figure 54: Asia Pacific Plant Growth Chamber Market Revenue (Million), by Import Market Analysis (Value & Volume) 2025 & 2033
- Figure 55: Asia Pacific Plant Growth Chamber Market Revenue Share (%), by Import Market Analysis (Value & Volume) 2025 & 2033
- Figure 56: Asia Pacific Plant Growth Chamber Market Revenue (Million), by Export Market Analysis (Value & Volume) 2025 & 2033
- Figure 57: Asia Pacific Plant Growth Chamber Market Revenue Share (%), by Export Market Analysis (Value & Volume) 2025 & 2033
- Figure 58: Asia Pacific Plant Growth Chamber Market Revenue (Million), by Price Trend Analysis 2025 & 2033
- Figure 59: Asia Pacific Plant Growth Chamber Market Revenue Share (%), by Price Trend Analysis 2025 & 2033
- Figure 60: Asia Pacific Plant Growth Chamber Market Revenue (Million), by Country 2025 & 2033
- Figure 61: Asia Pacific Plant Growth Chamber Market Revenue Share (%), by Country 2025 & 2033
List of Tables
- Table 1: Global Plant Growth Chamber Market Revenue Million Forecast, by Production Analysis 2020 & 2033
- Table 2: Global Plant Growth Chamber Market Revenue Million Forecast, by Consumption Analysis 2020 & 2033
- Table 3: Global Plant Growth Chamber Market Revenue Million Forecast, by Import Market Analysis (Value & Volume) 2020 & 2033
- Table 4: Global Plant Growth Chamber Market Revenue Million Forecast, by Export Market Analysis (Value & Volume) 2020 & 2033
- Table 5: Global Plant Growth Chamber Market Revenue Million Forecast, by Price Trend Analysis 2020 & 2033
- Table 6: Global Plant Growth Chamber Market Revenue Million Forecast, by Region 2020 & 2033
- Table 7: Global Plant Growth Chamber Market Revenue Million Forecast, by Production Analysis 2020 & 2033
- Table 8: Global Plant Growth Chamber Market Revenue Million Forecast, by Consumption Analysis 2020 & 2033
- Table 9: Global Plant Growth Chamber Market Revenue Million Forecast, by Import Market Analysis (Value & Volume) 2020 & 2033
- Table 10: Global Plant Growth Chamber Market Revenue Million Forecast, by Export Market Analysis (Value & Volume) 2020 & 2033
- Table 11: Global Plant Growth Chamber Market Revenue Million Forecast, by Price Trend Analysis 2020 & 2033
- Table 12: Global Plant Growth Chamber Market Revenue Million Forecast, by Country 2020 & 2033
- Table 13: United States Plant Growth Chamber Market Revenue (Million) Forecast, by Application 2020 & 2033
- Table 14: Canada Plant Growth Chamber Market Revenue (Million) Forecast, by Application 2020 & 2033
- Table 15: Mexico Plant Growth Chamber Market Revenue (Million) Forecast, by Application 2020 & 2033
- Table 16: Global Plant Growth Chamber Market Revenue Million Forecast, by Production Analysis 2020 & 2033
- Table 17: Global Plant Growth Chamber Market Revenue Million Forecast, by Consumption Analysis 2020 & 2033
- Table 18: Global Plant Growth Chamber Market Revenue Million Forecast, by Import Market Analysis (Value & Volume) 2020 & 2033
- Table 19: Global Plant Growth Chamber Market Revenue Million Forecast, by Export Market Analysis (Value & Volume) 2020 & 2033
- Table 20: Global Plant Growth Chamber Market Revenue Million Forecast, by Price Trend Analysis 2020 & 2033
- Table 21: Global Plant Growth Chamber Market Revenue Million Forecast, by Country 2020 & 2033
- Table 22: Brazil Plant Growth Chamber Market Revenue (Million) Forecast, by Application 2020 & 2033
- Table 23: Argentina Plant Growth Chamber Market Revenue (Million) Forecast, by Application 2020 & 2033
- Table 24: Rest of South America Plant Growth Chamber Market Revenue (Million) Forecast, by Application 2020 & 2033
- Table 25: Global Plant Growth Chamber Market Revenue Million Forecast, by Production Analysis 2020 & 2033
- Table 26: Global Plant Growth Chamber Market Revenue Million Forecast, by Consumption Analysis 2020 & 2033
- Table 27: Global Plant Growth Chamber Market Revenue Million Forecast, by Import Market Analysis (Value & Volume) 2020 & 2033
- Table 28: Global Plant Growth Chamber Market Revenue Million Forecast, by Export Market Analysis (Value & Volume) 2020 & 2033
- Table 29: Global Plant Growth Chamber Market Revenue Million Forecast, by Price Trend Analysis 2020 & 2033
- Table 30: Global Plant Growth Chamber Market Revenue Million Forecast, by Country 2020 & 2033
- Table 31: United Kingdom Plant Growth Chamber Market Revenue (Million) Forecast, by Application 2020 & 2033
- Table 32: Germany Plant Growth Chamber Market Revenue (Million) Forecast, by Application 2020 & 2033
- Table 33: France Plant Growth Chamber Market Revenue (Million) Forecast, by Application 2020 & 2033
- Table 34: Italy Plant Growth Chamber Market Revenue (Million) Forecast, by Application 2020 & 2033
- Table 35: Spain Plant Growth Chamber Market Revenue (Million) Forecast, by Application 2020 & 2033
- Table 36: Russia Plant Growth Chamber Market Revenue (Million) Forecast, by Application 2020 & 2033
- Table 37: Benelux Plant Growth Chamber Market Revenue (Million) Forecast, by Application 2020 & 2033
- Table 38: Nordics Plant Growth Chamber Market Revenue (Million) Forecast, by Application 2020 & 2033
- Table 39: Rest of Europe Plant Growth Chamber Market Revenue (Million) Forecast, by Application 2020 & 2033
- Table 40: Global Plant Growth Chamber Market Revenue Million Forecast, by Production Analysis 2020 & 2033
- Table 41: Global Plant Growth Chamber Market Revenue Million Forecast, by Consumption Analysis 2020 & 2033
- Table 42: Global Plant Growth Chamber Market Revenue Million Forecast, by Import Market Analysis (Value & Volume) 2020 & 2033
- Table 43: Global Plant Growth Chamber Market Revenue Million Forecast, by Export Market Analysis (Value & Volume) 2020 & 2033
- Table 44: Global Plant Growth Chamber Market Revenue Million Forecast, by Price Trend Analysis 2020 & 2033
- Table 45: Global Plant Growth Chamber Market Revenue Million Forecast, by Country 2020 & 2033
- Table 46: Turkey Plant Growth Chamber Market Revenue (Million) Forecast, by Application 2020 & 2033
- Table 47: Israel Plant Growth Chamber Market Revenue (Million) Forecast, by Application 2020 & 2033
- Table 48: GCC Plant Growth Chamber Market Revenue (Million) Forecast, by Application 2020 & 2033
- Table 49: North Africa Plant Growth Chamber Market Revenue (Million) Forecast, by Application 2020 & 2033
- Table 50: South Africa Plant Growth Chamber Market Revenue (Million) Forecast, by Application 2020 & 2033
- Table 51: Rest of Middle East & Africa Plant Growth Chamber Market Revenue (Million) Forecast, by Application 2020 & 2033
- Table 52: Global Plant Growth Chamber Market Revenue Million Forecast, by Production Analysis 2020 & 2033
- Table 53: Global Plant Growth Chamber Market Revenue Million Forecast, by Consumption Analysis 2020 & 2033
- Table 54: Global Plant Growth Chamber Market Revenue Million Forecast, by Import Market Analysis (Value & Volume) 2020 & 2033
- Table 55: Global Plant Growth Chamber Market Revenue Million Forecast, by Export Market Analysis (Value & Volume) 2020 & 2033
- Table 56: Global Plant Growth Chamber Market Revenue Million Forecast, by Price Trend Analysis 2020 & 2033
- Table 57: Global Plant Growth Chamber Market Revenue Million Forecast, by Country 2020 & 2033
- Table 58: China Plant Growth Chamber Market Revenue (Million) Forecast, by Application 2020 & 2033
- Table 59: India Plant Growth Chamber Market Revenue (Million) Forecast, by Application 2020 & 2033
- Table 60: Japan Plant Growth Chamber Market Revenue (Million) Forecast, by Application 2020 & 2033
- Table 61: South Korea Plant Growth Chamber Market Revenue (Million) Forecast, by Application 2020 & 2033
- Table 62: ASEAN Plant Growth Chamber Market Revenue (Million) Forecast, by Application 2020 & 2033
- Table 63: Oceania Plant Growth Chamber Market Revenue (Million) Forecast, by Application 2020 & 2033
- Table 64: Rest of Asia Pacific Plant Growth Chamber Market Revenue (Million) Forecast, by Application 2020 & 2033
Frequently Asked Questions
1. What is the projected Compound Annual Growth Rate (CAGR) of the Plant Growth Chamber Market?
The projected CAGR is approximately 4.70%.
2. Which companies are prominent players in the Plant Growth Chamber Market?
Key companies in the market include Weiss Techni, Darwin Chambers, Thermo Fisher, CARON Products & Services Inc, Conviron, Aralab, Percival Scientific Inc, Brs Bvba, BINDER GmbH, Hettich Benelux BV, Saveer Biotech Limited, Freezers India.
3. What are the main segments of the Plant Growth Chamber Market?
The market segments include Production Analysis, Consumption Analysis, Import Market Analysis (Value & Volume), Export Market Analysis (Value & Volume), Price Trend Analysis.
4. Can you provide details about the market size?
The market size is estimated to be USD 486.60 Million as of 2022.
5. What are some drivers contributing to market growth?
Seed Treatment As A Solution To Enhance Yield; Growing Awareness For Seed Treatment Among The Farmers; Rising Trend Of Organic Farming.
6. What are the notable trends driving market growth?
Increasing Demand for Food and Decreasing Arable Land.
7. Are there any restraints impacting market growth?
Limitations Across Farm-Level Seed Treatment; Rising Environmental Concerns.
8. Can you provide examples of recent developments in the market?
January 2022: Conviron launched a new EVO series of plant growth chambers, featuring a range of LE intensities, delivering a high degree of spatial uniformity for plant growth suitable for both short, medium, and tall plants.
9. What pricing options are available for accessing the report?
Pricing options include single-user, multi-user, and enterprise licenses priced at USD 4750, USD 5250, and USD 8750 respectively.
10. Is the market size provided in terms of value or volume?
The market size is provided in terms of value, measured in Million.
11. Are there any specific market keywords associated with the report?
Yes, the market keyword associated with the report is "Plant Growth Chamber Market," which aids in identifying and referencing the specific market segment covered.
12. How do I determine which pricing option suits my needs best?
The pricing options vary based on user requirements and access needs. Individual users may opt for single-user licenses, while businesses requiring broader access may choose multi-user or enterprise licenses for cost-effective access to the report.
13. Are there any additional resources or data provided in the Plant Growth Chamber Market report?
While the report offers comprehensive insights, it's advisable to review the specific contents or supplementary materials provided to ascertain if additional resources or data are available.
14. How can I stay updated on further developments or reports in the Plant Growth Chamber Market?
To stay informed about further developments, trends, and reports in the Plant Growth Chamber Market, consider subscribing to industry newsletters, following relevant companies and organizations, or regularly checking reputable industry news sources and publications.
Methodology
Step 1 - Identification of Relevant Samples Size from Population Database


Step 2 - Approaches for Defining Global Market Size (Value, Volume* & Price*)

Note*: In applicable scenarios
Step 3 - Data Sources
Primary Research
- Web Analytics
- Survey Reports
- Research Institute
- Latest Research Reports
- Opinion Leaders
Secondary Research
- Annual Reports
- White Paper
- Latest Press Release
- Industry Association
- Paid Database
- Investor Presentations

Step 4 - Data Triangulation
Involves using different sources of information in order to increase the validity of a study
These sources are likely to be stakeholders in a program - participants, other researchers, program staff, other community members, and so on.
Then we put all data in single framework & apply various statistical tools to find out the dynamic on the market.
During the analysis stage, feedback from the stakeholder groups would be compared to determine areas of agreement as well as areas of divergence