

Key Insights
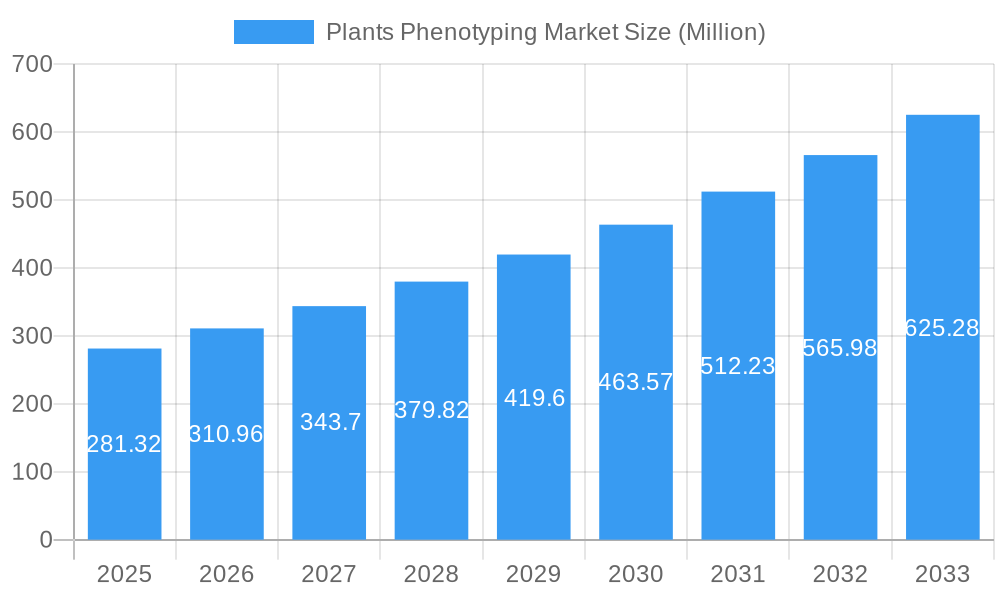
The global plants phenotyping market is experiencing robust growth, projected to reach \$281.32 million in 2025 and maintain a Compound Annual Growth Rate (CAGR) of 10.50% from 2025 to 2033. This expansion is driven by several key factors. Firstly, the increasing demand for high-throughput screening in agricultural research and development is fueling the adoption of automated phenotyping systems. These systems offer significant advantages in terms of speed, accuracy, and efficiency compared to traditional manual methods, allowing researchers to analyze larger datasets and accelerate crop improvement programs. Secondly, the rising prevalence of precision agriculture practices is driving the demand for advanced phenotyping technologies, including image analysis systems, multispectral cameras, and canopy analysis systems. These technologies enable farmers to monitor crop health and optimize resource management, leading to improved yields and reduced input costs. Furthermore, government initiatives promoting agricultural innovation and research are providing financial support and incentives for the development and adoption of phenotyping technologies, further stimulating market growth. The market is segmented by product type (equipment and software), automation type, application (e.g., high-throughput screening, trait identification), analysis system, site of use, and platform. The North American and European regions are currently the largest markets, but the Asia-Pacific region is expected to witness significant growth in the coming years due to increasing investment in agricultural research and the expanding adoption of advanced technologies.
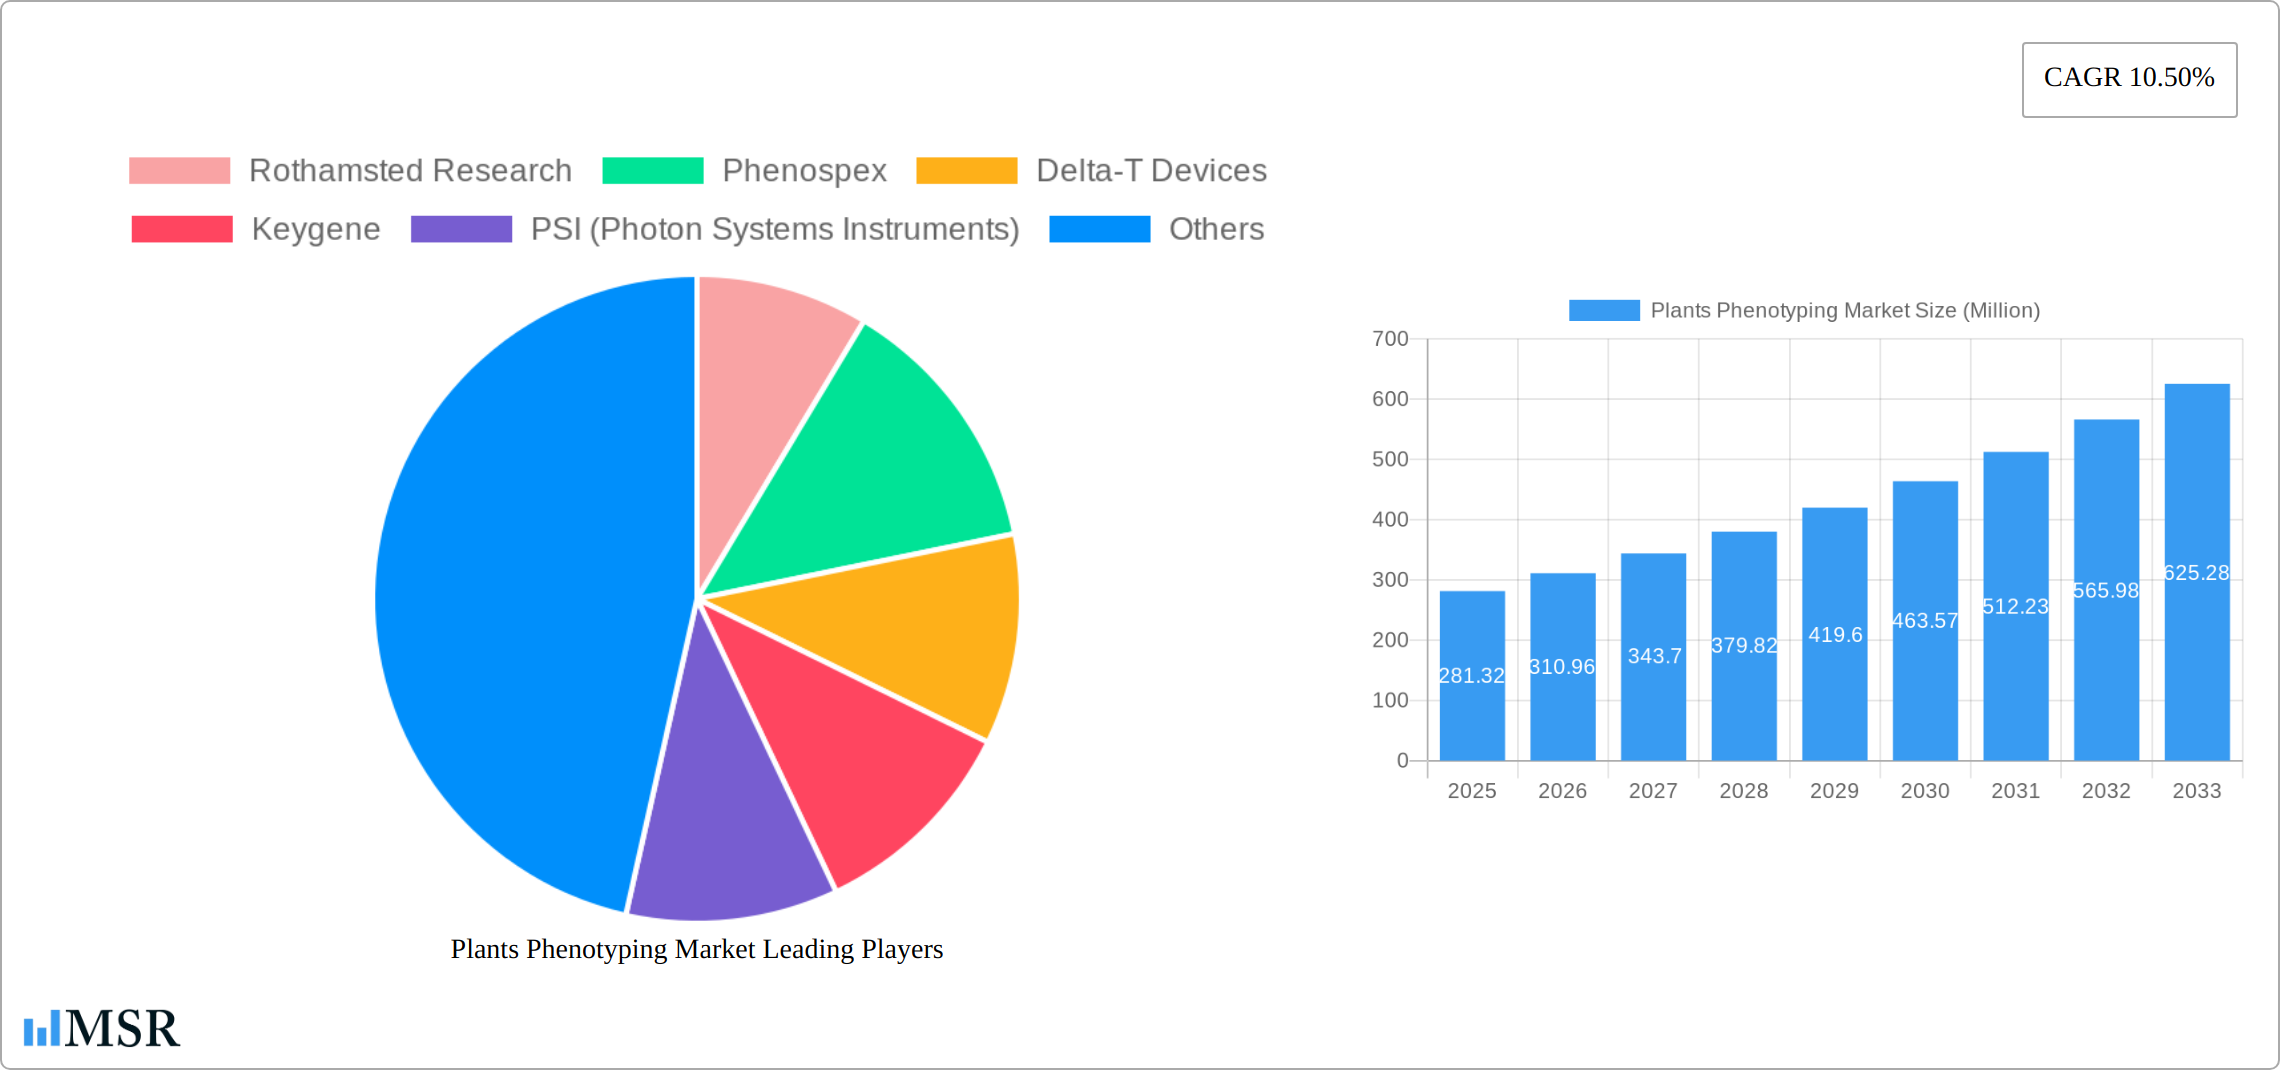
Plants Phenotyping Market Market Size (In Million)
The market's growth is not without challenges. High initial investment costs associated with advanced phenotyping systems can pose a barrier to entry for smaller research institutions and farms. The complexity of data analysis and the need for specialized expertise can also limit the wider adoption of these technologies. However, ongoing technological advancements, decreasing equipment costs, and the development of user-friendly software solutions are expected to mitigate these challenges over time. The increasing availability of cloud-based data analysis platforms is also streamlining the workflow and making the technology more accessible. Future growth will be influenced by innovations in sensor technology, improved data analytics capabilities, and the integration of artificial intelligence and machine learning for enhanced data interpretation and decision-making. The continued focus on improving crop yields and sustainability in the face of a growing global population will further propel market expansion.
Plants Phenotyping Market Company Market Share
Plants Phenotyping Market: A Comprehensive Report (2019-2033)
This in-depth report provides a comprehensive analysis of the Plants Phenotyping Market, offering invaluable insights for stakeholders across the agricultural technology and research sectors. The study period spans from 2019 to 2033, with 2025 serving as the base and estimated year. The forecast period covers 2025-2033, and the historical period encompasses 2019-2024. The market is segmented by various factors, including automation type, application, analysis system, site, platform, and product type (Equipment, Sensors, Software), and services (Measurement Acquisition & Data Analysis, Statistical Analysis). Key players analyzed include Rothamsted Research, Phenospex, Delta-T Devices, Keygene, PSI (Photon Systems Instruments), BASF SE (Crop Design), Heinz Walz GmbH, The Vienna Biocenter Core Facilities, LemnaTec GmbH, Phenomix, WP, and Qubit Systems. The report projects a market valued at xx Million in 2025, growing at a CAGR of xx% during the forecast period.
Plants Phenotyping Market Concentration & Dynamics
The Plants Phenotyping market demonstrates a moderately concentrated landscape, with several key players holding significant market share. However, the presence of numerous smaller companies and startups indicates a dynamic and competitive environment. Market share is distributed among established players like PSI (Photon Systems Instruments), Delta-T Devices, and LemnaTec GmbH, along with specialized providers focused on specific segments. The market is witnessing increased innovation driven by advancements in sensor technology, data analytics, and automation. Regulatory frameworks related to agricultural technology and data privacy are increasingly influencing market practices. Substitute products, such as traditional methods of plant assessment, are gradually losing ground to the efficiency and precision of phenotyping technologies.
- Market Share: PSI (Photon Systems Instruments) and Delta-T Devices are estimated to hold approximately xx% and xx% market share, respectively, in 2025. Other major players collectively hold approximately xx%.
- M&A Activity: The number of M&A deals within the Plants Phenotyping market has increased steadily over the past five years, with an estimated xx deals in 2024. This trend is expected to continue, driven by the need for larger companies to expand their technology portfolio and market reach.
- Innovation Ecosystem: A robust innovation ecosystem is developing, with collaborations between universities, research institutions (like Rothamsted Research), and private companies driving technological advancements.
- End-User Trends: The demand for high-throughput phenotyping solutions is increasing across research institutions, breeding programs, and agricultural businesses, as they seek to optimize crop production and improve crop resilience.
Plants Phenotyping Market Industry Insights & Trends
The Plants Phenotyping market is experiencing significant growth, driven by several factors. Increasing demand for high-yielding crops, coupled with the need to improve crop resilience to climate change and environmental stressors, is a major catalyst. Technological advancements in areas such as sensor technology (multispectral cameras, fluorometers), image analysis software, and automation are enhancing the speed, accuracy, and scalability of phenotyping. The market size reached xx Million in 2024 and is projected to reach xx Million by 2033, driven by a CAGR of xx%. The integration of artificial intelligence (AI) and machine learning (ML) is enhancing data analysis capabilities, leading to more precise insights into plant traits and performance. This adoption is expected to continue, supported by significant investments in research and development across the global agricultural sector. Evolving consumer preferences for sustainable and high-quality food products are indirectly boosting the demand for improved crop production technologies, further driving market growth.
Key Markets & Segments Leading Plants Phenotyping Market
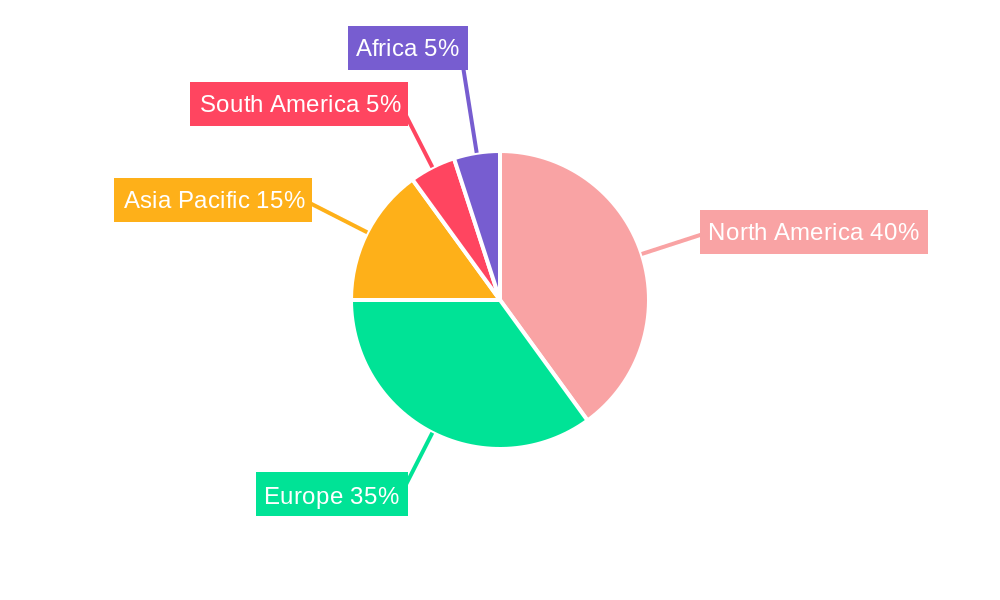
The global Plants Phenotyping market is experiencing robust growth, with North America currently holding the largest market share, followed closely by Europe and the Asia-Pacific region. This growth is largely driven by the increasing adoption of precision agriculture techniques and the burgeoning demand for efficient and sustainable food production methods. Within the market segmentation, Fully Automated systems are rapidly gaining traction due to their superior efficiency and scalability, particularly in High-Throughput Screening applications. This segment's dominance highlights the industry's focus on processing and analyzing large volumes of data to optimize crop yields and improve overall agricultural efficiency.
Key Growth Drivers:
- Precision Agriculture Adoption Surge: The widespread shift towards data-driven, precision agriculture practices is significantly boosting the demand for sophisticated phenotyping technologies.
- Sensor Technology Advancements: Continuous advancements in sensor technology, resulting in more sophisticated, accurate, and cost-effective sensors, are accelerating market expansion and enabling more comprehensive data acquisition.
- Government Support and Funding: Government initiatives worldwide are actively promoting agricultural innovation and sustainable farming practices, providing substantial funding and incentives for the development and implementation of phenotyping technologies.
- Robust R&D Investments: Significant research and development (R&D) investments from both public and private sectors are fueling technological advancements, leading to the introduction of innovative phenotyping solutions and expanding market penetration.
- Growing Need for Food Security: The global population is increasing, placing immense pressure on food production. Plants phenotyping offers a crucial tool to optimize yields and improve resource utilization, thereby contributing to food security.
Dominant Market Segments:
- By Automation Type: Fully automated systems are projected to maintain a substantial market share due to their high efficiency, reduced labor costs, and potential for increased throughput.
- By Application: High-Throughput Screening (HTS) applications continue to dominate the market due to the significant need for rapid, large-scale data analysis for plant breeding programs and genetic research.
- By Deployment Site: While field-based phenotyping is gaining prominence for its ability to capture real-world conditions, laboratory and greenhouse systems remain significant segments, offering controlled environments for precise experimentation and data collection.
- By Product Type: The market is largely dominated by equipment sales, followed by specialized software and sensor technologies. The increasing demand for integrated solutions is driving growth in this area.
- By Region: North America and Europe continue to lead the market due to their high adoption of advanced agricultural technologies and substantial investments in agricultural research and development. However, emerging economies in Asia-Pacific are exhibiting significant growth potential.
Plants Phenotyping Market Product Developments
Recent product developments are focused on improving the efficiency, accuracy, and ease of use of phenotyping systems. This includes advancements in sensor technology (e.g., hyperspectral imaging, thermal imaging), the development of user-friendly software platforms for data analysis, and the integration of AI and ML capabilities for improved data interpretation and decision-making. The development of more compact and portable systems is making phenotyping more accessible to researchers and farmers with limited resources. These innovations enable faster trait identification and improved crop management decisions.
Challenges in the Plants Phenotyping Market Market
The Plants Phenotyping market faces several challenges including high initial investment costs for sophisticated equipment, the need for specialized expertise to operate and interpret data, and the complexities associated with data management and analysis of large datasets. Regulatory hurdles concerning data privacy and the use of AI/ML in agriculture also pose challenges. Supply chain disruptions can impact the availability of components and equipment, potentially affecting production timelines. Competition among established players and new entrants further contributes to the overall complexity of the market.
Forces Driving Plants Phenotyping Market Growth
Several factors are driving market growth. These include the increasing demand for improved crop yields to meet the growing global food demands, the need to develop climate-resilient crops capable of withstanding environmental stressors, the continuous improvements in sensor technologies leading to more precise and efficient data acquisition, and the growing accessibility and affordability of high-throughput phenotyping systems. Government funding and initiatives aimed at promoting agricultural innovation are also contributing to market growth.
Long-Term Growth Catalysts in the Plants Phenotyping Market
Long-term growth will be driven by the increasing adoption of AI and ML for advanced data analysis, the development of more sophisticated and integrated phenotyping platforms, and the expansion of phenotyping applications beyond traditional crop research and development to areas like environmental monitoring and precision farming. Strategic partnerships between technology providers and agricultural businesses are expected to accelerate market growth.
Emerging Opportunities in Plants Phenotyping Market
The Plants Phenotyping market presents several exciting opportunities. The integration of drone technology for high-throughput field phenotyping is rapidly expanding, allowing for efficient and large-scale data acquisition. The development of specialized phenotyping solutions tailored to specific crops or plant types is another significant area of growth. Expanding into new geographic markets, particularly in developing economies, presents considerable potential. Cloud-based data management and analysis platforms are streamlining data processing and improving accessibility. Finally, the application of remote sensing technologies to monitor crop health and predict yields opens up new possibilities for precision agriculture.
Leading Players in the Plants Phenotyping Market Sector
- Rothamsted Research
- Phenospex
- Delta-T Devices
- Keygene
- PSI (Photon Systems Instruments)
- BASF SE (Crop Design)
- Heinz Walz GmbH
- The Vienna Biocenter Core Facilities
- LemnaTec GmbH
- Phenomix
- WP
- Qubit Systems
Key Milestones in Plants Phenotyping Market Industry
- 2020: LemnaTec launches a new high-throughput phenotyping platform.
- 2021: Several key players announce strategic partnerships to integrate AI/ML capabilities into their phenotyping solutions.
- 2022: Significant investments in R&D in this field were observed.
- 2023: New regulations related to data privacy were introduced in several countries, impacting market operations.
- 2024: Several successful M&A deals were reported, consolidating market share amongst major players.
Strategic Outlook for Plants Phenotyping Market Market
The Plants Phenotyping market holds significant future potential, driven by the growing demand for efficient and sustainable agricultural practices. Strategic opportunities exist in developing innovative solutions that address specific challenges within the agricultural sector, such as drought tolerance and disease resistance. Further expansion into developing economies and the integration of emerging technologies, like blockchain for data security and traceability, will create significant new opportunities for growth. The market is expected to continue its trajectory of growth, supported by ongoing technological advancements and increasing global demand for food security.
Plants Phenotyping Market Segmentation
- 1. Production Analysis
- 2. Consumption Analysis
- 3. Import Market Analysis (Value & Volume)
- 4. Export Market Analysis (Value & Volume)
- 5. Price Trend Analysis
Plants Phenotyping Market Segmentation By Geography
-
1. North America
- 1.1. United States
- 1.2. Canada
- 1.3. Mexico
-
2. South America
- 2.1. Brazil
- 2.2. Argentina
- 2.3. Rest of South America
-
3. Europe
- 3.1. United Kingdom
- 3.2. Germany
- 3.3. France
- 3.4. Italy
- 3.5. Spain
- 3.6. Russia
- 3.7. Benelux
- 3.8. Nordics
- 3.9. Rest of Europe
-
4. Middle East & Africa
- 4.1. Turkey
- 4.2. Israel
- 4.3. GCC
- 4.4. North Africa
- 4.5. South Africa
- 4.6. Rest of Middle East & Africa
-
5. Asia Pacific
- 5.1. China
- 5.2. India
- 5.3. Japan
- 5.4. South Korea
- 5.5. ASEAN
- 5.6. Oceania
- 5.7. Rest of Asia Pacific
Plants Phenotyping Market Regional Market Share
Geographic Coverage of Plants Phenotyping Market
Plants Phenotyping Market REPORT HIGHLIGHTS
| Aspects | Details |
|---|---|
| Study Period | 2020-2034 |
| Base Year | 2025 |
| Estimated Year | 2026 |
| Forecast Period | 2026-2034 |
| Historical Period | 2020-2025 |
| Growth Rate | CAGR of 10.50% from 2020-2034 |
| Segmentation |
|
Table of Contents
- 1. Introduction
- 1.1. Research Scope
- 1.2. Market Segmentation
- 1.3. Research Objective
- 1.4. Definitions and Assumptions
- 2. Executive Summary
- 2.1. Market Snapshot
- 3. Market Dynamics
- 3.1. Market Drivers
- 3.2. Market Restrains
- 3.3. Market Trends
- 3.4. Market Opportunities
- 4. Market Factor Analysis
- 4.1. Porters Five Forces
- 4.1.1. Bargaining Power of Suppliers
- 4.1.2. Bargaining Power of Buyers
- 4.1.3. Threat of New Entrants
- 4.1.4. Threat of Substitutes
- 4.1.5. Competitive Rivalry
- 4.2. PESTEL analysis
- 4.3. BCG Analysis
- 4.3.1. Stars (High Growth, High Market Share)
- 4.3.2. Cash Cows (Low Growth, High Market Share)
- 4.3.3. Question Mark (High Growth, Low Market Share)
- 4.3.4. Dogs (Low Growth, Low Market Share)
- 4.4. Ansoff Matrix Analysis
- 4.5. Supply Chain Analysis
- 4.6. Regulatory Landscape
- 4.7. Current Market Potential and Opportunity Assessment (TAM–SAM–SOM Framework)
- 4.8. MSR Analyst Note
- 4.1. Porters Five Forces
- 5. Market Analysis, Insights and Forecast 2021-2033
- 5.1. Market Analysis, Insights and Forecast - by Production Analysis
- 5.2. Market Analysis, Insights and Forecast - by Consumption Analysis
- 5.3. Market Analysis, Insights and Forecast - by Import Market Analysis (Value & Volume)
- 5.4. Market Analysis, Insights and Forecast - by Export Market Analysis (Value & Volume)
- 5.5. Market Analysis, Insights and Forecast - by Price Trend Analysis
- 5.6. Market Analysis, Insights and Forecast - by Region
- 5.6.1. North America
- 5.6.2. South America
- 5.6.3. Europe
- 5.6.4. Middle East & Africa
- 5.6.5. Asia Pacific
- 6. Global Plants Phenotyping Market Analysis, Insights and Forecast, 2021-2033
- 6.1. Market Analysis, Insights and Forecast - by Production Analysis
- 6.2. Market Analysis, Insights and Forecast - by Consumption Analysis
- 6.3. Market Analysis, Insights and Forecast - by Import Market Analysis (Value & Volume)
- 6.4. Market Analysis, Insights and Forecast - by Export Market Analysis (Value & Volume)
- 6.5. Market Analysis, Insights and Forecast - by Price Trend Analysis
- 7. North America Plants Phenotyping Market Analysis, Insights and Forecast, 2020-2032
- 7.1. Market Analysis, Insights and Forecast - by Production Analysis
- 7.2. Market Analysis, Insights and Forecast - by Consumption Analysis
- 7.3. Market Analysis, Insights and Forecast - by Import Market Analysis (Value & Volume)
- 7.4. Market Analysis, Insights and Forecast - by Export Market Analysis (Value & Volume)
- 7.5. Market Analysis, Insights and Forecast - by Price Trend Analysis
- 8. South America Plants Phenotyping Market Analysis, Insights and Forecast, 2020-2032
- 8.1. Market Analysis, Insights and Forecast - by Production Analysis
- 8.2. Market Analysis, Insights and Forecast - by Consumption Analysis
- 8.3. Market Analysis, Insights and Forecast - by Import Market Analysis (Value & Volume)
- 8.4. Market Analysis, Insights and Forecast - by Export Market Analysis (Value & Volume)
- 8.5. Market Analysis, Insights and Forecast - by Price Trend Analysis
- 9. Europe Plants Phenotyping Market Analysis, Insights and Forecast, 2020-2032
- 9.1. Market Analysis, Insights and Forecast - by Production Analysis
- 9.2. Market Analysis, Insights and Forecast - by Consumption Analysis
- 9.3. Market Analysis, Insights and Forecast - by Import Market Analysis (Value & Volume)
- 9.4. Market Analysis, Insights and Forecast - by Export Market Analysis (Value & Volume)
- 9.5. Market Analysis, Insights and Forecast - by Price Trend Analysis
- 10. Middle East & Africa Plants Phenotyping Market Analysis, Insights and Forecast, 2020-2032
- 10.1. Market Analysis, Insights and Forecast - by Production Analysis
- 10.2. Market Analysis, Insights and Forecast - by Consumption Analysis
- 10.3. Market Analysis, Insights and Forecast - by Import Market Analysis (Value & Volume)
- 10.4. Market Analysis, Insights and Forecast - by Export Market Analysis (Value & Volume)
- 10.5. Market Analysis, Insights and Forecast - by Price Trend Analysis
- 11. Asia Pacific Plants Phenotyping Market Analysis, Insights and Forecast, 2020-2032
- 11.1. Market Analysis, Insights and Forecast - by Production Analysis
- 11.2. Market Analysis, Insights and Forecast - by Consumption Analysis
- 11.3. Market Analysis, Insights and Forecast - by Import Market Analysis (Value & Volume)
- 11.4. Market Analysis, Insights and Forecast - by Export Market Analysis (Value & Volume)
- 11.5. Market Analysis, Insights and Forecast - by Price Trend Analysis
- 12. Competitive Analysis
- 12.1. Company Profiles
- 12.1.1 Rothamsted Research
- 12.1.1.1. Company Overview
- 12.1.1.2. Products
- 12.1.1.3. Company Financials
- 12.1.1.4. SWOT Analysis
- 12.1.2 Phenospex
- 12.1.2.1. Company Overview
- 12.1.2.2. Products
- 12.1.2.3. Company Financials
- 12.1.2.4. SWOT Analysis
- 12.1.3 Delta-T Devices
- 12.1.3.1. Company Overview
- 12.1.3.2. Products
- 12.1.3.3. Company Financials
- 12.1.3.4. SWOT Analysis
- 12.1.4 Keygene
- 12.1.4.1. Company Overview
- 12.1.4.2. Products
- 12.1.4.3. Company Financials
- 12.1.4.4. SWOT Analysis
- 12.1.5 PSI (Photon Systems Instruments)
- 12.1.5.1. Company Overview
- 12.1.5.2. Products
- 12.1.5.3. Company Financials
- 12.1.5.4. SWOT Analysis
- 12.1.6 BASF SE (Crop Design)
- 12.1.6.1. Company Overview
- 12.1.6.2. Products
- 12.1.6.3. Company Financials
- 12.1.6.4. SWOT Analysis
- 12.1.7 Heinz Walz GmbH
- 12.1.7.1. Company Overview
- 12.1.7.2. Products
- 12.1.7.3. Company Financials
- 12.1.7.4. SWOT Analysis
- 12.1.8 The Vienna Biocenter Core Facilities
- 12.1.8.1. Company Overview
- 12.1.8.2. Products
- 12.1.8.3. Company Financials
- 12.1.8.4. SWOT Analysis
- 12.1.9 LemnaTec GmbH
- 12.1.9.1. Company Overview
- 12.1.9.2. Products
- 12.1.9.3. Company Financials
- 12.1.9.4. SWOT Analysis
- 12.1.10 Phenomix
- 12.1.10.1. Company Overview
- 12.1.10.2. Products
- 12.1.10.3. Company Financials
- 12.1.10.4. SWOT Analysis
- 12.1.11 WP
- 12.1.11.1. Company Overview
- 12.1.11.2. Products
- 12.1.11.3. Company Financials
- 12.1.11.4. SWOT Analysis
- 12.1.12 Qubit Systems
- 12.1.12.1. Company Overview
- 12.1.12.2. Products
- 12.1.12.3. Company Financials
- 12.1.12.4. SWOT Analysis
- 12.1.1 Rothamsted Research
- 12.2. Market Entropy
- 12.2.1 Company's Key Areas Served
- 12.2.2 Recent Developments
- 12.3. Company Market Share Analysis 2025
- 12.3.1 Top 5 Companies Market Share Analysis
- 12.3.2 Top 3 Companies Market Share Analysis
- 12.4. List of Potential Customers
- 13. Research Methodology
List of Figures
- Figure 1: Global Plants Phenotyping Market Revenue Breakdown (Million, %) by Region 2025 & 2033
- Figure 2: North America Plants Phenotyping Market Revenue (Million), by Production Analysis 2025 & 2033
- Figure 3: North America Plants Phenotyping Market Revenue Share (%), by Production Analysis 2025 & 2033
- Figure 4: North America Plants Phenotyping Market Revenue (Million), by Consumption Analysis 2025 & 2033
- Figure 5: North America Plants Phenotyping Market Revenue Share (%), by Consumption Analysis 2025 & 2033
- Figure 6: North America Plants Phenotyping Market Revenue (Million), by Import Market Analysis (Value & Volume) 2025 & 2033
- Figure 7: North America Plants Phenotyping Market Revenue Share (%), by Import Market Analysis (Value & Volume) 2025 & 2033
- Figure 8: North America Plants Phenotyping Market Revenue (Million), by Export Market Analysis (Value & Volume) 2025 & 2033
- Figure 9: North America Plants Phenotyping Market Revenue Share (%), by Export Market Analysis (Value & Volume) 2025 & 2033
- Figure 10: North America Plants Phenotyping Market Revenue (Million), by Price Trend Analysis 2025 & 2033
- Figure 11: North America Plants Phenotyping Market Revenue Share (%), by Price Trend Analysis 2025 & 2033
- Figure 12: North America Plants Phenotyping Market Revenue (Million), by Country 2025 & 2033
- Figure 13: North America Plants Phenotyping Market Revenue Share (%), by Country 2025 & 2033
- Figure 14: South America Plants Phenotyping Market Revenue (Million), by Production Analysis 2025 & 2033
- Figure 15: South America Plants Phenotyping Market Revenue Share (%), by Production Analysis 2025 & 2033
- Figure 16: South America Plants Phenotyping Market Revenue (Million), by Consumption Analysis 2025 & 2033
- Figure 17: South America Plants Phenotyping Market Revenue Share (%), by Consumption Analysis 2025 & 2033
- Figure 18: South America Plants Phenotyping Market Revenue (Million), by Import Market Analysis (Value & Volume) 2025 & 2033
- Figure 19: South America Plants Phenotyping Market Revenue Share (%), by Import Market Analysis (Value & Volume) 2025 & 2033
- Figure 20: South America Plants Phenotyping Market Revenue (Million), by Export Market Analysis (Value & Volume) 2025 & 2033
- Figure 21: South America Plants Phenotyping Market Revenue Share (%), by Export Market Analysis (Value & Volume) 2025 & 2033
- Figure 22: South America Plants Phenotyping Market Revenue (Million), by Price Trend Analysis 2025 & 2033
- Figure 23: South America Plants Phenotyping Market Revenue Share (%), by Price Trend Analysis 2025 & 2033
- Figure 24: South America Plants Phenotyping Market Revenue (Million), by Country 2025 & 2033
- Figure 25: South America Plants Phenotyping Market Revenue Share (%), by Country 2025 & 2033
- Figure 26: Europe Plants Phenotyping Market Revenue (Million), by Production Analysis 2025 & 2033
- Figure 27: Europe Plants Phenotyping Market Revenue Share (%), by Production Analysis 2025 & 2033
- Figure 28: Europe Plants Phenotyping Market Revenue (Million), by Consumption Analysis 2025 & 2033
- Figure 29: Europe Plants Phenotyping Market Revenue Share (%), by Consumption Analysis 2025 & 2033
- Figure 30: Europe Plants Phenotyping Market Revenue (Million), by Import Market Analysis (Value & Volume) 2025 & 2033
- Figure 31: Europe Plants Phenotyping Market Revenue Share (%), by Import Market Analysis (Value & Volume) 2025 & 2033
- Figure 32: Europe Plants Phenotyping Market Revenue (Million), by Export Market Analysis (Value & Volume) 2025 & 2033
- Figure 33: Europe Plants Phenotyping Market Revenue Share (%), by Export Market Analysis (Value & Volume) 2025 & 2033
- Figure 34: Europe Plants Phenotyping Market Revenue (Million), by Price Trend Analysis 2025 & 2033
- Figure 35: Europe Plants Phenotyping Market Revenue Share (%), by Price Trend Analysis 2025 & 2033
- Figure 36: Europe Plants Phenotyping Market Revenue (Million), by Country 2025 & 2033
- Figure 37: Europe Plants Phenotyping Market Revenue Share (%), by Country 2025 & 2033
- Figure 38: Middle East & Africa Plants Phenotyping Market Revenue (Million), by Production Analysis 2025 & 2033
- Figure 39: Middle East & Africa Plants Phenotyping Market Revenue Share (%), by Production Analysis 2025 & 2033
- Figure 40: Middle East & Africa Plants Phenotyping Market Revenue (Million), by Consumption Analysis 2025 & 2033
- Figure 41: Middle East & Africa Plants Phenotyping Market Revenue Share (%), by Consumption Analysis 2025 & 2033
- Figure 42: Middle East & Africa Plants Phenotyping Market Revenue (Million), by Import Market Analysis (Value & Volume) 2025 & 2033
- Figure 43: Middle East & Africa Plants Phenotyping Market Revenue Share (%), by Import Market Analysis (Value & Volume) 2025 & 2033
- Figure 44: Middle East & Africa Plants Phenotyping Market Revenue (Million), by Export Market Analysis (Value & Volume) 2025 & 2033
- Figure 45: Middle East & Africa Plants Phenotyping Market Revenue Share (%), by Export Market Analysis (Value & Volume) 2025 & 2033
- Figure 46: Middle East & Africa Plants Phenotyping Market Revenue (Million), by Price Trend Analysis 2025 & 2033
- Figure 47: Middle East & Africa Plants Phenotyping Market Revenue Share (%), by Price Trend Analysis 2025 & 2033
- Figure 48: Middle East & Africa Plants Phenotyping Market Revenue (Million), by Country 2025 & 2033
- Figure 49: Middle East & Africa Plants Phenotyping Market Revenue Share (%), by Country 2025 & 2033
- Figure 50: Asia Pacific Plants Phenotyping Market Revenue (Million), by Production Analysis 2025 & 2033
- Figure 51: Asia Pacific Plants Phenotyping Market Revenue Share (%), by Production Analysis 2025 & 2033
- Figure 52: Asia Pacific Plants Phenotyping Market Revenue (Million), by Consumption Analysis 2025 & 2033
- Figure 53: Asia Pacific Plants Phenotyping Market Revenue Share (%), by Consumption Analysis 2025 & 2033
- Figure 54: Asia Pacific Plants Phenotyping Market Revenue (Million), by Import Market Analysis (Value & Volume) 2025 & 2033
- Figure 55: Asia Pacific Plants Phenotyping Market Revenue Share (%), by Import Market Analysis (Value & Volume) 2025 & 2033
- Figure 56: Asia Pacific Plants Phenotyping Market Revenue (Million), by Export Market Analysis (Value & Volume) 2025 & 2033
- Figure 57: Asia Pacific Plants Phenotyping Market Revenue Share (%), by Export Market Analysis (Value & Volume) 2025 & 2033
- Figure 58: Asia Pacific Plants Phenotyping Market Revenue (Million), by Price Trend Analysis 2025 & 2033
- Figure 59: Asia Pacific Plants Phenotyping Market Revenue Share (%), by Price Trend Analysis 2025 & 2033
- Figure 60: Asia Pacific Plants Phenotyping Market Revenue (Million), by Country 2025 & 2033
- Figure 61: Asia Pacific Plants Phenotyping Market Revenue Share (%), by Country 2025 & 2033
List of Tables
- Table 1: Global Plants Phenotyping Market Revenue Million Forecast, by Production Analysis 2020 & 2033
- Table 2: Global Plants Phenotyping Market Revenue Million Forecast, by Consumption Analysis 2020 & 2033
- Table 3: Global Plants Phenotyping Market Revenue Million Forecast, by Import Market Analysis (Value & Volume) 2020 & 2033
- Table 4: Global Plants Phenotyping Market Revenue Million Forecast, by Export Market Analysis (Value & Volume) 2020 & 2033
- Table 5: Global Plants Phenotyping Market Revenue Million Forecast, by Price Trend Analysis 2020 & 2033
- Table 6: Global Plants Phenotyping Market Revenue Million Forecast, by Region 2020 & 2033
- Table 7: Global Plants Phenotyping Market Revenue Million Forecast, by Production Analysis 2020 & 2033
- Table 8: Global Plants Phenotyping Market Revenue Million Forecast, by Consumption Analysis 2020 & 2033
- Table 9: Global Plants Phenotyping Market Revenue Million Forecast, by Import Market Analysis (Value & Volume) 2020 & 2033
- Table 10: Global Plants Phenotyping Market Revenue Million Forecast, by Export Market Analysis (Value & Volume) 2020 & 2033
- Table 11: Global Plants Phenotyping Market Revenue Million Forecast, by Price Trend Analysis 2020 & 2033
- Table 12: Global Plants Phenotyping Market Revenue Million Forecast, by Country 2020 & 2033
- Table 13: United States Plants Phenotyping Market Revenue (Million) Forecast, by Application 2020 & 2033
- Table 14: Canada Plants Phenotyping Market Revenue (Million) Forecast, by Application 2020 & 2033
- Table 15: Mexico Plants Phenotyping Market Revenue (Million) Forecast, by Application 2020 & 2033
- Table 16: Global Plants Phenotyping Market Revenue Million Forecast, by Production Analysis 2020 & 2033
- Table 17: Global Plants Phenotyping Market Revenue Million Forecast, by Consumption Analysis 2020 & 2033
- Table 18: Global Plants Phenotyping Market Revenue Million Forecast, by Import Market Analysis (Value & Volume) 2020 & 2033
- Table 19: Global Plants Phenotyping Market Revenue Million Forecast, by Export Market Analysis (Value & Volume) 2020 & 2033
- Table 20: Global Plants Phenotyping Market Revenue Million Forecast, by Price Trend Analysis 2020 & 2033
- Table 21: Global Plants Phenotyping Market Revenue Million Forecast, by Country 2020 & 2033
- Table 22: Brazil Plants Phenotyping Market Revenue (Million) Forecast, by Application 2020 & 2033
- Table 23: Argentina Plants Phenotyping Market Revenue (Million) Forecast, by Application 2020 & 2033
- Table 24: Rest of South America Plants Phenotyping Market Revenue (Million) Forecast, by Application 2020 & 2033
- Table 25: Global Plants Phenotyping Market Revenue Million Forecast, by Production Analysis 2020 & 2033
- Table 26: Global Plants Phenotyping Market Revenue Million Forecast, by Consumption Analysis 2020 & 2033
- Table 27: Global Plants Phenotyping Market Revenue Million Forecast, by Import Market Analysis (Value & Volume) 2020 & 2033
- Table 28: Global Plants Phenotyping Market Revenue Million Forecast, by Export Market Analysis (Value & Volume) 2020 & 2033
- Table 29: Global Plants Phenotyping Market Revenue Million Forecast, by Price Trend Analysis 2020 & 2033
- Table 30: Global Plants Phenotyping Market Revenue Million Forecast, by Country 2020 & 2033
- Table 31: United Kingdom Plants Phenotyping Market Revenue (Million) Forecast, by Application 2020 & 2033
- Table 32: Germany Plants Phenotyping Market Revenue (Million) Forecast, by Application 2020 & 2033
- Table 33: France Plants Phenotyping Market Revenue (Million) Forecast, by Application 2020 & 2033
- Table 34: Italy Plants Phenotyping Market Revenue (Million) Forecast, by Application 2020 & 2033
- Table 35: Spain Plants Phenotyping Market Revenue (Million) Forecast, by Application 2020 & 2033
- Table 36: Russia Plants Phenotyping Market Revenue (Million) Forecast, by Application 2020 & 2033
- Table 37: Benelux Plants Phenotyping Market Revenue (Million) Forecast, by Application 2020 & 2033
- Table 38: Nordics Plants Phenotyping Market Revenue (Million) Forecast, by Application 2020 & 2033
- Table 39: Rest of Europe Plants Phenotyping Market Revenue (Million) Forecast, by Application 2020 & 2033
- Table 40: Global Plants Phenotyping Market Revenue Million Forecast, by Production Analysis 2020 & 2033
- Table 41: Global Plants Phenotyping Market Revenue Million Forecast, by Consumption Analysis 2020 & 2033
- Table 42: Global Plants Phenotyping Market Revenue Million Forecast, by Import Market Analysis (Value & Volume) 2020 & 2033
- Table 43: Global Plants Phenotyping Market Revenue Million Forecast, by Export Market Analysis (Value & Volume) 2020 & 2033
- Table 44: Global Plants Phenotyping Market Revenue Million Forecast, by Price Trend Analysis 2020 & 2033
- Table 45: Global Plants Phenotyping Market Revenue Million Forecast, by Country 2020 & 2033
- Table 46: Turkey Plants Phenotyping Market Revenue (Million) Forecast, by Application 2020 & 2033
- Table 47: Israel Plants Phenotyping Market Revenue (Million) Forecast, by Application 2020 & 2033
- Table 48: GCC Plants Phenotyping Market Revenue (Million) Forecast, by Application 2020 & 2033
- Table 49: North Africa Plants Phenotyping Market Revenue (Million) Forecast, by Application 2020 & 2033
- Table 50: South Africa Plants Phenotyping Market Revenue (Million) Forecast, by Application 2020 & 2033
- Table 51: Rest of Middle East & Africa Plants Phenotyping Market Revenue (Million) Forecast, by Application 2020 & 2033
- Table 52: Global Plants Phenotyping Market Revenue Million Forecast, by Production Analysis 2020 & 2033
- Table 53: Global Plants Phenotyping Market Revenue Million Forecast, by Consumption Analysis 2020 & 2033
- Table 54: Global Plants Phenotyping Market Revenue Million Forecast, by Import Market Analysis (Value & Volume) 2020 & 2033
- Table 55: Global Plants Phenotyping Market Revenue Million Forecast, by Export Market Analysis (Value & Volume) 2020 & 2033
- Table 56: Global Plants Phenotyping Market Revenue Million Forecast, by Price Trend Analysis 2020 & 2033
- Table 57: Global Plants Phenotyping Market Revenue Million Forecast, by Country 2020 & 2033
- Table 58: China Plants Phenotyping Market Revenue (Million) Forecast, by Application 2020 & 2033
- Table 59: India Plants Phenotyping Market Revenue (Million) Forecast, by Application 2020 & 2033
- Table 60: Japan Plants Phenotyping Market Revenue (Million) Forecast, by Application 2020 & 2033
- Table 61: South Korea Plants Phenotyping Market Revenue (Million) Forecast, by Application 2020 & 2033
- Table 62: ASEAN Plants Phenotyping Market Revenue (Million) Forecast, by Application 2020 & 2033
- Table 63: Oceania Plants Phenotyping Market Revenue (Million) Forecast, by Application 2020 & 2033
- Table 64: Rest of Asia Pacific Plants Phenotyping Market Revenue (Million) Forecast, by Application 2020 & 2033
Frequently Asked Questions
1. What is the projected Compound Annual Growth Rate (CAGR) of the Plants Phenotyping Market?
The projected CAGR is approximately 10.50%.
2. Which companies are prominent players in the Plants Phenotyping Market?
Key companies in the market include Rothamsted Research, Phenospex, Delta-T Devices, Keygene, PSI (Photon Systems Instruments), BASF SE (Crop Design), Heinz Walz GmbH, The Vienna Biocenter Core Facilities, LemnaTec GmbH, Phenomix, WP, Qubit Systems.
3. What are the main segments of the Plants Phenotyping Market?
The market segments include Production Analysis, Consumption Analysis, Import Market Analysis (Value & Volume), Export Market Analysis (Value & Volume), Price Trend Analysis.
4. Can you provide details about the market size?
The market size is estimated to be USD 281.32 Million as of 2022.
5. What are some drivers contributing to market growth?
Demand For Landscaping Maintenance; Adoption of Green Spaces and Green Roofs.
6. What are the notable trends driving market growth?
Increasing Number of Seed Borne Diseases is Driving the Market.
7. Are there any restraints impacting market growth?
Shortage of Labor In Landscaping; High Maintenance Cost of Lawn Mowers.
8. Can you provide examples of recent developments in the market?
N/A
9. What pricing options are available for accessing the report?
Pricing options include single-user, multi-user, and enterprise licenses priced at USD 4750, USD 5250, and USD 8750 respectively.
10. Is the market size provided in terms of value or volume?
The market size is provided in terms of value, measured in Million.
11. Are there any specific market keywords associated with the report?
Yes, the market keyword associated with the report is "Plants Phenotyping Market," which aids in identifying and referencing the specific market segment covered.
12. How do I determine which pricing option suits my needs best?
The pricing options vary based on user requirements and access needs. Individual users may opt for single-user licenses, while businesses requiring broader access may choose multi-user or enterprise licenses for cost-effective access to the report.
13. Are there any additional resources or data provided in the Plants Phenotyping Market report?
While the report offers comprehensive insights, it's advisable to review the specific contents or supplementary materials provided to ascertain if additional resources or data are available.
14. How can I stay updated on further developments or reports in the Plants Phenotyping Market?
To stay informed about further developments, trends, and reports in the Plants Phenotyping Market, consider subscribing to industry newsletters, following relevant companies and organizations, or regularly checking reputable industry news sources and publications.
Methodology
Step 1 - Identification of Relevant Samples Size from Population Database


Step 2 - Approaches for Defining Global Market Size (Value, Volume* & Price*)

Note*: In applicable scenarios
Step 3 - Data Sources
Primary Research
- Web Analytics
- Survey Reports
- Research Institute
- Latest Research Reports
- Opinion Leaders
Secondary Research
- Annual Reports
- White Paper
- Latest Press Release
- Industry Association
- Paid Database
- Investor Presentations

Step 4 - Data Triangulation
Involves using different sources of information in order to increase the validity of a study
These sources are likely to be stakeholders in a program - participants, other researchers, program staff, other community members, and so on.
Then we put all data in single framework & apply various statistical tools to find out the dynamic on the market.
During the analysis stage, feedback from the stakeholder groups would be compared to determine areas of agreement as well as areas of divergence