

Key Insights
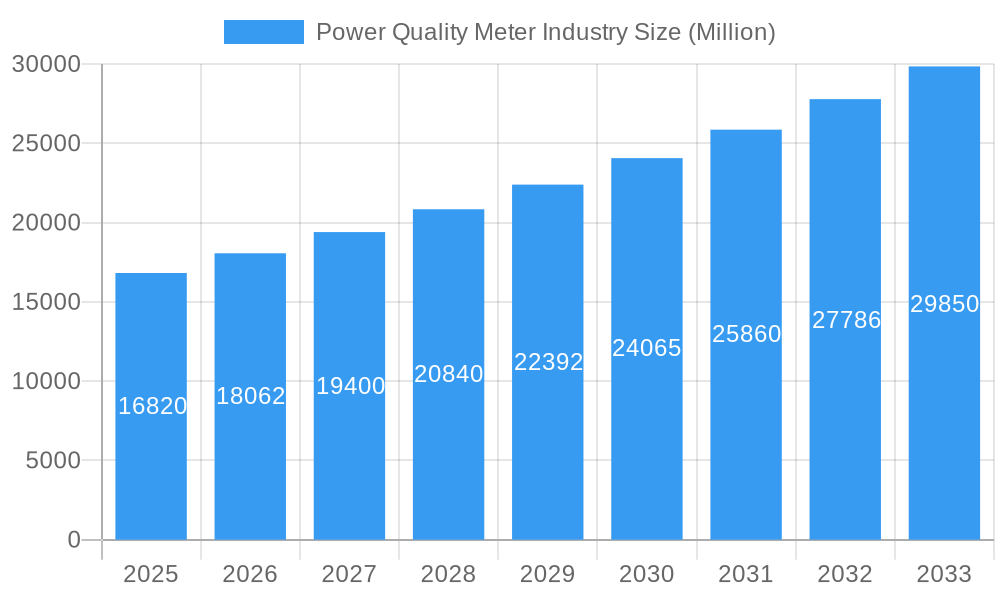
The global power quality meter market, valued at $16.82 billion in 2025, is projected to experience robust growth, driven by the increasing demand for reliable power across diverse sectors. The market's Compound Annual Growth Rate (CAGR) of 7.40% from 2025 to 2033 signifies a significant expansion opportunity. Key drivers include the rising adoption of smart grids and renewable energy sources, necessitating precise power quality monitoring. Industrial and manufacturing sectors are major consumers, demanding sophisticated meters to ensure optimal equipment performance and minimize downtime. The growing awareness of energy efficiency and the need to comply with stringent regulatory standards further fuel market growth. Three-phase power quality meters are expected to dominate the market due to their suitability for high-power industrial applications. While technological advancements in meter functionalities (such as advanced analytics and remote monitoring) present opportunities, challenges include the high initial investment costs and the need for skilled technicians for installation and maintenance. Geographically, North America and Europe currently hold significant market shares, but the Asia-Pacific region is poised for substantial growth due to rapid industrialization and infrastructure development. Leading companies like Siemens, Eaton, and Schneider Electric are investing heavily in research and development, focusing on innovative features and expanding their global presence to capitalize on this burgeoning market. Competition is intensifying, with companies emphasizing product differentiation through superior accuracy, advanced analytics capabilities, and robust connectivity features.
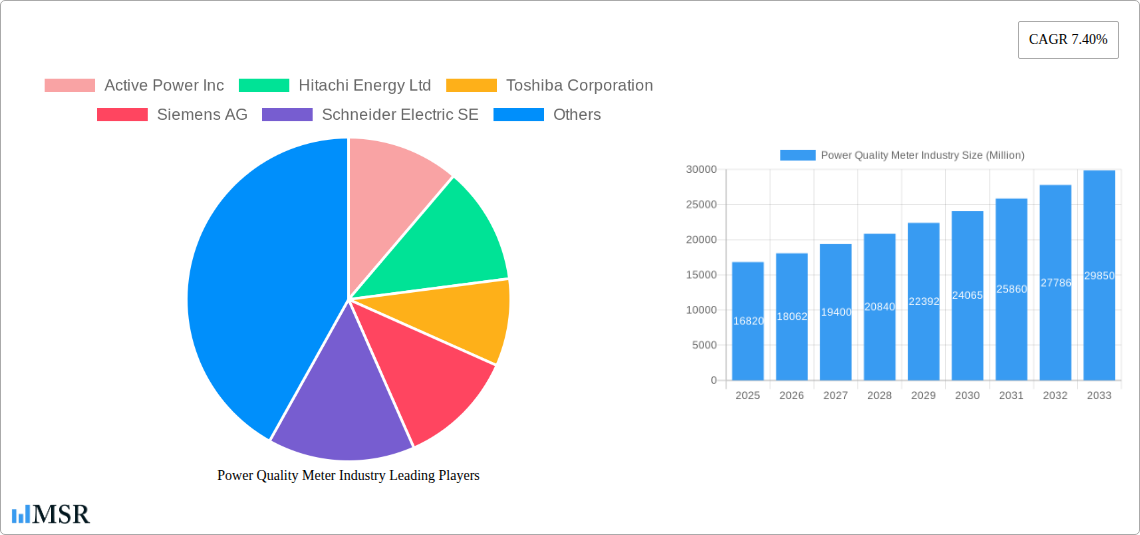
Power Quality Meter Industry Market Size (In Billion)
The market segmentation reflects diverse application needs. Within equipment types, Uninterruptible Power Supplies (UPS) and harmonic filters are significant growth drivers, closely tied to the adoption of power quality meters for preventative maintenance and optimized energy management. The commercial sector presents a large and expanding market, as businesses increasingly prioritize minimizing power-related disruptions and optimizing energy consumption. Ongoing technological advancements, including the integration of smart grid technologies and Internet of Things (IoT) capabilities, are anticipated to drive future growth, leading to more sophisticated and integrated power quality monitoring solutions. Future market growth will depend on factors such as technological advancements, government regulations, and economic growth in key regions. The continued expansion of renewable energy sources, which often require precise power quality monitoring, will be a crucial growth factor.
Power Quality Meter Industry Company Market Share
Power Quality Meter Industry Market Report: 2019-2033
This comprehensive report provides an in-depth analysis of the Power Quality Meter industry, projecting robust growth from 2025 to 2033. The study covers market size, segmentation, key players, emerging trends, and future outlook, providing invaluable insights for stakeholders. With a focus on key market segments including Uninterruptable Power Supply (UPS), Harmonic Filters, Static VAR Compensators, and Power Quality Meters, this report is essential for businesses navigating this dynamic sector. The report uses 2025 as the base year, encompassing data from the historical period (2019-2024) and forecasting to 2033. Market values are expressed in Millions.
Power Quality Meter Industry Market Concentration & Dynamics
The Power Quality Meter market exhibits a moderately concentrated landscape, with a few major players holding significant market share. Active Power Inc, Hitachi Energy Ltd, Toshiba Corporation, Siemens AG, Schneider Electric SE, EATON Corporation Plc, MTE Corporation, General Electric Company, Schaffner, and Emerson Electric Company are key players driving innovation and competition. Market share analysis reveals that the top five players collectively control approximately xx% of the global market in 2025. The industry witnesses frequent M&A activities, with an estimated xx M&A deals recorded between 2019 and 2024. This trend is driven by the need for companies to expand their product portfolios, geographical reach, and technological capabilities.
- Market Concentration: Moderately concentrated, with top 5 players holding xx% market share (2025).
- Innovation Ecosystems: Strong focus on smart grid technologies, digitalization, and advanced metering infrastructure (AMI).
- Regulatory Frameworks: Increasingly stringent regulations promoting grid modernization and energy efficiency are shaping market dynamics. The recent German “smart grids” initiative, for example, will significantly impact market growth.
- Substitute Products: Limited direct substitutes, but alternative solutions for power quality management exist, impacting market growth at xx%.
- End-User Trends: Growing demand for reliable power supply across industrial and commercial sectors is driving market expansion. Industrial and manufacturing sectors are expected to remain the largest end-user segment.
- M&A Activities: xx M&A deals (2019-2024), indicating significant consolidation and expansion within the industry.
Power Quality Meter Industry Industry Insights & Trends
The global Power Quality Meter market is experiencing significant growth, projected to reach $xx Million by 2033, with a Compound Annual Growth Rate (CAGR) of xx% during the forecast period (2025-2033). Several factors contribute to this growth. The increasing demand for reliable and efficient power supply across various industries, particularly manufacturing, is a major driver. Advancements in smart grid technologies and the integration of renewable energy sources are also contributing factors. Furthermore, the growing awareness of power quality issues and their impact on operational efficiency is fueling demand for advanced power quality monitoring and management solutions. Technological disruptions, such as the adoption of IoT and AI-powered solutions in power quality monitoring, are transforming the industry, enabling predictive maintenance and improved grid management. Changing consumer behaviors, such as increasing preference for energy-efficient solutions, also contribute to market growth.
Key Markets & Segments Leading Power Quality Meter Industry
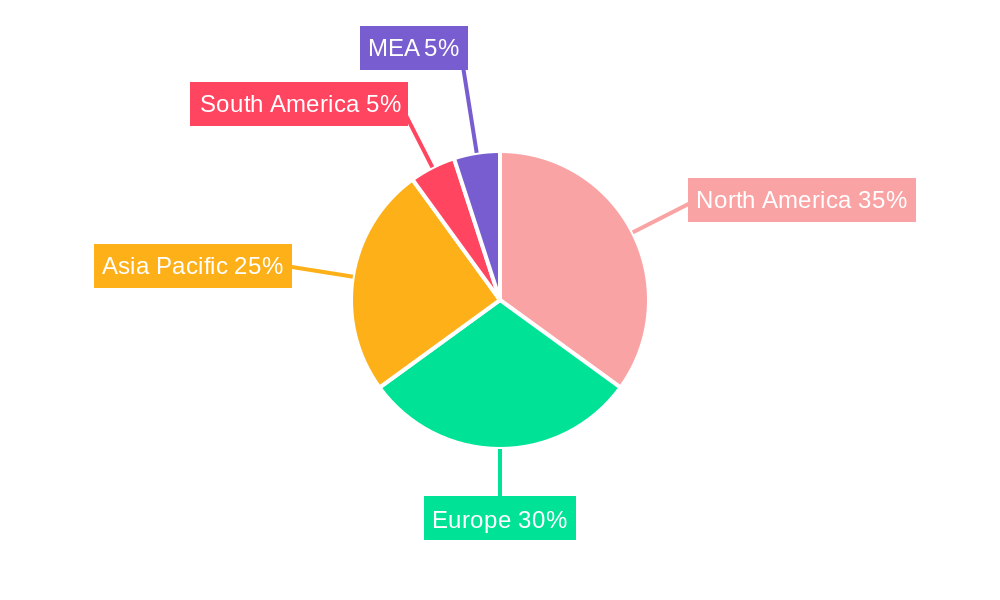
The Power Quality Meter market is geographically diverse, with significant presence in North America, Europe, and Asia-Pacific. However, the Asia-Pacific region is currently the fastest-growing market, driven by rapid industrialization and urbanization, followed closely by Europe, stimulated by renewable energy integration and smart grid initiatives such as Germany’s “smart grids” rollout.
Dominant Segments:
- Equipment: Power Quality Meters holds the largest market share within the equipment segment, driven by increasing demand for precise power quality monitoring and data analysis.
- Phase: Three-phase power quality meters dominate the market due to their application in high-power industrial settings.
- End-Users: The industrial and manufacturing segment accounts for the largest market share, followed by the commercial sector.
Drivers:
- Economic Growth: Rapid economic expansion in developing countries fuels the demand for reliable power infrastructure.
- Infrastructure Development: Government investments in grid modernization and smart city initiatives are driving adoption of advanced metering solutions.
- Renewable Energy Integration: The increasing integration of renewable energy sources necessitates sophisticated power quality management systems.
Power Quality Meter Industry Product Developments
Recent product innovations include the development of advanced power quality meters with enhanced functionalities like real-time data analytics, remote monitoring capabilities, and integration with cloud-based platforms. These advancements provide users with more comprehensive power quality insights, enabling predictive maintenance and improved operational efficiency. The incorporation of AI and machine learning algorithms into power quality meters is further enhancing their capabilities, improving accuracy and enabling proactive identification of potential issues. This leads to a significant competitive edge for manufacturers offering these sophisticated solutions.
Challenges in the Power Quality Meter Industry Market
Several challenges impede market growth. Stringent regulatory requirements and compliance costs can be significant barriers for smaller companies. Supply chain disruptions, particularly the availability of key components like sensors and microprocessors, can impact production and lead times. Furthermore, intense competition from established players and the emergence of new entrants create pricing pressure and necessitate continuous innovation to maintain market share. These factors collectively affect market growth at xx% negatively.
Forces Driving Power Quality Meter Industry Growth
Several factors are driving market growth, including technological advancements in metering technology and smart grid integration, leading to more efficient and accurate power monitoring and analysis. Economic growth across several regions fuels the demand for reliable power infrastructure and the adoption of power quality management solutions. Government regulations promoting energy efficiency and grid modernization are creating favorable market conditions. For example, the German government's plan to digitalize its grid by 2028 will create huge demand.
Long-Term Growth Catalysts in the Power Quality Meter Industry
Long-term growth will be fueled by continued innovation in metering technologies, including the development of AI-powered solutions for predictive maintenance. Strategic partnerships between manufacturers and utility companies will expand market reach and accelerate the adoption of advanced metering solutions. Expansion into new markets, particularly in developing countries with growing energy demands, will provide significant growth opportunities.
Emerging Opportunities in Power Quality Meter Industry
Emerging opportunities include the growing demand for wireless power quality meters, providing flexible and cost-effective solutions for various applications. The integration of power quality meters with building management systems and smart grids will open up new market segments. Increasing focus on data analytics and predictive maintenance offers opportunities for value-added services.
Leading Players in the Power Quality Meter Industry Sector
Key Milestones in Power Quality Meter Industry Industry
- June 2023: Germany announces plans to digitalize its grid, mandating smart meter rollouts (20% by 2025, 50% by 2028). This significantly impacts the demand for advanced power quality meters.
- March 2023: GE opens the 300-MW Biblis Grid Stability Power Plant, highlighting the growing need for reliable power and advanced grid management solutions, indirectly boosting demand for power quality monitoring.
Strategic Outlook for Power Quality Meter Industry Market
The Power Quality Meter market presents significant growth potential driven by the increasing focus on grid modernization, renewable energy integration, and the need for enhanced power quality management. Strategic partnerships, technological advancements, and expansion into emerging markets will be key to realizing this potential. The industry is poised for substantial growth, with smart grid initiatives and the adoption of AI-powered solutions playing a crucial role in shaping its future.
Power Quality Meter Industry Segmentation
-
1. Equipment
- 1.1. Uninterruptable Power Supply (UPS)
- 1.2. Harmonic Filters
- 1.3. Static VAR Compensator
- 1.4. Power Quality Meters
- 1.5. Other Equipment Types
-
2. Phase
- 2.1. Single Phase
- 2.2. Three Phase
-
3. End-Users
- 3.1. Industrial and Manufacturing
- 3.2. Commercial
- 3.3. Others End-Users
Power Quality Meter Industry Segmentation By Geography
-
1. North America
- 1.1. United States
- 1.2. Canada
- 1.3. Rest of North America
-
2. Europe
- 2.1. Germany
- 2.2. France
- 2.3. United Kingdom
- 2.4. Italy
- 2.5. Rest of Europe
-
3. Asia Pacific
- 3.1. China
- 3.2. India
- 3.3. Japan
- 3.4. Australia
- 3.5. Rest of Asia Pacific
-
4. South America
- 4.1. Brazil
- 4.2. Argentina
- 4.3. Chile
- 4.4. Rest of South America
-
5. Middle East and Africa
- 5.1. United Arab Emirates
- 5.2. Qatar
- 5.3. Saudi Arabia
- 5.4. South Africa
- 5.5. Egypt
- 5.6. Rest of Middle East and Africa
Power Quality Meter Industry Regional Market Share
Geographic Coverage of Power Quality Meter Industry
Power Quality Meter Industry REPORT HIGHLIGHTS
| Aspects | Details |
|---|---|
| Study Period | 2020-2034 |
| Base Year | 2025 |
| Estimated Year | 2026 |
| Forecast Period | 2026-2034 |
| Historical Period | 2020-2025 |
| Growth Rate | CAGR of 7.40% from 2020-2034 |
| Segmentation |
|
Table of Contents
- 1. Introduction
- 1.1. Research Scope
- 1.2. Market Segmentation
- 1.3. Research Objective
- 1.4. Definitions and Assumptions
- 2. Executive Summary
- 2.1. Market Snapshot
- 3. Market Dynamics
- 3.1. Market Drivers
- 3.2. Market Restrains
- 3.3. Market Trends
- 3.4. Market Opportunities
- 4. Market Factor Analysis
- 4.1. Porters Five Forces
- 4.1.1. Bargaining Power of Suppliers
- 4.1.2. Bargaining Power of Buyers
- 4.1.3. Threat of New Entrants
- 4.1.4. Threat of Substitutes
- 4.1.5. Competitive Rivalry
- 4.2. PESTEL analysis
- 4.3. BCG Analysis
- 4.3.1. Stars (High Growth, High Market Share)
- 4.3.2. Cash Cows (Low Growth, High Market Share)
- 4.3.3. Question Mark (High Growth, Low Market Share)
- 4.3.4. Dogs (Low Growth, Low Market Share)
- 4.4. Ansoff Matrix Analysis
- 4.5. Supply Chain Analysis
- 4.6. Regulatory Landscape
- 4.7. Current Market Potential and Opportunity Assessment (TAM–SAM–SOM Framework)
- 4.8. MSR Analyst Note
- 4.1. Porters Five Forces
- 5. Market Analysis, Insights and Forecast 2021-2033
- 5.1. Market Analysis, Insights and Forecast - by Equipment
- 5.1.1. Uninterruptable Power Supply (UPS)
- 5.1.2. Harmonic Filters
- 5.1.3. Static VAR Compensator
- 5.1.4. Power Quality Meters
- 5.1.5. Other Equipment Types
- 5.2. Market Analysis, Insights and Forecast - by Phase
- 5.2.1. Single Phase
- 5.2.2. Three Phase
- 5.3. Market Analysis, Insights and Forecast - by End-Users
- 5.3.1. Industrial and Manufacturing
- 5.3.2. Commercial
- 5.3.3. Others End-Users
- 5.4. Market Analysis, Insights and Forecast - by Region
- 5.4.1. North America
- 5.4.2. Europe
- 5.4.3. Asia Pacific
- 5.4.4. South America
- 5.4.5. Middle East and Africa
- 5.1. Market Analysis, Insights and Forecast - by Equipment
- 6. Global Power Quality Meter Industry Analysis, Insights and Forecast, 2021-2033
- 6.1. Market Analysis, Insights and Forecast - by Equipment
- 6.1.1. Uninterruptable Power Supply (UPS)
- 6.1.2. Harmonic Filters
- 6.1.3. Static VAR Compensator
- 6.1.4. Power Quality Meters
- 6.1.5. Other Equipment Types
- 6.2. Market Analysis, Insights and Forecast - by Phase
- 6.2.1. Single Phase
- 6.2.2. Three Phase
- 6.3. Market Analysis, Insights and Forecast - by End-Users
- 6.3.1. Industrial and Manufacturing
- 6.3.2. Commercial
- 6.3.3. Others End-Users
- 6.1. Market Analysis, Insights and Forecast - by Equipment
- 7. North America Power Quality Meter Industry Analysis, Insights and Forecast, 2020-2032
- 7.1. Market Analysis, Insights and Forecast - by Equipment
- 7.1.1. Uninterruptable Power Supply (UPS)
- 7.1.2. Harmonic Filters
- 7.1.3. Static VAR Compensator
- 7.1.4. Power Quality Meters
- 7.1.5. Other Equipment Types
- 7.2. Market Analysis, Insights and Forecast - by Phase
- 7.2.1. Single Phase
- 7.2.2. Three Phase
- 7.3. Market Analysis, Insights and Forecast - by End-Users
- 7.3.1. Industrial and Manufacturing
- 7.3.2. Commercial
- 7.3.3. Others End-Users
- 7.1. Market Analysis, Insights and Forecast - by Equipment
- 8. Europe Power Quality Meter Industry Analysis, Insights and Forecast, 2020-2032
- 8.1. Market Analysis, Insights and Forecast - by Equipment
- 8.1.1. Uninterruptable Power Supply (UPS)
- 8.1.2. Harmonic Filters
- 8.1.3. Static VAR Compensator
- 8.1.4. Power Quality Meters
- 8.1.5. Other Equipment Types
- 8.2. Market Analysis, Insights and Forecast - by Phase
- 8.2.1. Single Phase
- 8.2.2. Three Phase
- 8.3. Market Analysis, Insights and Forecast - by End-Users
- 8.3.1. Industrial and Manufacturing
- 8.3.2. Commercial
- 8.3.3. Others End-Users
- 8.1. Market Analysis, Insights and Forecast - by Equipment
- 9. Asia Pacific Power Quality Meter Industry Analysis, Insights and Forecast, 2020-2032
- 9.1. Market Analysis, Insights and Forecast - by Equipment
- 9.1.1. Uninterruptable Power Supply (UPS)
- 9.1.2. Harmonic Filters
- 9.1.3. Static VAR Compensator
- 9.1.4. Power Quality Meters
- 9.1.5. Other Equipment Types
- 9.2. Market Analysis, Insights and Forecast - by Phase
- 9.2.1. Single Phase
- 9.2.2. Three Phase
- 9.3. Market Analysis, Insights and Forecast - by End-Users
- 9.3.1. Industrial and Manufacturing
- 9.3.2. Commercial
- 9.3.3. Others End-Users
- 9.1. Market Analysis, Insights and Forecast - by Equipment
- 10. South America Power Quality Meter Industry Analysis, Insights and Forecast, 2020-2032
- 10.1. Market Analysis, Insights and Forecast - by Equipment
- 10.1.1. Uninterruptable Power Supply (UPS)
- 10.1.2. Harmonic Filters
- 10.1.3. Static VAR Compensator
- 10.1.4. Power Quality Meters
- 10.1.5. Other Equipment Types
- 10.2. Market Analysis, Insights and Forecast - by Phase
- 10.2.1. Single Phase
- 10.2.2. Three Phase
- 10.3. Market Analysis, Insights and Forecast - by End-Users
- 10.3.1. Industrial and Manufacturing
- 10.3.2. Commercial
- 10.3.3. Others End-Users
- 10.1. Market Analysis, Insights and Forecast - by Equipment
- 11. Middle East and Africa Power Quality Meter Industry Analysis, Insights and Forecast, 2020-2032
- 11.1. Market Analysis, Insights and Forecast - by Equipment
- 11.1.1. Uninterruptable Power Supply (UPS)
- 11.1.2. Harmonic Filters
- 11.1.3. Static VAR Compensator
- 11.1.4. Power Quality Meters
- 11.1.5. Other Equipment Types
- 11.2. Market Analysis, Insights and Forecast - by Phase
- 11.2.1. Single Phase
- 11.2.2. Three Phase
- 11.3. Market Analysis, Insights and Forecast - by End-Users
- 11.3.1. Industrial and Manufacturing
- 11.3.2. Commercial
- 11.3.3. Others End-Users
- 11.1. Market Analysis, Insights and Forecast - by Equipment
- 12. Competitive Analysis
- 12.1. Company Profiles
- 12.1.1 Active Power Inc
- 12.1.1.1. Company Overview
- 12.1.1.2. Products
- 12.1.1.3. Company Financials
- 12.1.1.4. SWOT Analysis
- 12.1.2 Hitachi Energy Ltd
- 12.1.2.1. Company Overview
- 12.1.2.2. Products
- 12.1.2.3. Company Financials
- 12.1.2.4. SWOT Analysis
- 12.1.3 Toshiba Corporation
- 12.1.3.1. Company Overview
- 12.1.3.2. Products
- 12.1.3.3. Company Financials
- 12.1.3.4. SWOT Analysis
- 12.1.4 Siemens AG
- 12.1.4.1. Company Overview
- 12.1.4.2. Products
- 12.1.4.3. Company Financials
- 12.1.4.4. SWOT Analysis
- 12.1.5 Schneider Electric SE
- 12.1.5.1. Company Overview
- 12.1.5.2. Products
- 12.1.5.3. Company Financials
- 12.1.5.4. SWOT Analysis
- 12.1.6 EATON Corporation Plc
- 12.1.6.1. Company Overview
- 12.1.6.2. Products
- 12.1.6.3. Company Financials
- 12.1.6.4. SWOT Analysis
- 12.1.7 MTE Corporation
- 12.1.7.1. Company Overview
- 12.1.7.2. Products
- 12.1.7.3. Company Financials
- 12.1.7.4. SWOT Analysis
- 12.1.8 General Electric Company
- 12.1.8.1. Company Overview
- 12.1.8.2. Products
- 12.1.8.3. Company Financials
- 12.1.8.4. SWOT Analysis
- 12.1.9 Schaffner
- 12.1.9.1. Company Overview
- 12.1.9.2. Products
- 12.1.9.3. Company Financials
- 12.1.9.4. SWOT Analysis
- 12.1.10 Emerson Electric Company
- 12.1.10.1. Company Overview
- 12.1.10.2. Products
- 12.1.10.3. Company Financials
- 12.1.10.4. SWOT Analysis
- 12.1.1 Active Power Inc
- 12.2. Market Entropy
- 12.2.1 Company's Key Areas Served
- 12.2.2 Recent Developments
- 12.3. Company Market Share Analysis 2025
- 12.3.1 Top 5 Companies Market Share Analysis
- 12.3.2 Top 3 Companies Market Share Analysis
- 12.4. List of Potential Customers
- 13. Research Methodology
List of Figures
- Figure 1: Global Power Quality Meter Industry Revenue Breakdown (Million, %) by Region 2025 & 2033
- Figure 2: Global Power Quality Meter Industry Volume Breakdown (K Unit, %) by Region 2025 & 2033
- Figure 3: North America Power Quality Meter Industry Revenue (Million), by Equipment 2025 & 2033
- Figure 4: North America Power Quality Meter Industry Volume (K Unit), by Equipment 2025 & 2033
- Figure 5: North America Power Quality Meter Industry Revenue Share (%), by Equipment 2025 & 2033
- Figure 6: North America Power Quality Meter Industry Volume Share (%), by Equipment 2025 & 2033
- Figure 7: North America Power Quality Meter Industry Revenue (Million), by Phase 2025 & 2033
- Figure 8: North America Power Quality Meter Industry Volume (K Unit), by Phase 2025 & 2033
- Figure 9: North America Power Quality Meter Industry Revenue Share (%), by Phase 2025 & 2033
- Figure 10: North America Power Quality Meter Industry Volume Share (%), by Phase 2025 & 2033
- Figure 11: North America Power Quality Meter Industry Revenue (Million), by End-Users 2025 & 2033
- Figure 12: North America Power Quality Meter Industry Volume (K Unit), by End-Users 2025 & 2033
- Figure 13: North America Power Quality Meter Industry Revenue Share (%), by End-Users 2025 & 2033
- Figure 14: North America Power Quality Meter Industry Volume Share (%), by End-Users 2025 & 2033
- Figure 15: North America Power Quality Meter Industry Revenue (Million), by Country 2025 & 2033
- Figure 16: North America Power Quality Meter Industry Volume (K Unit), by Country 2025 & 2033
- Figure 17: North America Power Quality Meter Industry Revenue Share (%), by Country 2025 & 2033
- Figure 18: North America Power Quality Meter Industry Volume Share (%), by Country 2025 & 2033
- Figure 19: Europe Power Quality Meter Industry Revenue (Million), by Equipment 2025 & 2033
- Figure 20: Europe Power Quality Meter Industry Volume (K Unit), by Equipment 2025 & 2033
- Figure 21: Europe Power Quality Meter Industry Revenue Share (%), by Equipment 2025 & 2033
- Figure 22: Europe Power Quality Meter Industry Volume Share (%), by Equipment 2025 & 2033
- Figure 23: Europe Power Quality Meter Industry Revenue (Million), by Phase 2025 & 2033
- Figure 24: Europe Power Quality Meter Industry Volume (K Unit), by Phase 2025 & 2033
- Figure 25: Europe Power Quality Meter Industry Revenue Share (%), by Phase 2025 & 2033
- Figure 26: Europe Power Quality Meter Industry Volume Share (%), by Phase 2025 & 2033
- Figure 27: Europe Power Quality Meter Industry Revenue (Million), by End-Users 2025 & 2033
- Figure 28: Europe Power Quality Meter Industry Volume (K Unit), by End-Users 2025 & 2033
- Figure 29: Europe Power Quality Meter Industry Revenue Share (%), by End-Users 2025 & 2033
- Figure 30: Europe Power Quality Meter Industry Volume Share (%), by End-Users 2025 & 2033
- Figure 31: Europe Power Quality Meter Industry Revenue (Million), by Country 2025 & 2033
- Figure 32: Europe Power Quality Meter Industry Volume (K Unit), by Country 2025 & 2033
- Figure 33: Europe Power Quality Meter Industry Revenue Share (%), by Country 2025 & 2033
- Figure 34: Europe Power Quality Meter Industry Volume Share (%), by Country 2025 & 2033
- Figure 35: Asia Pacific Power Quality Meter Industry Revenue (Million), by Equipment 2025 & 2033
- Figure 36: Asia Pacific Power Quality Meter Industry Volume (K Unit), by Equipment 2025 & 2033
- Figure 37: Asia Pacific Power Quality Meter Industry Revenue Share (%), by Equipment 2025 & 2033
- Figure 38: Asia Pacific Power Quality Meter Industry Volume Share (%), by Equipment 2025 & 2033
- Figure 39: Asia Pacific Power Quality Meter Industry Revenue (Million), by Phase 2025 & 2033
- Figure 40: Asia Pacific Power Quality Meter Industry Volume (K Unit), by Phase 2025 & 2033
- Figure 41: Asia Pacific Power Quality Meter Industry Revenue Share (%), by Phase 2025 & 2033
- Figure 42: Asia Pacific Power Quality Meter Industry Volume Share (%), by Phase 2025 & 2033
- Figure 43: Asia Pacific Power Quality Meter Industry Revenue (Million), by End-Users 2025 & 2033
- Figure 44: Asia Pacific Power Quality Meter Industry Volume (K Unit), by End-Users 2025 & 2033
- Figure 45: Asia Pacific Power Quality Meter Industry Revenue Share (%), by End-Users 2025 & 2033
- Figure 46: Asia Pacific Power Quality Meter Industry Volume Share (%), by End-Users 2025 & 2033
- Figure 47: Asia Pacific Power Quality Meter Industry Revenue (Million), by Country 2025 & 2033
- Figure 48: Asia Pacific Power Quality Meter Industry Volume (K Unit), by Country 2025 & 2033
- Figure 49: Asia Pacific Power Quality Meter Industry Revenue Share (%), by Country 2025 & 2033
- Figure 50: Asia Pacific Power Quality Meter Industry Volume Share (%), by Country 2025 & 2033
- Figure 51: South America Power Quality Meter Industry Revenue (Million), by Equipment 2025 & 2033
- Figure 52: South America Power Quality Meter Industry Volume (K Unit), by Equipment 2025 & 2033
- Figure 53: South America Power Quality Meter Industry Revenue Share (%), by Equipment 2025 & 2033
- Figure 54: South America Power Quality Meter Industry Volume Share (%), by Equipment 2025 & 2033
- Figure 55: South America Power Quality Meter Industry Revenue (Million), by Phase 2025 & 2033
- Figure 56: South America Power Quality Meter Industry Volume (K Unit), by Phase 2025 & 2033
- Figure 57: South America Power Quality Meter Industry Revenue Share (%), by Phase 2025 & 2033
- Figure 58: South America Power Quality Meter Industry Volume Share (%), by Phase 2025 & 2033
- Figure 59: South America Power Quality Meter Industry Revenue (Million), by End-Users 2025 & 2033
- Figure 60: South America Power Quality Meter Industry Volume (K Unit), by End-Users 2025 & 2033
- Figure 61: South America Power Quality Meter Industry Revenue Share (%), by End-Users 2025 & 2033
- Figure 62: South America Power Quality Meter Industry Volume Share (%), by End-Users 2025 & 2033
- Figure 63: South America Power Quality Meter Industry Revenue (Million), by Country 2025 & 2033
- Figure 64: South America Power Quality Meter Industry Volume (K Unit), by Country 2025 & 2033
- Figure 65: South America Power Quality Meter Industry Revenue Share (%), by Country 2025 & 2033
- Figure 66: South America Power Quality Meter Industry Volume Share (%), by Country 2025 & 2033
- Figure 67: Middle East and Africa Power Quality Meter Industry Revenue (Million), by Equipment 2025 & 2033
- Figure 68: Middle East and Africa Power Quality Meter Industry Volume (K Unit), by Equipment 2025 & 2033
- Figure 69: Middle East and Africa Power Quality Meter Industry Revenue Share (%), by Equipment 2025 & 2033
- Figure 70: Middle East and Africa Power Quality Meter Industry Volume Share (%), by Equipment 2025 & 2033
- Figure 71: Middle East and Africa Power Quality Meter Industry Revenue (Million), by Phase 2025 & 2033
- Figure 72: Middle East and Africa Power Quality Meter Industry Volume (K Unit), by Phase 2025 & 2033
- Figure 73: Middle East and Africa Power Quality Meter Industry Revenue Share (%), by Phase 2025 & 2033
- Figure 74: Middle East and Africa Power Quality Meter Industry Volume Share (%), by Phase 2025 & 2033
- Figure 75: Middle East and Africa Power Quality Meter Industry Revenue (Million), by End-Users 2025 & 2033
- Figure 76: Middle East and Africa Power Quality Meter Industry Volume (K Unit), by End-Users 2025 & 2033
- Figure 77: Middle East and Africa Power Quality Meter Industry Revenue Share (%), by End-Users 2025 & 2033
- Figure 78: Middle East and Africa Power Quality Meter Industry Volume Share (%), by End-Users 2025 & 2033
- Figure 79: Middle East and Africa Power Quality Meter Industry Revenue (Million), by Country 2025 & 2033
- Figure 80: Middle East and Africa Power Quality Meter Industry Volume (K Unit), by Country 2025 & 2033
- Figure 81: Middle East and Africa Power Quality Meter Industry Revenue Share (%), by Country 2025 & 2033
- Figure 82: Middle East and Africa Power Quality Meter Industry Volume Share (%), by Country 2025 & 2033
List of Tables
- Table 1: Global Power Quality Meter Industry Revenue Million Forecast, by Equipment 2020 & 2033
- Table 2: Global Power Quality Meter Industry Volume K Unit Forecast, by Equipment 2020 & 2033
- Table 3: Global Power Quality Meter Industry Revenue Million Forecast, by Phase 2020 & 2033
- Table 4: Global Power Quality Meter Industry Volume K Unit Forecast, by Phase 2020 & 2033
- Table 5: Global Power Quality Meter Industry Revenue Million Forecast, by End-Users 2020 & 2033
- Table 6: Global Power Quality Meter Industry Volume K Unit Forecast, by End-Users 2020 & 2033
- Table 7: Global Power Quality Meter Industry Revenue Million Forecast, by Region 2020 & 2033
- Table 8: Global Power Quality Meter Industry Volume K Unit Forecast, by Region 2020 & 2033
- Table 9: Global Power Quality Meter Industry Revenue Million Forecast, by Equipment 2020 & 2033
- Table 10: Global Power Quality Meter Industry Volume K Unit Forecast, by Equipment 2020 & 2033
- Table 11: Global Power Quality Meter Industry Revenue Million Forecast, by Phase 2020 & 2033
- Table 12: Global Power Quality Meter Industry Volume K Unit Forecast, by Phase 2020 & 2033
- Table 13: Global Power Quality Meter Industry Revenue Million Forecast, by End-Users 2020 & 2033
- Table 14: Global Power Quality Meter Industry Volume K Unit Forecast, by End-Users 2020 & 2033
- Table 15: Global Power Quality Meter Industry Revenue Million Forecast, by Country 2020 & 2033
- Table 16: Global Power Quality Meter Industry Volume K Unit Forecast, by Country 2020 & 2033
- Table 17: United States Power Quality Meter Industry Revenue (Million) Forecast, by Application 2020 & 2033
- Table 18: United States Power Quality Meter Industry Volume (K Unit) Forecast, by Application 2020 & 2033
- Table 19: Canada Power Quality Meter Industry Revenue (Million) Forecast, by Application 2020 & 2033
- Table 20: Canada Power Quality Meter Industry Volume (K Unit) Forecast, by Application 2020 & 2033
- Table 21: Rest of North America Power Quality Meter Industry Revenue (Million) Forecast, by Application 2020 & 2033
- Table 22: Rest of North America Power Quality Meter Industry Volume (K Unit) Forecast, by Application 2020 & 2033
- Table 23: Global Power Quality Meter Industry Revenue Million Forecast, by Equipment 2020 & 2033
- Table 24: Global Power Quality Meter Industry Volume K Unit Forecast, by Equipment 2020 & 2033
- Table 25: Global Power Quality Meter Industry Revenue Million Forecast, by Phase 2020 & 2033
- Table 26: Global Power Quality Meter Industry Volume K Unit Forecast, by Phase 2020 & 2033
- Table 27: Global Power Quality Meter Industry Revenue Million Forecast, by End-Users 2020 & 2033
- Table 28: Global Power Quality Meter Industry Volume K Unit Forecast, by End-Users 2020 & 2033
- Table 29: Global Power Quality Meter Industry Revenue Million Forecast, by Country 2020 & 2033
- Table 30: Global Power Quality Meter Industry Volume K Unit Forecast, by Country 2020 & 2033
- Table 31: Germany Power Quality Meter Industry Revenue (Million) Forecast, by Application 2020 & 2033
- Table 32: Germany Power Quality Meter Industry Volume (K Unit) Forecast, by Application 2020 & 2033
- Table 33: France Power Quality Meter Industry Revenue (Million) Forecast, by Application 2020 & 2033
- Table 34: France Power Quality Meter Industry Volume (K Unit) Forecast, by Application 2020 & 2033
- Table 35: United Kingdom Power Quality Meter Industry Revenue (Million) Forecast, by Application 2020 & 2033
- Table 36: United Kingdom Power Quality Meter Industry Volume (K Unit) Forecast, by Application 2020 & 2033
- Table 37: Italy Power Quality Meter Industry Revenue (Million) Forecast, by Application 2020 & 2033
- Table 38: Italy Power Quality Meter Industry Volume (K Unit) Forecast, by Application 2020 & 2033
- Table 39: Rest of Europe Power Quality Meter Industry Revenue (Million) Forecast, by Application 2020 & 2033
- Table 40: Rest of Europe Power Quality Meter Industry Volume (K Unit) Forecast, by Application 2020 & 2033
- Table 41: Global Power Quality Meter Industry Revenue Million Forecast, by Equipment 2020 & 2033
- Table 42: Global Power Quality Meter Industry Volume K Unit Forecast, by Equipment 2020 & 2033
- Table 43: Global Power Quality Meter Industry Revenue Million Forecast, by Phase 2020 & 2033
- Table 44: Global Power Quality Meter Industry Volume K Unit Forecast, by Phase 2020 & 2033
- Table 45: Global Power Quality Meter Industry Revenue Million Forecast, by End-Users 2020 & 2033
- Table 46: Global Power Quality Meter Industry Volume K Unit Forecast, by End-Users 2020 & 2033
- Table 47: Global Power Quality Meter Industry Revenue Million Forecast, by Country 2020 & 2033
- Table 48: Global Power Quality Meter Industry Volume K Unit Forecast, by Country 2020 & 2033
- Table 49: China Power Quality Meter Industry Revenue (Million) Forecast, by Application 2020 & 2033
- Table 50: China Power Quality Meter Industry Volume (K Unit) Forecast, by Application 2020 & 2033
- Table 51: India Power Quality Meter Industry Revenue (Million) Forecast, by Application 2020 & 2033
- Table 52: India Power Quality Meter Industry Volume (K Unit) Forecast, by Application 2020 & 2033
- Table 53: Japan Power Quality Meter Industry Revenue (Million) Forecast, by Application 2020 & 2033
- Table 54: Japan Power Quality Meter Industry Volume (K Unit) Forecast, by Application 2020 & 2033
- Table 55: Australia Power Quality Meter Industry Revenue (Million) Forecast, by Application 2020 & 2033
- Table 56: Australia Power Quality Meter Industry Volume (K Unit) Forecast, by Application 2020 & 2033
- Table 57: Rest of Asia Pacific Power Quality Meter Industry Revenue (Million) Forecast, by Application 2020 & 2033
- Table 58: Rest of Asia Pacific Power Quality Meter Industry Volume (K Unit) Forecast, by Application 2020 & 2033
- Table 59: Global Power Quality Meter Industry Revenue Million Forecast, by Equipment 2020 & 2033
- Table 60: Global Power Quality Meter Industry Volume K Unit Forecast, by Equipment 2020 & 2033
- Table 61: Global Power Quality Meter Industry Revenue Million Forecast, by Phase 2020 & 2033
- Table 62: Global Power Quality Meter Industry Volume K Unit Forecast, by Phase 2020 & 2033
- Table 63: Global Power Quality Meter Industry Revenue Million Forecast, by End-Users 2020 & 2033
- Table 64: Global Power Quality Meter Industry Volume K Unit Forecast, by End-Users 2020 & 2033
- Table 65: Global Power Quality Meter Industry Revenue Million Forecast, by Country 2020 & 2033
- Table 66: Global Power Quality Meter Industry Volume K Unit Forecast, by Country 2020 & 2033
- Table 67: Brazil Power Quality Meter Industry Revenue (Million) Forecast, by Application 2020 & 2033
- Table 68: Brazil Power Quality Meter Industry Volume (K Unit) Forecast, by Application 2020 & 2033
- Table 69: Argentina Power Quality Meter Industry Revenue (Million) Forecast, by Application 2020 & 2033
- Table 70: Argentina Power Quality Meter Industry Volume (K Unit) Forecast, by Application 2020 & 2033
- Table 71: Chile Power Quality Meter Industry Revenue (Million) Forecast, by Application 2020 & 2033
- Table 72: Chile Power Quality Meter Industry Volume (K Unit) Forecast, by Application 2020 & 2033
- Table 73: Rest of South America Power Quality Meter Industry Revenue (Million) Forecast, by Application 2020 & 2033
- Table 74: Rest of South America Power Quality Meter Industry Volume (K Unit) Forecast, by Application 2020 & 2033
- Table 75: Global Power Quality Meter Industry Revenue Million Forecast, by Equipment 2020 & 2033
- Table 76: Global Power Quality Meter Industry Volume K Unit Forecast, by Equipment 2020 & 2033
- Table 77: Global Power Quality Meter Industry Revenue Million Forecast, by Phase 2020 & 2033
- Table 78: Global Power Quality Meter Industry Volume K Unit Forecast, by Phase 2020 & 2033
- Table 79: Global Power Quality Meter Industry Revenue Million Forecast, by End-Users 2020 & 2033
- Table 80: Global Power Quality Meter Industry Volume K Unit Forecast, by End-Users 2020 & 2033
- Table 81: Global Power Quality Meter Industry Revenue Million Forecast, by Country 2020 & 2033
- Table 82: Global Power Quality Meter Industry Volume K Unit Forecast, by Country 2020 & 2033
- Table 83: United Arab Emirates Power Quality Meter Industry Revenue (Million) Forecast, by Application 2020 & 2033
- Table 84: United Arab Emirates Power Quality Meter Industry Volume (K Unit) Forecast, by Application 2020 & 2033
- Table 85: Qatar Power Quality Meter Industry Revenue (Million) Forecast, by Application 2020 & 2033
- Table 86: Qatar Power Quality Meter Industry Volume (K Unit) Forecast, by Application 2020 & 2033
- Table 87: Saudi Arabia Power Quality Meter Industry Revenue (Million) Forecast, by Application 2020 & 2033
- Table 88: Saudi Arabia Power Quality Meter Industry Volume (K Unit) Forecast, by Application 2020 & 2033
- Table 89: South Africa Power Quality Meter Industry Revenue (Million) Forecast, by Application 2020 & 2033
- Table 90: South Africa Power Quality Meter Industry Volume (K Unit) Forecast, by Application 2020 & 2033
- Table 91: Egypt Power Quality Meter Industry Revenue (Million) Forecast, by Application 2020 & 2033
- Table 92: Egypt Power Quality Meter Industry Volume (K Unit) Forecast, by Application 2020 & 2033
- Table 93: Rest of Middle East and Africa Power Quality Meter Industry Revenue (Million) Forecast, by Application 2020 & 2033
- Table 94: Rest of Middle East and Africa Power Quality Meter Industry Volume (K Unit) Forecast, by Application 2020 & 2033
Frequently Asked Questions
1. What is the projected Compound Annual Growth Rate (CAGR) of the Power Quality Meter Industry?
The projected CAGR is approximately 7.40%.
2. Which companies are prominent players in the Power Quality Meter Industry?
Key companies in the market include Active Power Inc, Hitachi Energy Ltd, Toshiba Corporation, Siemens AG, Schneider Electric SE, EATON Corporation Plc, MTE Corporation, General Electric Company, Schaffner, Emerson Electric Company.
3. What are the main segments of the Power Quality Meter Industry?
The market segments include Equipment, Phase, End-Users.
4. Can you provide details about the market size?
The market size is estimated to be USD 16.82 Million as of 2022.
5. What are some drivers contributing to market growth?
4.; Increasing Demand For Power Quality In Industrial And Manufacturing Sectors4.; Increase In Smart Grid Infrastructure.
6. What are the notable trends driving market growth?
Industrial and Manufacturing Segment to Dominate the Market.
7. Are there any restraints impacting market growth?
4.; High Costs Of Power Quality Equipment.
8. Can you provide examples of recent developments in the market?
In June 2023, Germany’s Government announced plans to digitalise its grid, notably at the low-voltage or distribution level, through a new “smart grids” legal framework. The Metering Point Operation Act mandates a 20% roll-out of smart meters by the end of 2025 and 50% by the end of 2028.
9. What pricing options are available for accessing the report?
Pricing options include single-user, multi-user, and enterprise licenses priced at USD 4750, USD 5250, and USD 8750 respectively.
10. Is the market size provided in terms of value or volume?
The market size is provided in terms of value, measured in Million and volume, measured in K Unit.
11. Are there any specific market keywords associated with the report?
Yes, the market keyword associated with the report is "Power Quality Meter Industry," which aids in identifying and referencing the specific market segment covered.
12. How do I determine which pricing option suits my needs best?
The pricing options vary based on user requirements and access needs. Individual users may opt for single-user licenses, while businesses requiring broader access may choose multi-user or enterprise licenses for cost-effective access to the report.
13. Are there any additional resources or data provided in the Power Quality Meter Industry report?
While the report offers comprehensive insights, it's advisable to review the specific contents or supplementary materials provided to ascertain if additional resources or data are available.
14. How can I stay updated on further developments or reports in the Power Quality Meter Industry?
To stay informed about further developments, trends, and reports in the Power Quality Meter Industry, consider subscribing to industry newsletters, following relevant companies and organizations, or regularly checking reputable industry news sources and publications.
Methodology
Step 1 - Identification of Relevant Samples Size from Population Database


Step 2 - Approaches for Defining Global Market Size (Value, Volume* & Price*)

Note*: In applicable scenarios
Step 3 - Data Sources
Primary Research
- Web Analytics
- Survey Reports
- Research Institute
- Latest Research Reports
- Opinion Leaders
Secondary Research
- Annual Reports
- White Paper
- Latest Press Release
- Industry Association
- Paid Database
- Investor Presentations

Step 4 - Data Triangulation
Involves using different sources of information in order to increase the validity of a study
These sources are likely to be stakeholders in a program - participants, other researchers, program staff, other community members, and so on.
Then we put all data in single framework & apply various statistical tools to find out the dynamic on the market.
During the analysis stage, feedback from the stakeholder groups would be compared to determine areas of agreement as well as areas of divergence