

Key Insights
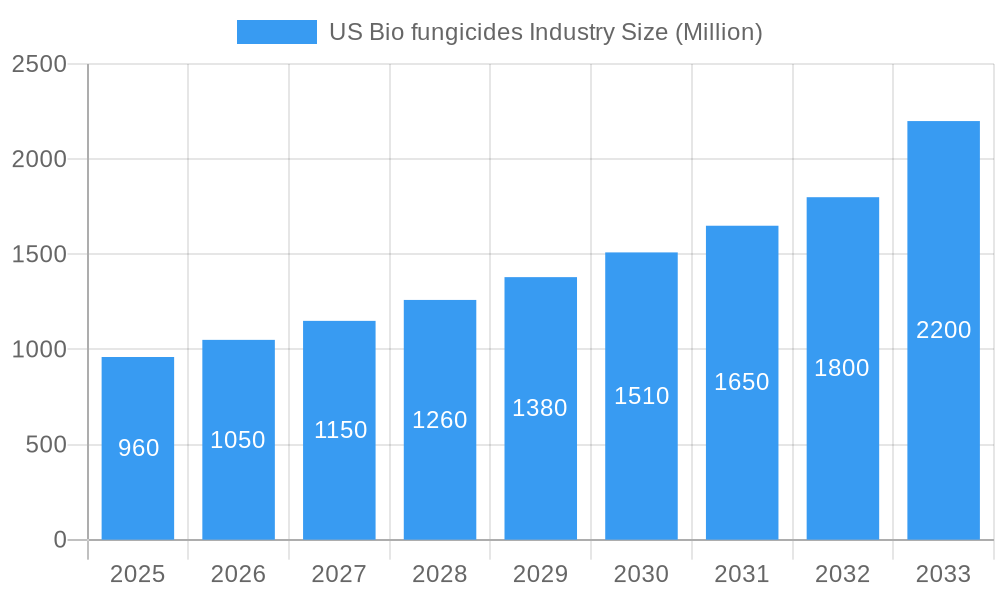
The US biofungicides market, valued at $0.96 billion in 2025, is projected to experience robust growth, driven by increasing awareness of environmental concerns surrounding conventional chemical fungicides and a rising demand for sustainable agricultural practices. The market's Compound Annual Growth Rate (CAGR) of 9.5% from 2025 to 2033 indicates a significant expansion, reaching an estimated value exceeding $2.2 billion by 2033. This growth is fueled by several key factors, including the increasing prevalence of fungal diseases affecting various crops, stringent government regulations on chemical fungicides, and the growing adoption of integrated pest management (IPM) strategies by farmers. The segments within the market, encompassing grains and cereals, oilseeds, commercial crops, fruits and vegetables, and turf and ornamentals, all contribute significantly to the overall market expansion, reflecting a broad application across agricultural sectors. The leading players, such as BioWorks Inc, Novozyme Biologicals, and Syngenta AG, are constantly innovating and expanding their product portfolios, further driving market growth.
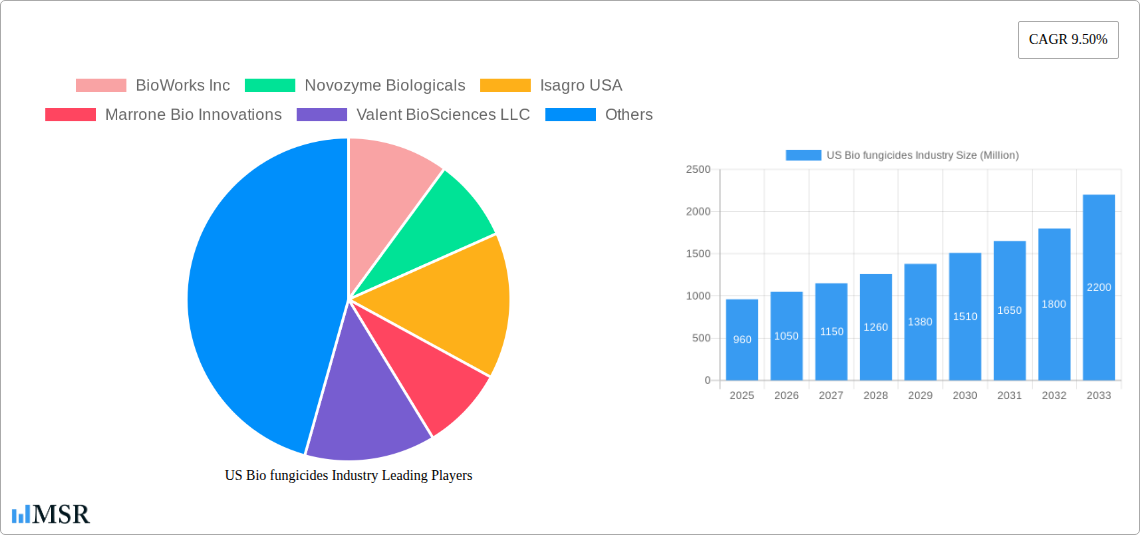
US Bio fungicides Industry Market Size (In Million)
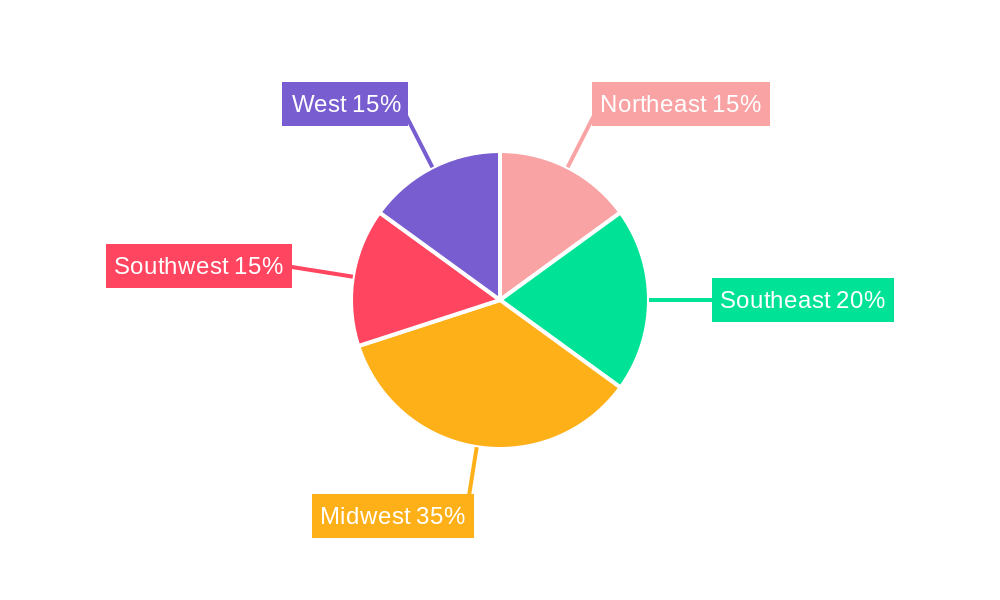
The regional breakdown within the United States shows diverse growth potential across the Northeast, Southeast, Midwest, Southwest, and West regions. Factors such as climatic conditions, prevalent crop types, and farming practices influence the market dynamics in each region. While the Midwest, with its extensive grain and oilseed production, may currently hold a larger market share, the other regions are expected to witness substantial growth driven by the increasing adoption of biofungicides in specialty crops and horticulture. However, challenges such as high initial investment costs for biofungicide adoption and the sometimes slower efficacy compared to chemical alternatives pose restraints to the market's expansion. Despite these hurdles, the increasing awareness of the long-term environmental and health benefits associated with biofungicides is expected to propel the market towards sustained and significant growth over the forecast period.
US Bio fungicides Industry Company Market Share
US Biofungicides Industry Market Report: 2019-2033
This comprehensive report provides an in-depth analysis of the US biofungicides market, offering actionable insights for industry stakeholders. The study period spans from 2019 to 2033, with 2025 serving as the base and estimated year. The forecast period is 2025-2033, and the historical period covers 2019-2024. This report is essential for understanding market dynamics, identifying growth opportunities, and navigating the competitive landscape of this rapidly evolving sector. The US biofungicides market is projected to reach xx Million by 2033, exhibiting a CAGR of xx% during the forecast period.
US Bio fungicides Industry Market Concentration & Dynamics
The US biofungicides market exhibits a moderately concentrated landscape, with a handful of major players holding significant market share. The top five companies—BioWorks Inc, Novozyme Biologicals, Isagro USA, Marrone Bio Innovations, and Valent BioSciences LLC—collectively account for an estimated 45% of the market in 2025. Syngenta AG, De Sangosse Lt, and Certis USA LLC also hold substantial shares, contributing to the overall market competitiveness.
Market concentration is influenced by factors such as:
- Innovation Ecosystems: Robust R&D investments and strategic collaborations drive innovation, leading to new product introductions and enhanced market competitiveness.
- Regulatory Frameworks: EPA regulations and biopesticide approvals influence market access and product development strategies.
- Substitute Products: The availability of chemical fungicides presents a competitive challenge, demanding ongoing innovation to showcase the benefits of biofungicides.
- End-User Trends: Growing consumer demand for sustainable and environmentally friendly agricultural practices fuels the adoption of biofungicides.
- M&A Activities: Consolidation through mergers and acquisitions (M&A) is expected to continue, shaping market dynamics and influencing market share distribution. An estimated xx M&A deals occurred between 2019 and 2024.
US Bio fungicides Industry Industry Insights & Trends
The US biofungicides market is experiencing robust growth, driven by several key factors. The market size was valued at xx Million in 2025 and is projected to reach xx Million by 2033. Several factors contribute to this expansion:
- Increasing awareness of environmental concerns: Growing consumer preference for organically produced food and reduced reliance on chemical pesticides is a major driver.
- Stringent regulations on chemical pesticides: Governmental push towards sustainable agriculture promotes the adoption of biofungicides.
- Technological advancements: Continuous improvements in biofungicide formulation and application techniques enhance efficacy and user-friendliness.
- Rising prevalence of fungal diseases: Increased disease incidence in various crops necessitates effective and environmentally benign control measures.
- Growing demand for high-quality crops: Biofungicides contribute to improved crop quality and yield, further boosting market demand.
Key Markets & Segments Leading US Bio fungicides Industry
The US biofungicides market demonstrates strong performance across several key segments. While the precise breakdown of market share by segment is unavailable at this time (we will denote with xx), we can discuss the relative growth trends:
Dominant Segments:
Fruits and Vegetables: This segment is expected to dominate due to the high value of the produce and increasing consumer demand for high-quality, chemical-free fruits and vegetables. Drivers include strong economic growth in this sector and supportive government policies.
Grains and Cereals: This segment shows significant growth due to the large acreage under cultivation and the increasing prevalence of fungal diseases affecting yields. Factors driving growth include favorable weather patterns in certain regions and adoption of advanced farming techniques.
Other segments: The other segments, including Oilseeds, Commercial Crops, and Turf and Ornamentals, also show promising growth potential, driven by specific needs and technological advancements within each sector. However, Fruits and Vegetables maintains the largest market share at this time.
US Bio fungicides Industry Product Developments
Recent product innovations in the US biofungicides market focus on enhanced efficacy, broader spectrum activity, and improved formulation for ease of application. Companies are actively developing new biofungicide formulations incorporating advanced delivery systems and combining multiple biocontrol agents for synergistic effects. This enhances their competitive edge and addresses specific needs within different crop segments.
Challenges in the US Bio fungicides Industry Market
The US biofungicides market faces challenges including:
Regulatory hurdles: The approval process for new biofungicides can be lengthy and complex. This delays market entry and increases development costs.
Supply chain issues: Production and distribution of biofungicides can be affected by factors like raw material availability and logistics, leading to price fluctuations.
Competitive pressure from chemical fungicides: Chemical fungicides often remain cost-competitive, posing a challenge for biofungicide adoption. xx% of the market is estimated to still rely primarily on chemical fungicides.
Forces Driving US Bio fungicides Industry Growth
Several factors contribute to the long-term growth of the US biofungicides market:
- Technological advancements: Continuous innovation in formulation, delivery systems, and biocontrol agent discovery drives market expansion.
- Government support for sustainable agriculture: Policies promoting the adoption of biopesticides and organic farming practices boost market growth.
- Growing consumer awareness of environmental and health concerns: Demand for organically produced food and reduced reliance on synthetic chemicals fuel market expansion.
Challenges in the US Bio fungicides Industry Market
Long-term growth catalysts for the US biofungicides market include:
- Strategic partnerships: Collaborative efforts between research institutions, biopesticide companies, and agricultural producers accelerate innovation and market penetration.
- Market expansion into new crop segments: Development of biofungicides for new crops and applications expands the addressable market size.
- Product diversification: Companies are expanding their product portfolios to offer diverse solutions addressing various fungal pathogens and crop types.
Emerging Opportunities in US Bio fungicides Industry
Emerging opportunities include:
- Biofungicide combinations: Development of products combining different biocontrol agents for enhanced efficacy and broader spectrum control.
- Precision application technologies: Integration of biofungicides with precision farming techniques improves efficiency and reduces environmental impact.
- Expansion into niche markets: Targeting specialized crop segments and exploring new applications, like in turf and ornamental management, offers significant growth potential.
Leading Players in the US Bio fungicides Industry Sector
Key Milestones in US Bio fungicides Industry Industry
- 2020: Increased regulatory approvals for several new biofungicides.
- 2021: Significant investments in R&D by major players in the biofungicide sector.
- 2022: Launch of several novel biofungicide formulations with enhanced efficacy and improved application methods.
- 2023: Several key M&A activities reshaping market dynamics and creating larger, more integrated biopesticide companies.
- 2024: Growing adoption of biofungicides driven by increased consumer awareness and regulatory pressure to reduce chemical pesticide use.
Strategic Outlook for US Bio fungicides Industry Market
The US biofungicides market shows tremendous long-term growth potential, driven by ongoing innovation, favorable regulatory frameworks, and increasing consumer demand for sustainable agriculture. Strategic opportunities include expanding into new geographical markets, developing advanced biofungicide formulations, and forging strategic partnerships to enhance market access and accelerate product development. The continued focus on sustainable agriculture practices and the increasing prevalence of plant diseases will drive significant growth in the market over the next decade.
US Bio fungicides Industry Segmentation
- 1. Production Analysis
- 2. Consumption Analysis
- 3. Import Market Analysis (Value & Volume)
- 4. Export Market Analysis (Value & Volume)
- 5. Price Trend Analysis
US Bio fungicides Industry Segmentation By Geography
-
1. North America
- 1.1. United States
- 1.2. Canada
- 1.3. Mexico
-
2. South America
- 2.1. Brazil
- 2.2. Argentina
- 2.3. Rest of South America
-
3. Europe
- 3.1. United Kingdom
- 3.2. Germany
- 3.3. France
- 3.4. Italy
- 3.5. Spain
- 3.6. Russia
- 3.7. Benelux
- 3.8. Nordics
- 3.9. Rest of Europe
-
4. Middle East & Africa
- 4.1. Turkey
- 4.2. Israel
- 4.3. GCC
- 4.4. North Africa
- 4.5. South Africa
- 4.6. Rest of Middle East & Africa
-
5. Asia Pacific
- 5.1. China
- 5.2. India
- 5.3. Japan
- 5.4. South Korea
- 5.5. ASEAN
- 5.6. Oceania
- 5.7. Rest of Asia Pacific
US Bio fungicides Industry Regional Market Share
Geographic Coverage of US Bio fungicides Industry
US Bio fungicides Industry REPORT HIGHLIGHTS
| Aspects | Details |
|---|---|
| Study Period | 2020-2034 |
| Base Year | 2025 |
| Estimated Year | 2026 |
| Forecast Period | 2026-2034 |
| Historical Period | 2020-2025 |
| Growth Rate | CAGR of 9.50% from 2020-2034 |
| Segmentation |
|
Table of Contents
- 1. Introduction
- 1.1. Research Scope
- 1.2. Market Segmentation
- 1.3. Research Objective
- 1.4. Definitions and Assumptions
- 2. Executive Summary
- 2.1. Market Snapshot
- 3. Market Dynamics
- 3.1. Market Drivers
- 3.2. Market Restrains
- 3.3. Market Trends
- 3.4. Market Opportunities
- 4. Market Factor Analysis
- 4.1. Porters Five Forces
- 4.1.1. Bargaining Power of Suppliers
- 4.1.2. Bargaining Power of Buyers
- 4.1.3. Threat of New Entrants
- 4.1.4. Threat of Substitutes
- 4.1.5. Competitive Rivalry
- 4.2. PESTEL analysis
- 4.3. BCG Analysis
- 4.3.1. Stars (High Growth, High Market Share)
- 4.3.2. Cash Cows (Low Growth, High Market Share)
- 4.3.3. Question Mark (High Growth, Low Market Share)
- 4.3.4. Dogs (Low Growth, Low Market Share)
- 4.4. Ansoff Matrix Analysis
- 4.5. Supply Chain Analysis
- 4.6. Regulatory Landscape
- 4.7. Current Market Potential and Opportunity Assessment (TAM–SAM–SOM Framework)
- 4.8. MSR Analyst Note
- 4.1. Porters Five Forces
- 5. Market Analysis, Insights and Forecast 2021-2033
- 5.1. Market Analysis, Insights and Forecast - by Production Analysis
- 5.2. Market Analysis, Insights and Forecast - by Consumption Analysis
- 5.3. Market Analysis, Insights and Forecast - by Import Market Analysis (Value & Volume)
- 5.4. Market Analysis, Insights and Forecast - by Export Market Analysis (Value & Volume)
- 5.5. Market Analysis, Insights and Forecast - by Price Trend Analysis
- 5.6. Market Analysis, Insights and Forecast - by Region
- 5.6.1. North America
- 5.6.2. South America
- 5.6.3. Europe
- 5.6.4. Middle East & Africa
- 5.6.5. Asia Pacific
- 6. Global US Bio fungicides Industry Analysis, Insights and Forecast, 2021-2033
- 6.1. Market Analysis, Insights and Forecast - by Production Analysis
- 6.2. Market Analysis, Insights and Forecast - by Consumption Analysis
- 6.3. Market Analysis, Insights and Forecast - by Import Market Analysis (Value & Volume)
- 6.4. Market Analysis, Insights and Forecast - by Export Market Analysis (Value & Volume)
- 6.5. Market Analysis, Insights and Forecast - by Price Trend Analysis
- 7. North America US Bio fungicides Industry Analysis, Insights and Forecast, 2020-2032
- 7.1. Market Analysis, Insights and Forecast - by Production Analysis
- 7.2. Market Analysis, Insights and Forecast - by Consumption Analysis
- 7.3. Market Analysis, Insights and Forecast - by Import Market Analysis (Value & Volume)
- 7.4. Market Analysis, Insights and Forecast - by Export Market Analysis (Value & Volume)
- 7.5. Market Analysis, Insights and Forecast - by Price Trend Analysis
- 8. South America US Bio fungicides Industry Analysis, Insights and Forecast, 2020-2032
- 8.1. Market Analysis, Insights and Forecast - by Production Analysis
- 8.2. Market Analysis, Insights and Forecast - by Consumption Analysis
- 8.3. Market Analysis, Insights and Forecast - by Import Market Analysis (Value & Volume)
- 8.4. Market Analysis, Insights and Forecast - by Export Market Analysis (Value & Volume)
- 8.5. Market Analysis, Insights and Forecast - by Price Trend Analysis
- 9. Europe US Bio fungicides Industry Analysis, Insights and Forecast, 2020-2032
- 9.1. Market Analysis, Insights and Forecast - by Production Analysis
- 9.2. Market Analysis, Insights and Forecast - by Consumption Analysis
- 9.3. Market Analysis, Insights and Forecast - by Import Market Analysis (Value & Volume)
- 9.4. Market Analysis, Insights and Forecast - by Export Market Analysis (Value & Volume)
- 9.5. Market Analysis, Insights and Forecast - by Price Trend Analysis
- 10. Middle East & Africa US Bio fungicides Industry Analysis, Insights and Forecast, 2020-2032
- 10.1. Market Analysis, Insights and Forecast - by Production Analysis
- 10.2. Market Analysis, Insights and Forecast - by Consumption Analysis
- 10.3. Market Analysis, Insights and Forecast - by Import Market Analysis (Value & Volume)
- 10.4. Market Analysis, Insights and Forecast - by Export Market Analysis (Value & Volume)
- 10.5. Market Analysis, Insights and Forecast - by Price Trend Analysis
- 11. Asia Pacific US Bio fungicides Industry Analysis, Insights and Forecast, 2020-2032
- 11.1. Market Analysis, Insights and Forecast - by Production Analysis
- 11.2. Market Analysis, Insights and Forecast - by Consumption Analysis
- 11.3. Market Analysis, Insights and Forecast - by Import Market Analysis (Value & Volume)
- 11.4. Market Analysis, Insights and Forecast - by Export Market Analysis (Value & Volume)
- 11.5. Market Analysis, Insights and Forecast - by Price Trend Analysis
- 12. Competitive Analysis
- 12.1. Company Profiles
- 12.1.1 BioWorks Inc
- 12.1.1.1. Company Overview
- 12.1.1.2. Products
- 12.1.1.3. Company Financials
- 12.1.1.4. SWOT Analysis
- 12.1.2 Novozyme Biologicals
- 12.1.2.1. Company Overview
- 12.1.2.2. Products
- 12.1.2.3. Company Financials
- 12.1.2.4. SWOT Analysis
- 12.1.3 Isagro USA
- 12.1.3.1. Company Overview
- 12.1.3.2. Products
- 12.1.3.3. Company Financials
- 12.1.3.4. SWOT Analysis
- 12.1.4 Marrone Bio Innovations
- 12.1.4.1. Company Overview
- 12.1.4.2. Products
- 12.1.4.3. Company Financials
- 12.1.4.4. SWOT Analysis
- 12.1.5 Valent BioSciences LLC
- 12.1.5.1. Company Overview
- 12.1.5.2. Products
- 12.1.5.3. Company Financials
- 12.1.5.4. SWOT Analysis
- 12.1.6 Syngenta AG
- 12.1.6.1. Company Overview
- 12.1.6.2. Products
- 12.1.6.3. Company Financials
- 12.1.6.4. SWOT Analysis
- 12.1.7 De Sangosse Lt
- 12.1.7.1. Company Overview
- 12.1.7.2. Products
- 12.1.7.3. Company Financials
- 12.1.7.4. SWOT Analysis
- 12.1.8 Certis USA LLC
- 12.1.8.1. Company Overview
- 12.1.8.2. Products
- 12.1.8.3. Company Financials
- 12.1.8.4. SWOT Analysis
- 12.1.1 BioWorks Inc
- 12.2. Market Entropy
- 12.2.1 Company's Key Areas Served
- 12.2.2 Recent Developments
- 12.3. Company Market Share Analysis 2025
- 12.3.1 Top 5 Companies Market Share Analysis
- 12.3.2 Top 3 Companies Market Share Analysis
- 12.4. List of Potential Customers
- 13. Research Methodology
List of Figures
- Figure 1: Global US Bio fungicides Industry Revenue Breakdown (Million, %) by Region 2025 & 2033
- Figure 2: North America US Bio fungicides Industry Revenue (Million), by Production Analysis 2025 & 2033
- Figure 3: North America US Bio fungicides Industry Revenue Share (%), by Production Analysis 2025 & 2033
- Figure 4: North America US Bio fungicides Industry Revenue (Million), by Consumption Analysis 2025 & 2033
- Figure 5: North America US Bio fungicides Industry Revenue Share (%), by Consumption Analysis 2025 & 2033
- Figure 6: North America US Bio fungicides Industry Revenue (Million), by Import Market Analysis (Value & Volume) 2025 & 2033
- Figure 7: North America US Bio fungicides Industry Revenue Share (%), by Import Market Analysis (Value & Volume) 2025 & 2033
- Figure 8: North America US Bio fungicides Industry Revenue (Million), by Export Market Analysis (Value & Volume) 2025 & 2033
- Figure 9: North America US Bio fungicides Industry Revenue Share (%), by Export Market Analysis (Value & Volume) 2025 & 2033
- Figure 10: North America US Bio fungicides Industry Revenue (Million), by Price Trend Analysis 2025 & 2033
- Figure 11: North America US Bio fungicides Industry Revenue Share (%), by Price Trend Analysis 2025 & 2033
- Figure 12: North America US Bio fungicides Industry Revenue (Million), by Country 2025 & 2033
- Figure 13: North America US Bio fungicides Industry Revenue Share (%), by Country 2025 & 2033
- Figure 14: South America US Bio fungicides Industry Revenue (Million), by Production Analysis 2025 & 2033
- Figure 15: South America US Bio fungicides Industry Revenue Share (%), by Production Analysis 2025 & 2033
- Figure 16: South America US Bio fungicides Industry Revenue (Million), by Consumption Analysis 2025 & 2033
- Figure 17: South America US Bio fungicides Industry Revenue Share (%), by Consumption Analysis 2025 & 2033
- Figure 18: South America US Bio fungicides Industry Revenue (Million), by Import Market Analysis (Value & Volume) 2025 & 2033
- Figure 19: South America US Bio fungicides Industry Revenue Share (%), by Import Market Analysis (Value & Volume) 2025 & 2033
- Figure 20: South America US Bio fungicides Industry Revenue (Million), by Export Market Analysis (Value & Volume) 2025 & 2033
- Figure 21: South America US Bio fungicides Industry Revenue Share (%), by Export Market Analysis (Value & Volume) 2025 & 2033
- Figure 22: South America US Bio fungicides Industry Revenue (Million), by Price Trend Analysis 2025 & 2033
- Figure 23: South America US Bio fungicides Industry Revenue Share (%), by Price Trend Analysis 2025 & 2033
- Figure 24: South America US Bio fungicides Industry Revenue (Million), by Country 2025 & 2033
- Figure 25: South America US Bio fungicides Industry Revenue Share (%), by Country 2025 & 2033
- Figure 26: Europe US Bio fungicides Industry Revenue (Million), by Production Analysis 2025 & 2033
- Figure 27: Europe US Bio fungicides Industry Revenue Share (%), by Production Analysis 2025 & 2033
- Figure 28: Europe US Bio fungicides Industry Revenue (Million), by Consumption Analysis 2025 & 2033
- Figure 29: Europe US Bio fungicides Industry Revenue Share (%), by Consumption Analysis 2025 & 2033
- Figure 30: Europe US Bio fungicides Industry Revenue (Million), by Import Market Analysis (Value & Volume) 2025 & 2033
- Figure 31: Europe US Bio fungicides Industry Revenue Share (%), by Import Market Analysis (Value & Volume) 2025 & 2033
- Figure 32: Europe US Bio fungicides Industry Revenue (Million), by Export Market Analysis (Value & Volume) 2025 & 2033
- Figure 33: Europe US Bio fungicides Industry Revenue Share (%), by Export Market Analysis (Value & Volume) 2025 & 2033
- Figure 34: Europe US Bio fungicides Industry Revenue (Million), by Price Trend Analysis 2025 & 2033
- Figure 35: Europe US Bio fungicides Industry Revenue Share (%), by Price Trend Analysis 2025 & 2033
- Figure 36: Europe US Bio fungicides Industry Revenue (Million), by Country 2025 & 2033
- Figure 37: Europe US Bio fungicides Industry Revenue Share (%), by Country 2025 & 2033
- Figure 38: Middle East & Africa US Bio fungicides Industry Revenue (Million), by Production Analysis 2025 & 2033
- Figure 39: Middle East & Africa US Bio fungicides Industry Revenue Share (%), by Production Analysis 2025 & 2033
- Figure 40: Middle East & Africa US Bio fungicides Industry Revenue (Million), by Consumption Analysis 2025 & 2033
- Figure 41: Middle East & Africa US Bio fungicides Industry Revenue Share (%), by Consumption Analysis 2025 & 2033
- Figure 42: Middle East & Africa US Bio fungicides Industry Revenue (Million), by Import Market Analysis (Value & Volume) 2025 & 2033
- Figure 43: Middle East & Africa US Bio fungicides Industry Revenue Share (%), by Import Market Analysis (Value & Volume) 2025 & 2033
- Figure 44: Middle East & Africa US Bio fungicides Industry Revenue (Million), by Export Market Analysis (Value & Volume) 2025 & 2033
- Figure 45: Middle East & Africa US Bio fungicides Industry Revenue Share (%), by Export Market Analysis (Value & Volume) 2025 & 2033
- Figure 46: Middle East & Africa US Bio fungicides Industry Revenue (Million), by Price Trend Analysis 2025 & 2033
- Figure 47: Middle East & Africa US Bio fungicides Industry Revenue Share (%), by Price Trend Analysis 2025 & 2033
- Figure 48: Middle East & Africa US Bio fungicides Industry Revenue (Million), by Country 2025 & 2033
- Figure 49: Middle East & Africa US Bio fungicides Industry Revenue Share (%), by Country 2025 & 2033
- Figure 50: Asia Pacific US Bio fungicides Industry Revenue (Million), by Production Analysis 2025 & 2033
- Figure 51: Asia Pacific US Bio fungicides Industry Revenue Share (%), by Production Analysis 2025 & 2033
- Figure 52: Asia Pacific US Bio fungicides Industry Revenue (Million), by Consumption Analysis 2025 & 2033
- Figure 53: Asia Pacific US Bio fungicides Industry Revenue Share (%), by Consumption Analysis 2025 & 2033
- Figure 54: Asia Pacific US Bio fungicides Industry Revenue (Million), by Import Market Analysis (Value & Volume) 2025 & 2033
- Figure 55: Asia Pacific US Bio fungicides Industry Revenue Share (%), by Import Market Analysis (Value & Volume) 2025 & 2033
- Figure 56: Asia Pacific US Bio fungicides Industry Revenue (Million), by Export Market Analysis (Value & Volume) 2025 & 2033
- Figure 57: Asia Pacific US Bio fungicides Industry Revenue Share (%), by Export Market Analysis (Value & Volume) 2025 & 2033
- Figure 58: Asia Pacific US Bio fungicides Industry Revenue (Million), by Price Trend Analysis 2025 & 2033
- Figure 59: Asia Pacific US Bio fungicides Industry Revenue Share (%), by Price Trend Analysis 2025 & 2033
- Figure 60: Asia Pacific US Bio fungicides Industry Revenue (Million), by Country 2025 & 2033
- Figure 61: Asia Pacific US Bio fungicides Industry Revenue Share (%), by Country 2025 & 2033
List of Tables
- Table 1: Global US Bio fungicides Industry Revenue Million Forecast, by Production Analysis 2020 & 2033
- Table 2: Global US Bio fungicides Industry Revenue Million Forecast, by Consumption Analysis 2020 & 2033
- Table 3: Global US Bio fungicides Industry Revenue Million Forecast, by Import Market Analysis (Value & Volume) 2020 & 2033
- Table 4: Global US Bio fungicides Industry Revenue Million Forecast, by Export Market Analysis (Value & Volume) 2020 & 2033
- Table 5: Global US Bio fungicides Industry Revenue Million Forecast, by Price Trend Analysis 2020 & 2033
- Table 6: Global US Bio fungicides Industry Revenue Million Forecast, by Region 2020 & 2033
- Table 7: Global US Bio fungicides Industry Revenue Million Forecast, by Production Analysis 2020 & 2033
- Table 8: Global US Bio fungicides Industry Revenue Million Forecast, by Consumption Analysis 2020 & 2033
- Table 9: Global US Bio fungicides Industry Revenue Million Forecast, by Import Market Analysis (Value & Volume) 2020 & 2033
- Table 10: Global US Bio fungicides Industry Revenue Million Forecast, by Export Market Analysis (Value & Volume) 2020 & 2033
- Table 11: Global US Bio fungicides Industry Revenue Million Forecast, by Price Trend Analysis 2020 & 2033
- Table 12: Global US Bio fungicides Industry Revenue Million Forecast, by Country 2020 & 2033
- Table 13: United States US Bio fungicides Industry Revenue (Million) Forecast, by Application 2020 & 2033
- Table 14: Canada US Bio fungicides Industry Revenue (Million) Forecast, by Application 2020 & 2033
- Table 15: Mexico US Bio fungicides Industry Revenue (Million) Forecast, by Application 2020 & 2033
- Table 16: Global US Bio fungicides Industry Revenue Million Forecast, by Production Analysis 2020 & 2033
- Table 17: Global US Bio fungicides Industry Revenue Million Forecast, by Consumption Analysis 2020 & 2033
- Table 18: Global US Bio fungicides Industry Revenue Million Forecast, by Import Market Analysis (Value & Volume) 2020 & 2033
- Table 19: Global US Bio fungicides Industry Revenue Million Forecast, by Export Market Analysis (Value & Volume) 2020 & 2033
- Table 20: Global US Bio fungicides Industry Revenue Million Forecast, by Price Trend Analysis 2020 & 2033
- Table 21: Global US Bio fungicides Industry Revenue Million Forecast, by Country 2020 & 2033
- Table 22: Brazil US Bio fungicides Industry Revenue (Million) Forecast, by Application 2020 & 2033
- Table 23: Argentina US Bio fungicides Industry Revenue (Million) Forecast, by Application 2020 & 2033
- Table 24: Rest of South America US Bio fungicides Industry Revenue (Million) Forecast, by Application 2020 & 2033
- Table 25: Global US Bio fungicides Industry Revenue Million Forecast, by Production Analysis 2020 & 2033
- Table 26: Global US Bio fungicides Industry Revenue Million Forecast, by Consumption Analysis 2020 & 2033
- Table 27: Global US Bio fungicides Industry Revenue Million Forecast, by Import Market Analysis (Value & Volume) 2020 & 2033
- Table 28: Global US Bio fungicides Industry Revenue Million Forecast, by Export Market Analysis (Value & Volume) 2020 & 2033
- Table 29: Global US Bio fungicides Industry Revenue Million Forecast, by Price Trend Analysis 2020 & 2033
- Table 30: Global US Bio fungicides Industry Revenue Million Forecast, by Country 2020 & 2033
- Table 31: United Kingdom US Bio fungicides Industry Revenue (Million) Forecast, by Application 2020 & 2033
- Table 32: Germany US Bio fungicides Industry Revenue (Million) Forecast, by Application 2020 & 2033
- Table 33: France US Bio fungicides Industry Revenue (Million) Forecast, by Application 2020 & 2033
- Table 34: Italy US Bio fungicides Industry Revenue (Million) Forecast, by Application 2020 & 2033
- Table 35: Spain US Bio fungicides Industry Revenue (Million) Forecast, by Application 2020 & 2033
- Table 36: Russia US Bio fungicides Industry Revenue (Million) Forecast, by Application 2020 & 2033
- Table 37: Benelux US Bio fungicides Industry Revenue (Million) Forecast, by Application 2020 & 2033
- Table 38: Nordics US Bio fungicides Industry Revenue (Million) Forecast, by Application 2020 & 2033
- Table 39: Rest of Europe US Bio fungicides Industry Revenue (Million) Forecast, by Application 2020 & 2033
- Table 40: Global US Bio fungicides Industry Revenue Million Forecast, by Production Analysis 2020 & 2033
- Table 41: Global US Bio fungicides Industry Revenue Million Forecast, by Consumption Analysis 2020 & 2033
- Table 42: Global US Bio fungicides Industry Revenue Million Forecast, by Import Market Analysis (Value & Volume) 2020 & 2033
- Table 43: Global US Bio fungicides Industry Revenue Million Forecast, by Export Market Analysis (Value & Volume) 2020 & 2033
- Table 44: Global US Bio fungicides Industry Revenue Million Forecast, by Price Trend Analysis 2020 & 2033
- Table 45: Global US Bio fungicides Industry Revenue Million Forecast, by Country 2020 & 2033
- Table 46: Turkey US Bio fungicides Industry Revenue (Million) Forecast, by Application 2020 & 2033
- Table 47: Israel US Bio fungicides Industry Revenue (Million) Forecast, by Application 2020 & 2033
- Table 48: GCC US Bio fungicides Industry Revenue (Million) Forecast, by Application 2020 & 2033
- Table 49: North Africa US Bio fungicides Industry Revenue (Million) Forecast, by Application 2020 & 2033
- Table 50: South Africa US Bio fungicides Industry Revenue (Million) Forecast, by Application 2020 & 2033
- Table 51: Rest of Middle East & Africa US Bio fungicides Industry Revenue (Million) Forecast, by Application 2020 & 2033
- Table 52: Global US Bio fungicides Industry Revenue Million Forecast, by Production Analysis 2020 & 2033
- Table 53: Global US Bio fungicides Industry Revenue Million Forecast, by Consumption Analysis 2020 & 2033
- Table 54: Global US Bio fungicides Industry Revenue Million Forecast, by Import Market Analysis (Value & Volume) 2020 & 2033
- Table 55: Global US Bio fungicides Industry Revenue Million Forecast, by Export Market Analysis (Value & Volume) 2020 & 2033
- Table 56: Global US Bio fungicides Industry Revenue Million Forecast, by Price Trend Analysis 2020 & 2033
- Table 57: Global US Bio fungicides Industry Revenue Million Forecast, by Country 2020 & 2033
- Table 58: China US Bio fungicides Industry Revenue (Million) Forecast, by Application 2020 & 2033
- Table 59: India US Bio fungicides Industry Revenue (Million) Forecast, by Application 2020 & 2033
- Table 60: Japan US Bio fungicides Industry Revenue (Million) Forecast, by Application 2020 & 2033
- Table 61: South Korea US Bio fungicides Industry Revenue (Million) Forecast, by Application 2020 & 2033
- Table 62: ASEAN US Bio fungicides Industry Revenue (Million) Forecast, by Application 2020 & 2033
- Table 63: Oceania US Bio fungicides Industry Revenue (Million) Forecast, by Application 2020 & 2033
- Table 64: Rest of Asia Pacific US Bio fungicides Industry Revenue (Million) Forecast, by Application 2020 & 2033
Frequently Asked Questions
1. What is the projected Compound Annual Growth Rate (CAGR) of the US Bio fungicides Industry?
The projected CAGR is approximately 9.50%.
2. Which companies are prominent players in the US Bio fungicides Industry?
Key companies in the market include BioWorks Inc, Novozyme Biologicals, Isagro USA, Marrone Bio Innovations, Valent BioSciences LLC, Syngenta AG, De Sangosse Lt, Certis USA LLC.
3. What are the main segments of the US Bio fungicides Industry?
The market segments include Production Analysis, Consumption Analysis, Import Market Analysis (Value & Volume), Export Market Analysis (Value & Volume), Price Trend Analysis.
4. Can you provide details about the market size?
The market size is estimated to be USD 0.96 Million as of 2022.
5. What are some drivers contributing to market growth?
Adoption of Organic and Eco-friendly Farming Practices; Declining Area of Arable Land and Rising Food Security Concerns.
6. What are the notable trends driving market growth?
Fruits and Vegetables Fastest Market Growing Segment.
7. Are there any restraints impacting market growth?
High Demand for Conventional and Synthetic Products; Lack of Awareness and Other Factors Limiting the Adoption of Agricultural Inoculants.
8. Can you provide examples of recent developments in the market?
N/A
9. What pricing options are available for accessing the report?
Pricing options include single-user, multi-user, and enterprise licenses priced at USD 3800, USD 4500, and USD 5800 respectively.
10. Is the market size provided in terms of value or volume?
The market size is provided in terms of value, measured in Million.
11. Are there any specific market keywords associated with the report?
Yes, the market keyword associated with the report is "US Bio fungicides Industry," which aids in identifying and referencing the specific market segment covered.
12. How do I determine which pricing option suits my needs best?
The pricing options vary based on user requirements and access needs. Individual users may opt for single-user licenses, while businesses requiring broader access may choose multi-user or enterprise licenses for cost-effective access to the report.
13. Are there any additional resources or data provided in the US Bio fungicides Industry report?
While the report offers comprehensive insights, it's advisable to review the specific contents or supplementary materials provided to ascertain if additional resources or data are available.
14. How can I stay updated on further developments or reports in the US Bio fungicides Industry?
To stay informed about further developments, trends, and reports in the US Bio fungicides Industry, consider subscribing to industry newsletters, following relevant companies and organizations, or regularly checking reputable industry news sources and publications.
Methodology
Step 1 - Identification of Relevant Samples Size from Population Database


Step 2 - Approaches for Defining Global Market Size (Value, Volume* & Price*)

Note*: In applicable scenarios
Step 3 - Data Sources
Primary Research
- Web Analytics
- Survey Reports
- Research Institute
- Latest Research Reports
- Opinion Leaders
Secondary Research
- Annual Reports
- White Paper
- Latest Press Release
- Industry Association
- Paid Database
- Investor Presentations

Step 4 - Data Triangulation
Involves using different sources of information in order to increase the validity of a study
These sources are likely to be stakeholders in a program - participants, other researchers, program staff, other community members, and so on.
Then we put all data in single framework & apply various statistical tools to find out the dynamic on the market.
During the analysis stage, feedback from the stakeholder groups would be compared to determine areas of agreement as well as areas of divergence