

Key Insights
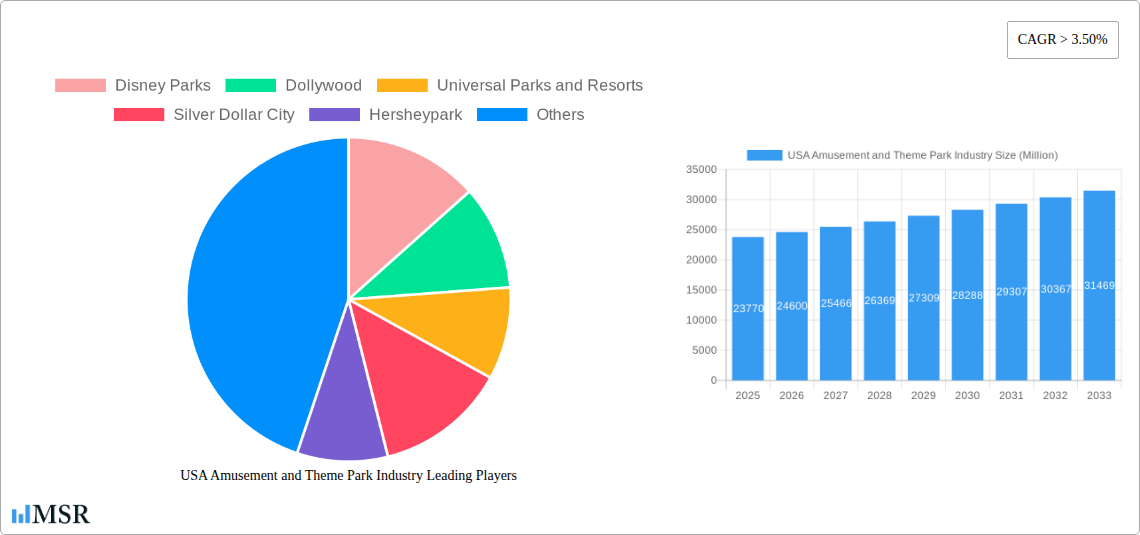
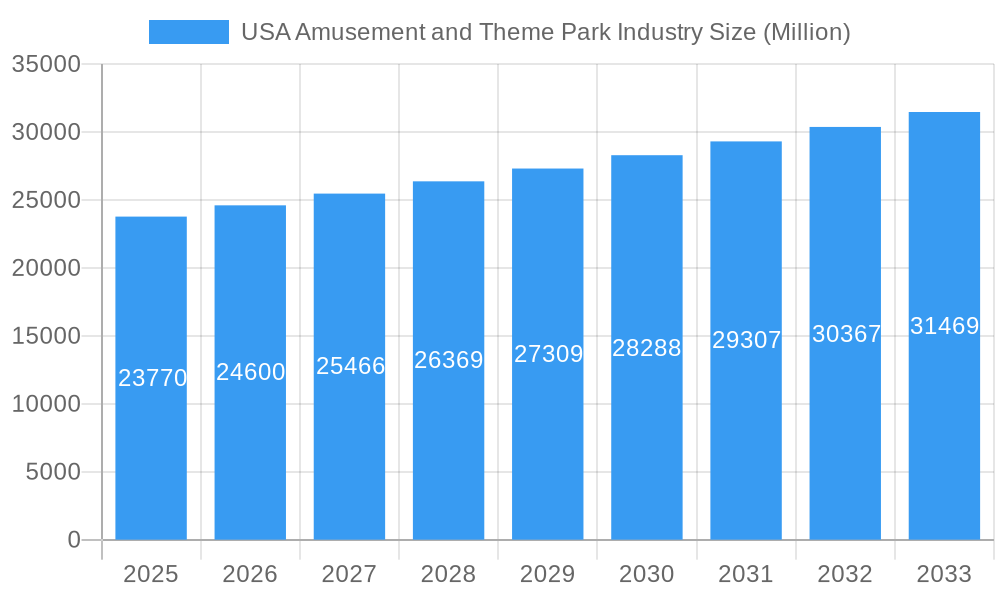
The US amusement and theme park industry, valued at $23.77 billion in 2025, is projected to experience robust growth, with a compound annual growth rate (CAGR) exceeding 3.5% from 2025 to 2033. This expansion is fueled by several key drivers. Increased disposable incomes, particularly amongst millennial and Gen Z demographics, coupled with a growing preference for experiential entertainment, are significantly boosting attendance. Furthermore, continuous innovation in ride technology, immersive storytelling, and themed experiences enhances visitor engagement and loyalty. The industry's segmentation, encompassing various ride types (land, water, and others), and revenue streams (tickets, food & beverage, merchandise, and hospitality), offers significant diversification and revenue-generation opportunities. Major players like Disney Parks, Universal Parks & Resorts, and Six Flags are leveraging these opportunities through strategic investments in new attractions, park expansions, and enhanced guest services to maintain a competitive edge. However, external factors such as economic downturns and increased operational costs, including labor and security, pose potential restraints to market growth. Regional variations also exist, with established tourist hubs in the Northeast and Southeast likely experiencing higher growth rates compared to other regions.
USA Amusement and Theme Park Industry Market Size (In Billion)
The forecast period (2025-2033) suggests a continued upward trajectory for the industry, driven by sustained consumer demand and effective industry strategies. The increasing popularity of themed parks offering immersive and unique experiences will continue to draw visitors. The industry's success will hinge on adapting to evolving consumer preferences, technological advancements, and addressing potential challenges, such as maintaining sustainable practices and ensuring guest safety. Strategic partnerships, technological upgrades and effective marketing strategies focusing on diverse audience segments will be critical for sustained success within the increasingly competitive landscape.
USA Amusement and Theme Park Industry Company Market Share
USA Amusement & Theme Park Industry Report: 2019-2033
Dive into the exhilarating world of the USA amusement and theme park industry with our comprehensive market analysis, projecting a vibrant future through 2033. This report provides in-depth insights into market dynamics, key players, and emerging trends, offering invaluable strategic guidance for stakeholders. We analyze the industry's performance from 2019 to 2024 (Historical Period), establishing a robust base year of 2025 (Base Year) for our detailed forecast spanning 2025-2033 (Forecast Period), with a focus on the Estimated Year of 2025 and overall Study Period of 2019-2033. The report covers major players like Disney Parks, Universal Parks & Resorts, Six Flags Inc., Cedar Fair Entertainment Company, and many more, providing crucial data for informed decision-making. Expect detailed breakdowns by revenue source (tickets, food & beverage, merchandise, hospitality, others) and ride type (land rides, water rides, other types).
USA Amusement and Theme Park Industry Market Concentration & Dynamics
The USA amusement and theme park industry exhibits moderate concentration, with a few dominant players capturing significant market share. Disney Parks and Universal Parks & Resorts hold substantial leadership positions, followed by Six Flags Inc. and Cedar Fair Entertainment Company. Smaller regional players like Dollywood, Silver Dollar City, and Hersheypark cater to niche markets. Market share fluctuations are influenced by new attraction launches, operational efficiency, and marketing strategies. The innovative ecosystem thrives on technological advancements, such as virtual reality integration and enhanced guest experiences, pushing creative boundaries. Regulatory frameworks, concerning safety standards and environmental impact, exert significant influence. Substitute products, like other leisure activities and entertainment options, pose competitive pressures. The sector witnesses consistent end-user trends of preference for immersive and unique experiences, leading to an active mergers and acquisitions (M&A) landscape. Between 2019 and 2024, an estimated xx M&A deals occurred, primarily driven by expansion strategies and diversification.
- Market Concentration: High concentration at the top, with xx% controlled by the top 5 players in 2024.
- M&A Activity: xx deals between 2019 and 2024, anticipating xx deals by 2033.
- Innovation: Emphasis on VR/AR technologies, personalized experiences, and sustainable practices.
- Regulatory Landscape: Stringent safety and environmental regulations influence operational costs and expansion strategies.
USA Amusement and Theme Park Industry Industry Insights & Trends
The USA amusement and theme park industry demonstrates robust growth, with the market size estimated at $xx Million in 2025, exhibiting a CAGR of xx% from 2025 to 2033. Key growth drivers include rising disposable incomes, increasing tourism, and the continuous innovation in attractions and technologies. The sector has witnessed a shift in consumer preferences, focusing on immersive experiences, themed environments, and personalized interactions, impacting marketing strategies and operational models. Technological disruptions, including mobile ticketing, personalized offers, and AI-powered guest services, are transforming customer engagement. The industry also confronts challenges like seasonality, competition from other leisure options, and increasing operating costs. Despite these headwinds, the long-term outlook remains positive, driven by the desire for memorable experiences and continuous industry innovation. The market is expected to reach $xx Million by 2033.
Key Markets & Segments Leading USA Amusement and Theme Park Industry
The industry's dominance is spread across multiple regions, with Florida and California as key markets. The "Tickets" segment contributes the largest portion of revenue (xx%), followed by "Food & Beverages" (xx%) and "Merchandise" (xx%). Growth is fueled by multiple factors:
Drivers for Growth:
- Economic Growth: Rising disposable income boosts spending on leisure and entertainment.
- Tourism: Increased domestic and international tourism fuels demand.
- Infrastructure Development: Improved transportation and accessibility enhance visitor convenience.
- Technological Advancements: Innovative technologies create exciting and memorable experiences.
Dominant Segments:
- By Type: Land rides consistently dominate, while water rides and other attractions contribute significantly. The balance is expected to shift slightly toward more immersive, technology-driven experiences by 2033.
- By Revenue: Tickets remain the primary revenue stream; however, growth in food and beverage, and merchandise sales indicates successful diversification.
USA Amusement and Theme Park Industry Product Developments
The USA amusement and theme park industry is currently experiencing a surge in product development, with a pronounced emphasis on crafting deeply immersive and interactive experiences that transcend traditional entertainment. A significant trend is the seamless integration of cutting-edge technologies such as virtual reality (VR) and augmented reality (AR) directly into rides and attractions. This allows for dynamic storytelling, personalized adventures, and the creation of fantastical worlds that blur the lines between the physical and digital. Furthermore, the industry is increasingly focusing on delivering personalized guest journeys, tailoring attractions, shows, and even dining options to individual preferences and demographic profiles. This is often facilitated by the development of sophisticated and innovative ticketing systems, coupled with robust mobile applications that not only streamline access and reduce wait times but also serve as powerful tools for enhancing customer convenience, fostering loyalty through gamified elements and exclusive offers, and gathering valuable data for future service improvements. These technological advancements are not merely incremental upgrades; they are fundamentally redefining the guest experience, providing a critical competitive edge by offering unique, memorable, and highly engaging experiences that are essential for attracting and retaining a discerning customer base in a dynamic market.
Challenges in the USA Amusement and Theme Park Industry Market
The USA amusement and theme park industry navigates a complex landscape fraught with significant challenges. Chief among these is intense competition, not only from other parks but also from a myriad of other leisure and entertainment options. The inherent seasonality of the business, often dictated by weather and school calendars, creates periods of high demand and significant lulls, impacting revenue streams. Fluctuating attendance, heavily influenced by broader economic conditions and consumer discretionary spending, adds another layer of unpredictability. Furthermore, the industry grapples with continuously rising operating costs, encompassing labor, the escalating expense of insurance premiums, and the ongoing need for rigorous maintenance and capital expenditures on attractions. Supply chain disruptions can also present hurdles, impacting the timely procurement of parts for essential maintenance and the implementation of planned attraction upgrades. Beyond operational concerns, navigating stringent regulatory compliance and upholding the highest safety standards remain paramount and require constant vigilance and investment. Collectively, these factors exert considerable pressure on profitability and underscore the absolute necessity for continuous innovation, strategic adaptation, and efficient operational management to thrive.
Forces Driving USA Amusement and Theme Park Industry Growth
The robust growth of the USA amusement and theme park industry is propelled by a confluence of powerful driving forces. Foremost among these are the relentless march of technological advancements, which are continuously enriching the visitor experience and creating new forms of entertainment. Coupled with this is the sustained growth in domestic and international tourism, with theme parks remaining a significant draw for vacationers. A stable and growing economy, characterized by rising disposable incomes, directly translates into increased consumer spending on leisure and entertainment activities, including theme park visits. The integration of innovative technologies like VR and AR, as mentioned, is a key catalyst, creating more engaging and memorable experiences that drive higher attendance. As disposable incomes increase, consumers are more willing to allocate a larger portion of their budget towards these premium leisure activities. Additionally, government initiatives promoting tourism at both federal and state levels provide a supportive environment for industry expansion. The efficacy of targeted marketing campaigns and the establishment of strategic partnerships with related industries and influencers also play a crucial role in expanding the industry's reach and fostering resilience.
Long-Term Growth Catalysts in the USA Amusement and Theme Park Industry
Long-term growth is fueled by continuous innovation in attractions and technologies, strategic partnerships with hotels and resorts, and expansion into new markets both domestically and internationally. The industry's focus on enhancing guest experiences, personalization, and sustainability creates a positive outlook for continued development and expansion in the coming years.
Emerging Opportunities in USA Amusement and Theme Park Industry
Emerging opportunities include the integration of cutting-edge technologies, such as AI-powered personalized experiences, immersive storytelling, and sustainable park designs. Expansion into new geographic markets and the development of unique niche themes catering to specialized demographics present significant growth potential. Leveraging data analytics to optimize operations and enhance customer engagement presents further opportunities.
Leading Players in the USA Amusement and Theme Park Industry Sector
- Disney Parks
- Dollywood
- Universal Parks & Resorts
- Silver Dollar City
- Hersheypark
- Six Flags Inc.
- Busch Gardens
- The Island in Pigeon Forge
- Cedar Fair Entertainment Company
- Magic Kingdom Park
- Dells Waterpark
- Seaworld Parks & Entertainment
Key Milestones in USA Amusement and Theme Park Industry Industry
- September 2023: Crescent Real Estate LLC's strategic acquisition of the Element Orlando Universal Blvd. hotel significantly expands accommodation options in close proximity to popular attractions like Icon Park. This move is poised to boost tourism influx, enhance the overall visitor experience by offering convenient lodging, and consequently contribute to increased industry revenue and economic activity in the region.
- July 2023: The acquisition of Arrow International Media, a renowned producer of content for attractions like Disney's Animal Kingdom, by Asacha Media Group signifies a notable increase in foreign investment within the entertainment and attractions sector. This development suggests a global appetite for intellectual property and production expertise, potentially leading to enhanced content creation, expanded revenue streams through new media formats, and further international collaborations within the USA amusement and theme park industry.
Strategic Outlook for USA Amusement and Theme Park Industry Market
The future of the USA amusement and theme park industry is exceptionally promising. Continued technological advancements, coupled with a focus on creating unique and immersive experiences, will drive significant growth. Strategic partnerships, expansion into new markets, and sustainable practices will further enhance the industry's long-term potential. The market is poised for significant expansion, offering lucrative opportunities for investors and stakeholders alike.
USA Amusement and Theme Park Industry Segmentation
-
1. Type
- 1.1. Land Rides
- 1.2. Water Rides
- 1.3. Other Types
-
2. Source of Revenue
- 2.1. Tickets
- 2.2. Foods & Beverages
- 2.3. Merchandise
- 2.4. Hospitality
- 2.5. Other Source of Revenues
USA Amusement and Theme Park Industry Segmentation By Geography
-
1. North America
- 1.1. United States
- 1.2. Canada
- 1.3. Mexico
-
2. South America
- 2.1. Brazil
- 2.2. Argentina
- 2.3. Rest of South America
-
3. Europe
- 3.1. United Kingdom
- 3.2. Germany
- 3.3. France
- 3.4. Italy
- 3.5. Spain
- 3.6. Russia
- 3.7. Benelux
- 3.8. Nordics
- 3.9. Rest of Europe
-
4. Middle East & Africa
- 4.1. Turkey
- 4.2. Israel
- 4.3. GCC
- 4.4. North Africa
- 4.5. South Africa
- 4.6. Rest of Middle East & Africa
-
5. Asia Pacific
- 5.1. China
- 5.2. India
- 5.3. Japan
- 5.4. South Korea
- 5.5. ASEAN
- 5.6. Oceania
- 5.7. Rest of Asia Pacific
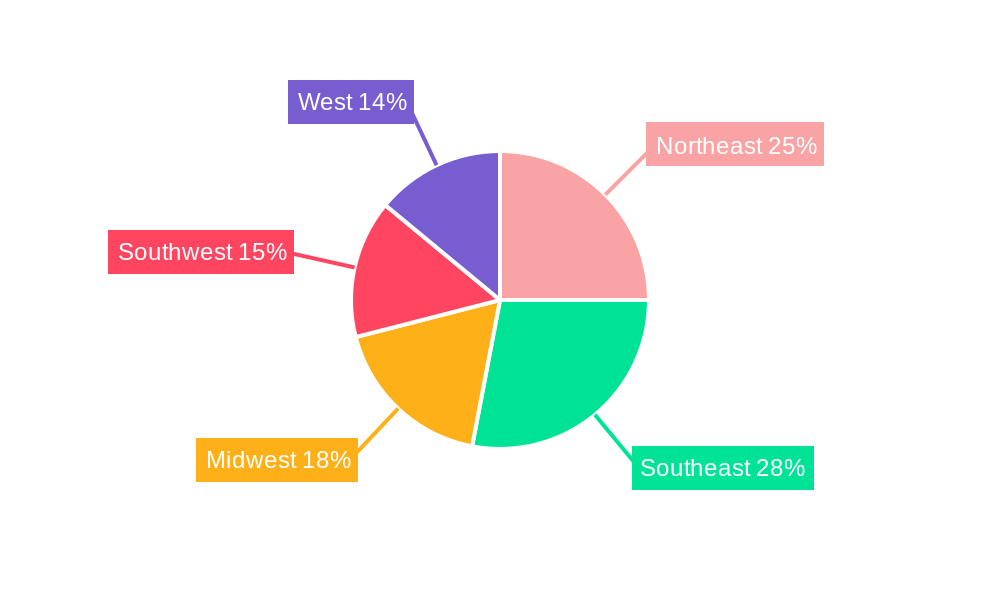
USA Amusement and Theme Park Industry Regional Market Share
Geographic Coverage of USA Amusement and Theme Park Industry
USA Amusement and Theme Park Industry REPORT HIGHLIGHTS
| Aspects | Details |
|---|---|
| Study Period | 2020-2034 |
| Base Year | 2025 |
| Estimated Year | 2026 |
| Forecast Period | 2026-2034 |
| Historical Period | 2020-2025 |
| Growth Rate | CAGR of > 3.50% from 2020-2034 |
| Segmentation |
|
Table of Contents
- 1. Introduction
- 1.1. Research Scope
- 1.2. Market Segmentation
- 1.3. Research Objective
- 1.4. Definitions and Assumptions
- 2. Executive Summary
- 2.1. Market Snapshot
- 3. Market Dynamics
- 3.1. Market Drivers
- 3.2. Market Restrains
- 3.3. Market Trends
- 3.4. Market Opportunities
- 4. Market Factor Analysis
- 4.1. Porters Five Forces
- 4.1.1. Bargaining Power of Suppliers
- 4.1.2. Bargaining Power of Buyers
- 4.1.3. Threat of New Entrants
- 4.1.4. Threat of Substitutes
- 4.1.5. Competitive Rivalry
- 4.2. PESTEL analysis
- 4.3. BCG Analysis
- 4.3.1. Stars (High Growth, High Market Share)
- 4.3.2. Cash Cows (Low Growth, High Market Share)
- 4.3.3. Question Mark (High Growth, Low Market Share)
- 4.3.4. Dogs (Low Growth, Low Market Share)
- 4.4. Ansoff Matrix Analysis
- 4.5. Supply Chain Analysis
- 4.6. Regulatory Landscape
- 4.7. Current Market Potential and Opportunity Assessment (TAM–SAM–SOM Framework)
- 4.8. MSR Analyst Note
- 4.1. Porters Five Forces
- 5. Market Analysis, Insights and Forecast 2021-2033
- 5.1. Market Analysis, Insights and Forecast - by Type
- 5.1.1. Land Rides
- 5.1.2. Water Rides
- 5.1.3. Other Types
- 5.2. Market Analysis, Insights and Forecast - by Source of Revenue
- 5.2.1. Tickets
- 5.2.2. Foods & Beverages
- 5.2.3. Merchandise
- 5.2.4. Hospitality
- 5.2.5. Other Source of Revenues
- 5.3. Market Analysis, Insights and Forecast - by Region
- 5.3.1. North America
- 5.3.2. South America
- 5.3.3. Europe
- 5.3.4. Middle East & Africa
- 5.3.5. Asia Pacific
- 5.1. Market Analysis, Insights and Forecast - by Type
- 6. Global USA Amusement and Theme Park Industry Analysis, Insights and Forecast, 2021-2033
- 6.1. Market Analysis, Insights and Forecast - by Type
- 6.1.1. Land Rides
- 6.1.2. Water Rides
- 6.1.3. Other Types
- 6.2. Market Analysis, Insights and Forecast - by Source of Revenue
- 6.2.1. Tickets
- 6.2.2. Foods & Beverages
- 6.2.3. Merchandise
- 6.2.4. Hospitality
- 6.2.5. Other Source of Revenues
- 6.1. Market Analysis, Insights and Forecast - by Type
- 7. North America USA Amusement and Theme Park Industry Analysis, Insights and Forecast, 2020-2032
- 7.1. Market Analysis, Insights and Forecast - by Type
- 7.1.1. Land Rides
- 7.1.2. Water Rides
- 7.1.3. Other Types
- 7.2. Market Analysis, Insights and Forecast - by Source of Revenue
- 7.2.1. Tickets
- 7.2.2. Foods & Beverages
- 7.2.3. Merchandise
- 7.2.4. Hospitality
- 7.2.5. Other Source of Revenues
- 7.1. Market Analysis, Insights and Forecast - by Type
- 8. South America USA Amusement and Theme Park Industry Analysis, Insights and Forecast, 2020-2032
- 8.1. Market Analysis, Insights and Forecast - by Type
- 8.1.1. Land Rides
- 8.1.2. Water Rides
- 8.1.3. Other Types
- 8.2. Market Analysis, Insights and Forecast - by Source of Revenue
- 8.2.1. Tickets
- 8.2.2. Foods & Beverages
- 8.2.3. Merchandise
- 8.2.4. Hospitality
- 8.2.5. Other Source of Revenues
- 8.1. Market Analysis, Insights and Forecast - by Type
- 9. Europe USA Amusement and Theme Park Industry Analysis, Insights and Forecast, 2020-2032
- 9.1. Market Analysis, Insights and Forecast - by Type
- 9.1.1. Land Rides
- 9.1.2. Water Rides
- 9.1.3. Other Types
- 9.2. Market Analysis, Insights and Forecast - by Source of Revenue
- 9.2.1. Tickets
- 9.2.2. Foods & Beverages
- 9.2.3. Merchandise
- 9.2.4. Hospitality
- 9.2.5. Other Source of Revenues
- 9.1. Market Analysis, Insights and Forecast - by Type
- 10. Middle East & Africa USA Amusement and Theme Park Industry Analysis, Insights and Forecast, 2020-2032
- 10.1. Market Analysis, Insights and Forecast - by Type
- 10.1.1. Land Rides
- 10.1.2. Water Rides
- 10.1.3. Other Types
- 10.2. Market Analysis, Insights and Forecast - by Source of Revenue
- 10.2.1. Tickets
- 10.2.2. Foods & Beverages
- 10.2.3. Merchandise
- 10.2.4. Hospitality
- 10.2.5. Other Source of Revenues
- 10.1. Market Analysis, Insights and Forecast - by Type
- 11. Asia Pacific USA Amusement and Theme Park Industry Analysis, Insights and Forecast, 2020-2032
- 11.1. Market Analysis, Insights and Forecast - by Type
- 11.1.1. Land Rides
- 11.1.2. Water Rides
- 11.1.3. Other Types
- 11.2. Market Analysis, Insights and Forecast - by Source of Revenue
- 11.2.1. Tickets
- 11.2.2. Foods & Beverages
- 11.2.3. Merchandise
- 11.2.4. Hospitality
- 11.2.5. Other Source of Revenues
- 11.1. Market Analysis, Insights and Forecast - by Type
- 12. Competitive Analysis
- 12.1. Company Profiles
- 12.1.1 Disney Parks
- 12.1.1.1. Company Overview
- 12.1.1.2. Products
- 12.1.1.3. Company Financials
- 12.1.1.4. SWOT Analysis
- 12.1.2 Dollywood
- 12.1.2.1. Company Overview
- 12.1.2.2. Products
- 12.1.2.3. Company Financials
- 12.1.2.4. SWOT Analysis
- 12.1.3 Universal Parks and Resorts
- 12.1.3.1. Company Overview
- 12.1.3.2. Products
- 12.1.3.3. Company Financials
- 12.1.3.4. SWOT Analysis
- 12.1.4 Silver Dollar City
- 12.1.4.1. Company Overview
- 12.1.4.2. Products
- 12.1.4.3. Company Financials
- 12.1.4.4. SWOT Analysis
- 12.1.5 Hersheypark
- 12.1.5.1. Company Overview
- 12.1.5.2. Products
- 12.1.5.3. Company Financials
- 12.1.5.4. SWOT Analysis
- 12.1.6 Six Flags Inc
- 12.1.6.1. Company Overview
- 12.1.6.2. Products
- 12.1.6.3. Company Financials
- 12.1.6.4. SWOT Analysis
- 12.1.7 Busch Garden
- 12.1.7.1. Company Overview
- 12.1.7.2. Products
- 12.1.7.3. Company Financials
- 12.1.7.4. SWOT Analysis
- 12.1.8 The Island in Pigeon Forge
- 12.1.8.1. Company Overview
- 12.1.8.2. Products
- 12.1.8.3. Company Financials
- 12.1.8.4. SWOT Analysis
- 12.1.9 Cedar Fair Entertainment Company
- 12.1.9.1. Company Overview
- 12.1.9.2. Products
- 12.1.9.3. Company Financials
- 12.1.9.4. SWOT Analysis
- 12.1.10 Magic Kingdom Park
- 12.1.10.1. Company Overview
- 12.1.10.2. Products
- 12.1.10.3. Company Financials
- 12.1.10.4. SWOT Analysis
- 12.1.11 Dells Waterpark**List Not Exhaustive
- 12.1.11.1. Company Overview
- 12.1.11.2. Products
- 12.1.11.3. Company Financials
- 12.1.11.4. SWOT Analysis
- 12.1.12 Seaworld Parks and Entertainment
- 12.1.12.1. Company Overview
- 12.1.12.2. Products
- 12.1.12.3. Company Financials
- 12.1.12.4. SWOT Analysis
- 12.1.1 Disney Parks
- 12.2. Market Entropy
- 12.2.1 Company's Key Areas Served
- 12.2.2 Recent Developments
- 12.3. Company Market Share Analysis 2025
- 12.3.1 Top 5 Companies Market Share Analysis
- 12.3.2 Top 3 Companies Market Share Analysis
- 12.4. List of Potential Customers
- 13. Research Methodology
List of Figures
- Figure 1: Global USA Amusement and Theme Park Industry Revenue Breakdown (Million, %) by Region 2025 & 2033
- Figure 2: North America USA Amusement and Theme Park Industry Revenue (Million), by Type 2025 & 2033
- Figure 3: North America USA Amusement and Theme Park Industry Revenue Share (%), by Type 2025 & 2033
- Figure 4: North America USA Amusement and Theme Park Industry Revenue (Million), by Source of Revenue 2025 & 2033
- Figure 5: North America USA Amusement and Theme Park Industry Revenue Share (%), by Source of Revenue 2025 & 2033
- Figure 6: North America USA Amusement and Theme Park Industry Revenue (Million), by Country 2025 & 2033
- Figure 7: North America USA Amusement and Theme Park Industry Revenue Share (%), by Country 2025 & 2033
- Figure 8: South America USA Amusement and Theme Park Industry Revenue (Million), by Type 2025 & 2033
- Figure 9: South America USA Amusement and Theme Park Industry Revenue Share (%), by Type 2025 & 2033
- Figure 10: South America USA Amusement and Theme Park Industry Revenue (Million), by Source of Revenue 2025 & 2033
- Figure 11: South America USA Amusement and Theme Park Industry Revenue Share (%), by Source of Revenue 2025 & 2033
- Figure 12: South America USA Amusement and Theme Park Industry Revenue (Million), by Country 2025 & 2033
- Figure 13: South America USA Amusement and Theme Park Industry Revenue Share (%), by Country 2025 & 2033
- Figure 14: Europe USA Amusement and Theme Park Industry Revenue (Million), by Type 2025 & 2033
- Figure 15: Europe USA Amusement and Theme Park Industry Revenue Share (%), by Type 2025 & 2033
- Figure 16: Europe USA Amusement and Theme Park Industry Revenue (Million), by Source of Revenue 2025 & 2033
- Figure 17: Europe USA Amusement and Theme Park Industry Revenue Share (%), by Source of Revenue 2025 & 2033
- Figure 18: Europe USA Amusement and Theme Park Industry Revenue (Million), by Country 2025 & 2033
- Figure 19: Europe USA Amusement and Theme Park Industry Revenue Share (%), by Country 2025 & 2033
- Figure 20: Middle East & Africa USA Amusement and Theme Park Industry Revenue (Million), by Type 2025 & 2033
- Figure 21: Middle East & Africa USA Amusement and Theme Park Industry Revenue Share (%), by Type 2025 & 2033
- Figure 22: Middle East & Africa USA Amusement and Theme Park Industry Revenue (Million), by Source of Revenue 2025 & 2033
- Figure 23: Middle East & Africa USA Amusement and Theme Park Industry Revenue Share (%), by Source of Revenue 2025 & 2033
- Figure 24: Middle East & Africa USA Amusement and Theme Park Industry Revenue (Million), by Country 2025 & 2033
- Figure 25: Middle East & Africa USA Amusement and Theme Park Industry Revenue Share (%), by Country 2025 & 2033
- Figure 26: Asia Pacific USA Amusement and Theme Park Industry Revenue (Million), by Type 2025 & 2033
- Figure 27: Asia Pacific USA Amusement and Theme Park Industry Revenue Share (%), by Type 2025 & 2033
- Figure 28: Asia Pacific USA Amusement and Theme Park Industry Revenue (Million), by Source of Revenue 2025 & 2033
- Figure 29: Asia Pacific USA Amusement and Theme Park Industry Revenue Share (%), by Source of Revenue 2025 & 2033
- Figure 30: Asia Pacific USA Amusement and Theme Park Industry Revenue (Million), by Country 2025 & 2033
- Figure 31: Asia Pacific USA Amusement and Theme Park Industry Revenue Share (%), by Country 2025 & 2033
List of Tables
- Table 1: Global USA Amusement and Theme Park Industry Revenue Million Forecast, by Type 2020 & 2033
- Table 2: Global USA Amusement and Theme Park Industry Revenue Million Forecast, by Source of Revenue 2020 & 2033
- Table 3: Global USA Amusement and Theme Park Industry Revenue Million Forecast, by Region 2020 & 2033
- Table 4: Global USA Amusement and Theme Park Industry Revenue Million Forecast, by Type 2020 & 2033
- Table 5: Global USA Amusement and Theme Park Industry Revenue Million Forecast, by Source of Revenue 2020 & 2033
- Table 6: Global USA Amusement and Theme Park Industry Revenue Million Forecast, by Country 2020 & 2033
- Table 7: United States USA Amusement and Theme Park Industry Revenue (Million) Forecast, by Application 2020 & 2033
- Table 8: Canada USA Amusement and Theme Park Industry Revenue (Million) Forecast, by Application 2020 & 2033
- Table 9: Mexico USA Amusement and Theme Park Industry Revenue (Million) Forecast, by Application 2020 & 2033
- Table 10: Global USA Amusement and Theme Park Industry Revenue Million Forecast, by Type 2020 & 2033
- Table 11: Global USA Amusement and Theme Park Industry Revenue Million Forecast, by Source of Revenue 2020 & 2033
- Table 12: Global USA Amusement and Theme Park Industry Revenue Million Forecast, by Country 2020 & 2033
- Table 13: Brazil USA Amusement and Theme Park Industry Revenue (Million) Forecast, by Application 2020 & 2033
- Table 14: Argentina USA Amusement and Theme Park Industry Revenue (Million) Forecast, by Application 2020 & 2033
- Table 15: Rest of South America USA Amusement and Theme Park Industry Revenue (Million) Forecast, by Application 2020 & 2033
- Table 16: Global USA Amusement and Theme Park Industry Revenue Million Forecast, by Type 2020 & 2033
- Table 17: Global USA Amusement and Theme Park Industry Revenue Million Forecast, by Source of Revenue 2020 & 2033
- Table 18: Global USA Amusement and Theme Park Industry Revenue Million Forecast, by Country 2020 & 2033
- Table 19: United Kingdom USA Amusement and Theme Park Industry Revenue (Million) Forecast, by Application 2020 & 2033
- Table 20: Germany USA Amusement and Theme Park Industry Revenue (Million) Forecast, by Application 2020 & 2033
- Table 21: France USA Amusement and Theme Park Industry Revenue (Million) Forecast, by Application 2020 & 2033
- Table 22: Italy USA Amusement and Theme Park Industry Revenue (Million) Forecast, by Application 2020 & 2033
- Table 23: Spain USA Amusement and Theme Park Industry Revenue (Million) Forecast, by Application 2020 & 2033
- Table 24: Russia USA Amusement and Theme Park Industry Revenue (Million) Forecast, by Application 2020 & 2033
- Table 25: Benelux USA Amusement and Theme Park Industry Revenue (Million) Forecast, by Application 2020 & 2033
- Table 26: Nordics USA Amusement and Theme Park Industry Revenue (Million) Forecast, by Application 2020 & 2033
- Table 27: Rest of Europe USA Amusement and Theme Park Industry Revenue (Million) Forecast, by Application 2020 & 2033
- Table 28: Global USA Amusement and Theme Park Industry Revenue Million Forecast, by Type 2020 & 2033
- Table 29: Global USA Amusement and Theme Park Industry Revenue Million Forecast, by Source of Revenue 2020 & 2033
- Table 30: Global USA Amusement and Theme Park Industry Revenue Million Forecast, by Country 2020 & 2033
- Table 31: Turkey USA Amusement and Theme Park Industry Revenue (Million) Forecast, by Application 2020 & 2033
- Table 32: Israel USA Amusement and Theme Park Industry Revenue (Million) Forecast, by Application 2020 & 2033
- Table 33: GCC USA Amusement and Theme Park Industry Revenue (Million) Forecast, by Application 2020 & 2033
- Table 34: North Africa USA Amusement and Theme Park Industry Revenue (Million) Forecast, by Application 2020 & 2033
- Table 35: South Africa USA Amusement and Theme Park Industry Revenue (Million) Forecast, by Application 2020 & 2033
- Table 36: Rest of Middle East & Africa USA Amusement and Theme Park Industry Revenue (Million) Forecast, by Application 2020 & 2033
- Table 37: Global USA Amusement and Theme Park Industry Revenue Million Forecast, by Type 2020 & 2033
- Table 38: Global USA Amusement and Theme Park Industry Revenue Million Forecast, by Source of Revenue 2020 & 2033
- Table 39: Global USA Amusement and Theme Park Industry Revenue Million Forecast, by Country 2020 & 2033
- Table 40: China USA Amusement and Theme Park Industry Revenue (Million) Forecast, by Application 2020 & 2033
- Table 41: India USA Amusement and Theme Park Industry Revenue (Million) Forecast, by Application 2020 & 2033
- Table 42: Japan USA Amusement and Theme Park Industry Revenue (Million) Forecast, by Application 2020 & 2033
- Table 43: South Korea USA Amusement and Theme Park Industry Revenue (Million) Forecast, by Application 2020 & 2033
- Table 44: ASEAN USA Amusement and Theme Park Industry Revenue (Million) Forecast, by Application 2020 & 2033
- Table 45: Oceania USA Amusement and Theme Park Industry Revenue (Million) Forecast, by Application 2020 & 2033
- Table 46: Rest of Asia Pacific USA Amusement and Theme Park Industry Revenue (Million) Forecast, by Application 2020 & 2033
Frequently Asked Questions
1. What is the projected Compound Annual Growth Rate (CAGR) of the USA Amusement and Theme Park Industry?
The projected CAGR is approximately > 3.50%.
2. Which companies are prominent players in the USA Amusement and Theme Park Industry?
Key companies in the market include Disney Parks, Dollywood, Universal Parks and Resorts, Silver Dollar City, Hersheypark, Six Flags Inc, Busch Garden, The Island in Pigeon Forge, Cedar Fair Entertainment Company, Magic Kingdom Park, Dells Waterpark**List Not Exhaustive, Seaworld Parks and Entertainment.
3. What are the main segments of the USA Amusement and Theme Park Industry?
The market segments include Type, Source of Revenue.
4. Can you provide details about the market size?
The market size is estimated to be USD 23.77 Million as of 2022.
5. What are some drivers contributing to market growth?
The number of baby-boomer tourists is expected to increase. which will fuel the growth of the worldwide amusement park market.; Incorporating energy-saving innovations like LED lighting and solar panels.
6. What are the notable trends driving market growth?
Increase in the number of visitors in amusement and theme parks.
7. Are there any restraints impacting market growth?
Theme parks are raising admission costs and letting guests ride every ride without waiting in queue; Theme parks utilising virtual reality are becoming more and more common..
8. Can you provide examples of recent developments in the market?
September 2023: Crescent Real Estate LLC acquired the Element Orlando Universal Blvd., a 165-key hotel operated under a franchise agreement with Marriott International. Located just outside the confines of the mixed-use development known as Icon Park, Element Orlando hotel guests have immediate access to 20 acres of entertainment opportunities.
9. What pricing options are available for accessing the report?
Pricing options include single-user, multi-user, and enterprise licenses priced at USD 3800, USD 4500, and USD 5800 respectively.
10. Is the market size provided in terms of value or volume?
The market size is provided in terms of value, measured in Million.
11. Are there any specific market keywords associated with the report?
Yes, the market keyword associated with the report is "USA Amusement and Theme Park Industry," which aids in identifying and referencing the specific market segment covered.
12. How do I determine which pricing option suits my needs best?
The pricing options vary based on user requirements and access needs. Individual users may opt for single-user licenses, while businesses requiring broader access may choose multi-user or enterprise licenses for cost-effective access to the report.
13. Are there any additional resources or data provided in the USA Amusement and Theme Park Industry report?
While the report offers comprehensive insights, it's advisable to review the specific contents or supplementary materials provided to ascertain if additional resources or data are available.
14. How can I stay updated on further developments or reports in the USA Amusement and Theme Park Industry?
To stay informed about further developments, trends, and reports in the USA Amusement and Theme Park Industry, consider subscribing to industry newsletters, following relevant companies and organizations, or regularly checking reputable industry news sources and publications.
Methodology
Step 1 - Identification of Relevant Samples Size from Population Database


Step 2 - Approaches for Defining Global Market Size (Value, Volume* & Price*)

Note*: In applicable scenarios
Step 3 - Data Sources
Primary Research
- Web Analytics
- Survey Reports
- Research Institute
- Latest Research Reports
- Opinion Leaders
Secondary Research
- Annual Reports
- White Paper
- Latest Press Release
- Industry Association
- Paid Database
- Investor Presentations

Step 4 - Data Triangulation
Involves using different sources of information in order to increase the validity of a study
These sources are likely to be stakeholders in a program - participants, other researchers, program staff, other community members, and so on.
Then we put all data in single framework & apply various statistical tools to find out the dynamic on the market.
During the analysis stage, feedback from the stakeholder groups would be compared to determine areas of agreement as well as areas of divergence