

Key Insights into the Wetland Management Market
The Global Wetland Management Market was valued at an estimated $5.8 billion in 2024, demonstrating its critical role in environmental stewardship and infrastructure resilience. Projections indicate a robust compound annual growth rate (CAGR) of 6.7% from 2024 to 2034, with the market anticipated to reach approximately $11.1 billion by 2034. This substantial expansion is primarily driven by escalating global awareness of climate change impacts, biodiversity loss, and the irreplaceable ecosystem services provided by wetlands. Regulatory mandates, such as the U.S. Clean Water Act and the European Water Framework Directive, increasingly necessitate wetland protection, restoration, and compensatory mitigation for development projects, thereby fueling demand across government, industrial, and commercial sectors. The imperative for climate change adaptation and mitigation strategies positions wetland management as a cornerstone for nature-based solutions. Wetlands are recognized for their intrinsic value in flood control, water quality enhancement, carbon sequestration, and habitat provision. The growing recognition of these benefits is translating into increased investment from public agencies, non-governmental organizations, and private entities seeking to enhance their environmental, social, and governance (ESG) profiles. Furthermore, advancements in remote sensing, hydrological modeling, and ecological engineering are enhancing the efficiency and effectiveness of wetland interventions, creating opportunities for specialized service providers. The integration of geospatial technologies is particularly driving the GIS Mapping Market, which is crucial for precise wetland delineation and monitoring. The nexus between wetland health and broader water resource management, coupled with the rising demand for sustainable infrastructure, underpins the positive forward-looking outlook for the Wetland Management Market. The ongoing global shift towards a more circular economy and the pursuit of the Sustainable Agriculture Market further underscore the market's trajectory, as wetlands play a vital role in water purification and nutrient cycling crucial for agricultural resilience. Despite challenges such as high upfront costs and land availability constraints, the overarching environmental imperative and technological innovation are expected to sustain the market's robust growth throughout the forecast period.
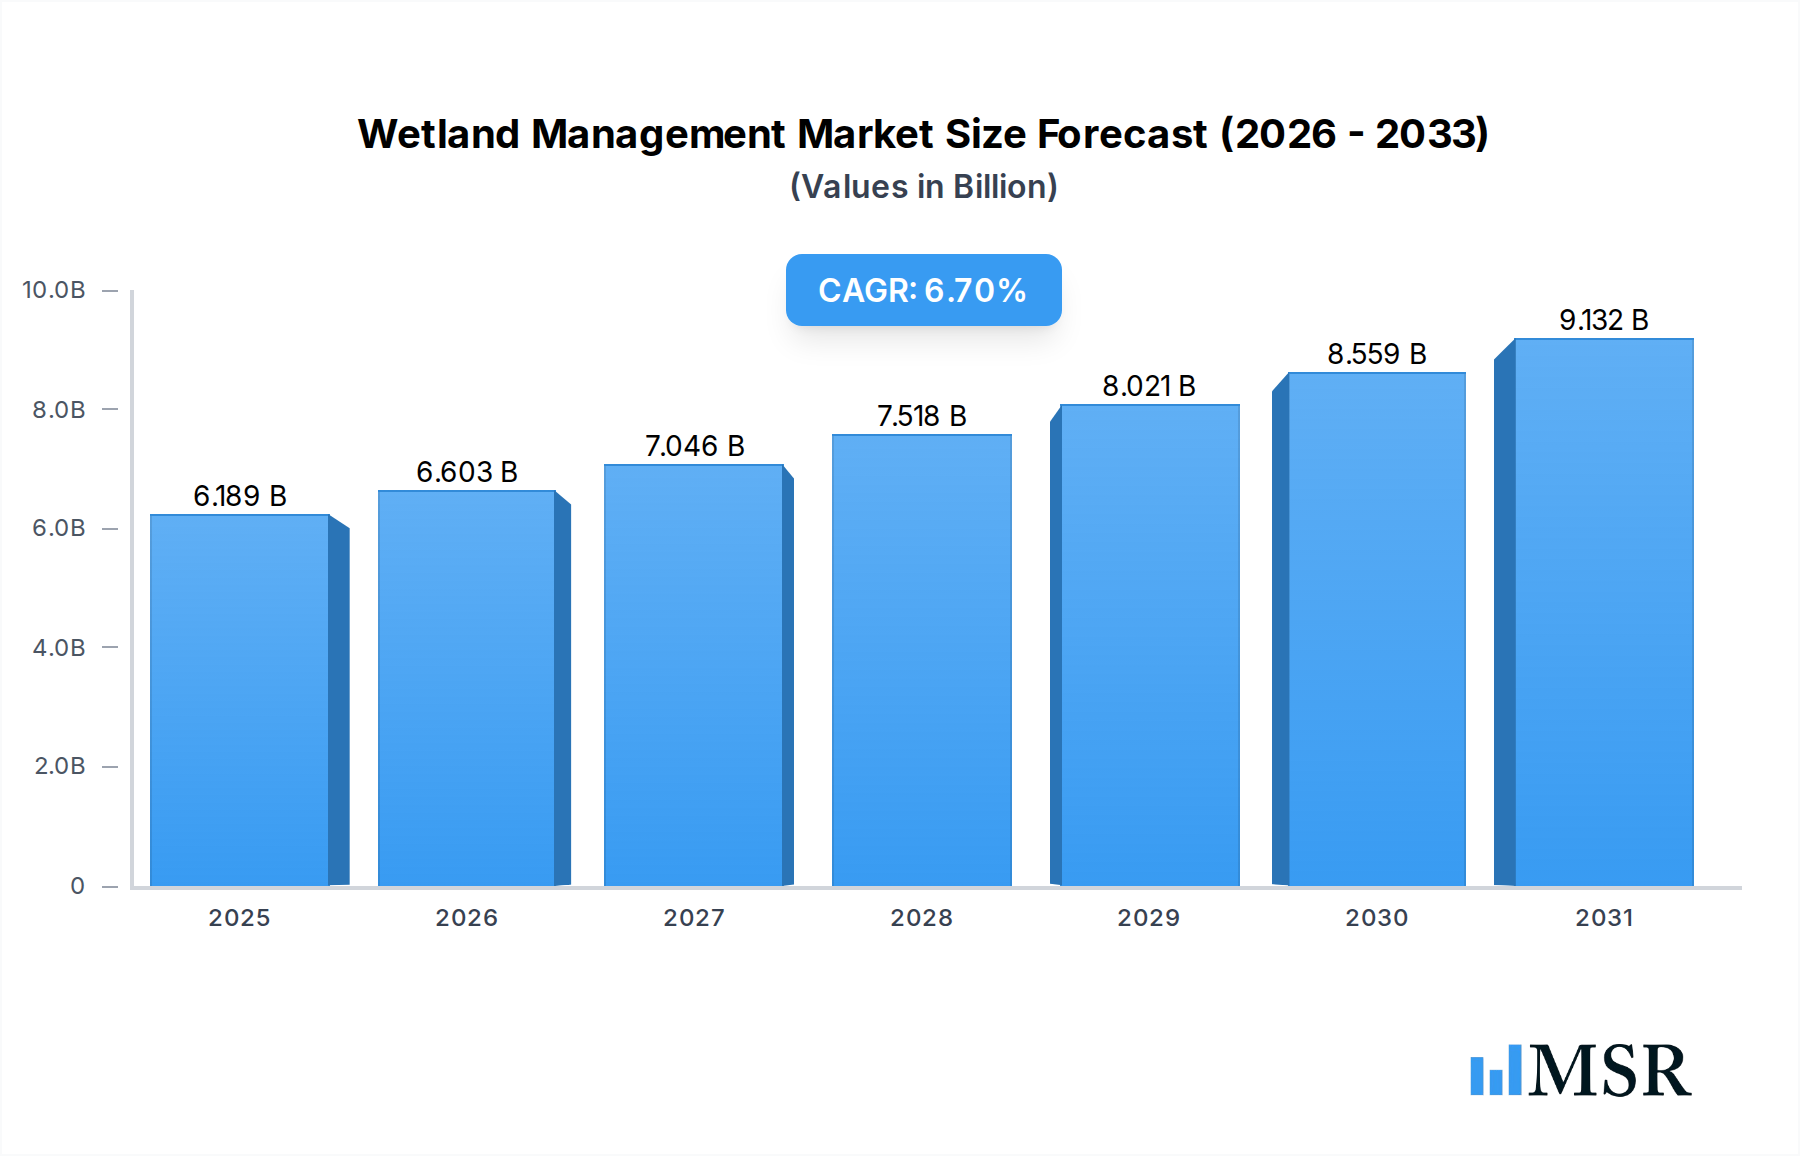
Wetland Management Market Size (In Billion)

Dominant Service Type Segment in Wetland Management Market
Within the comprehensive spectrum of the Global Wetland Management Market, the "Restoration & Rehabilitation" segment under Service Type emerges as the dominant force, commanding the largest revenue share. This segment's preeminence is attributable to the widespread degradation of natural wetlands globally due to anthropogenic pressures, including urbanization, agricultural expansion, industrial pollution, and infrastructure development. The intrinsic need to reverse these ecological losses and restore the vital ecosystem functions of wetlands drives substantial investment into restoration and rehabilitation initiatives. These services encompass a broad range of activities such as re-establishing natural hydrological regimes, re-vegetating with native plant species, managing invasive species, improving soil structure, and enhancing biodiversity corridors. The demand is amplified by the legal and regulatory requirement for compensatory mitigation, where unavoidable wetland impacts from development projects necessitate the restoration or creation of wetlands elsewhere. This regulatory framework creates a consistent and non-discretionary demand for expert services in the Ecological Restoration Market. Key players in this segment, including Wetland Studies and Solutions, Inc., Enviroscience, Inc., and Land Management Group, offer specialized expertise in ecological assessment, hydrological engineering, and long-term monitoring, which are critical for successful project outcomes. The segment's dominance is further reinforced by increasing public and private sector emphasis on nature-based solutions for climate change adaptation, such as using restored coastal wetlands for storm surge protection and inland wetlands for natural flood attenuation. Moreover, a significant portion of the Environmental Consulting Market is dedicated to supporting these restoration efforts, from initial site assessment and permitting to post-restoration monitoring and adaptive management. The demand for these intensive, site-specific interventions is often more substantial than pure conservation or general assessment services, which, while crucial, often involve lower capital expenditure or ongoing operational costs. As global environmental policies continue to tighten and the scientific understanding of wetland resilience grows, the Restoration & Rehabilitation segment is projected to maintain its leadership, underpinned by continuous innovation in ecological engineering techniques and the growing recognition of restored wetlands' socioeconomic benefits. Furthermore, the increasing integration of technologies from the Environmental Monitoring Market enables more precise measurement of restoration success, bolstering confidence and investment in these pivotal services. The ongoing need for complex hydrological engineering, sediment management, and biological reintroduction further cements this segment's leading position.
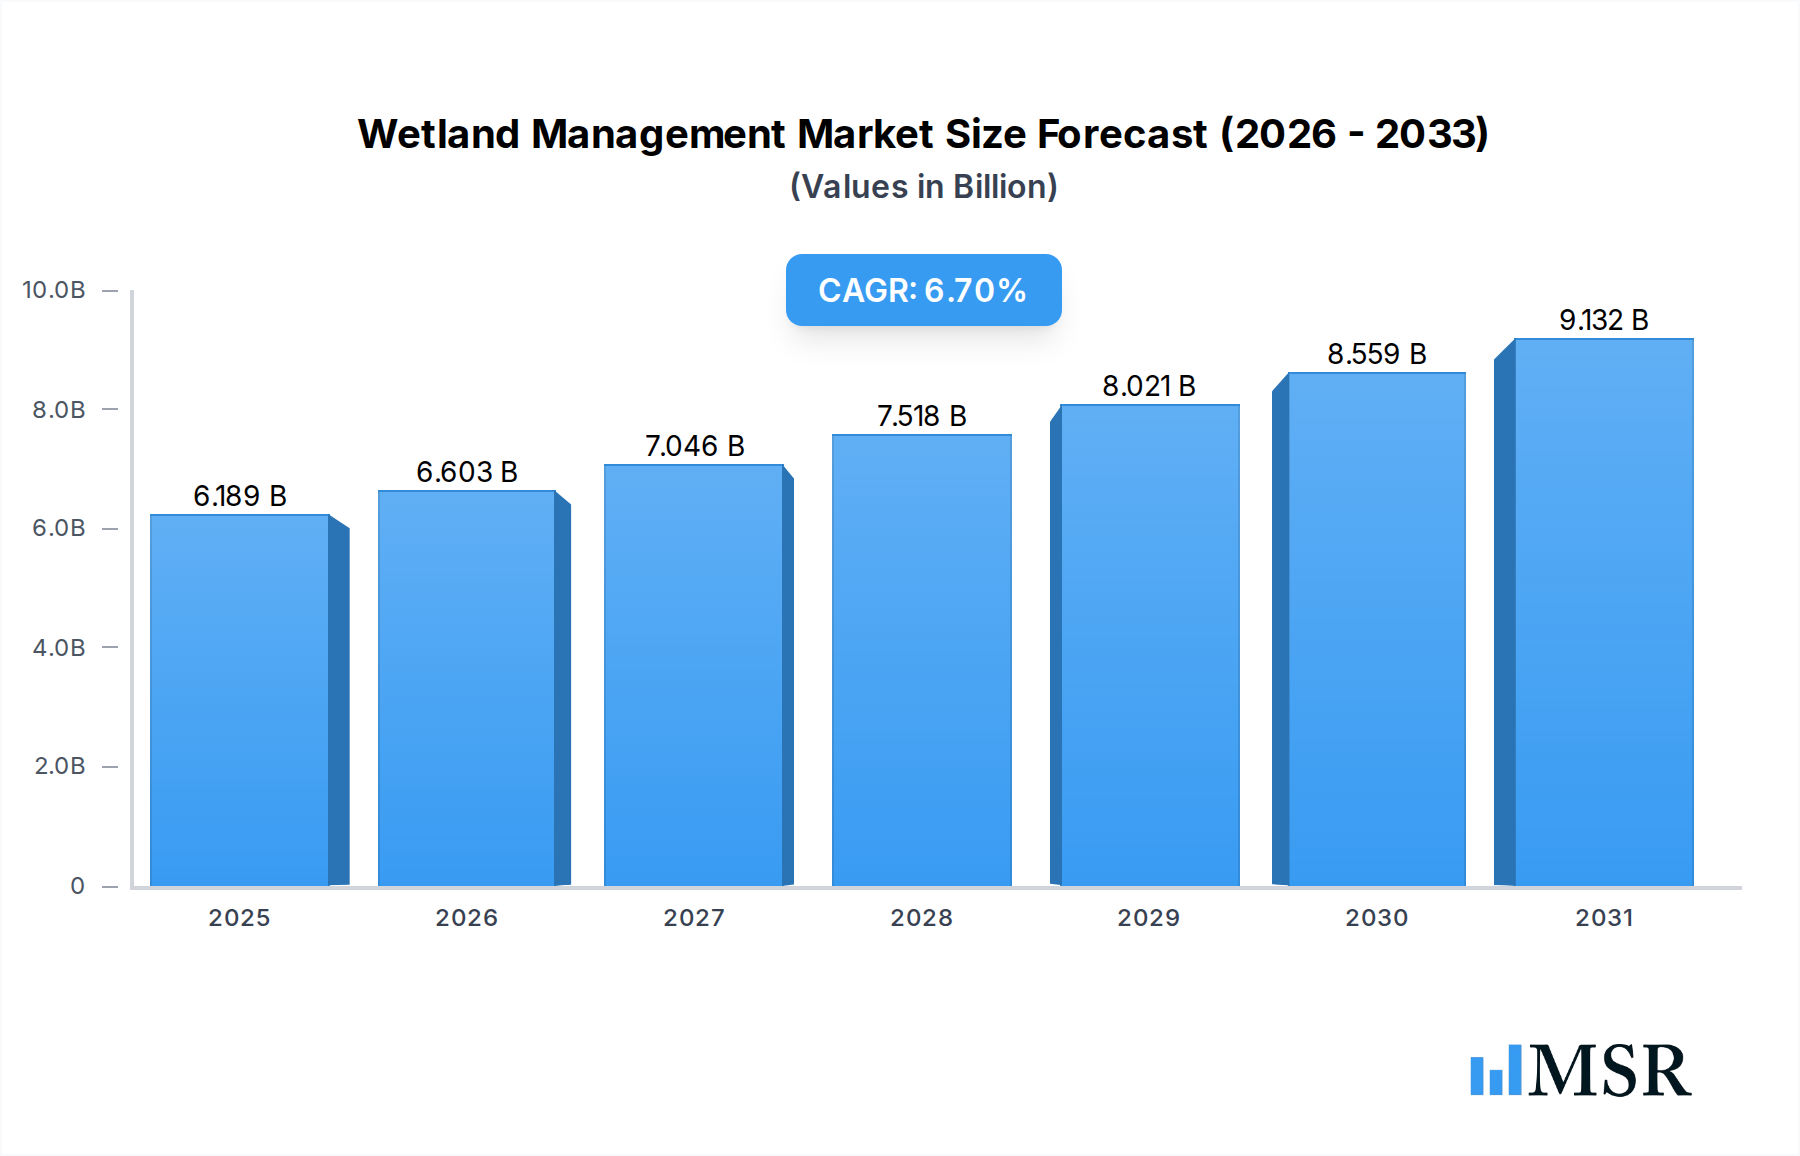
Wetland Management Company Market Share
Key Market Drivers & Constraints in Wetland Management Market
The trajectory of the Global Wetland Management Market is shaped by a confluence of powerful drivers and persistent constraints, each influencing its growth and operational dynamics.
Market Drivers:
- Regulatory Imperatives and Compliance: The single most significant driver is the increasing stringency and enforcement of environmental regulations globally. For instance, the U.S. Clean Water Act's Section 404 mandates permits for activities impacting wetlands, often requiring compensatory mitigation projects. Similarly, the European Water Framework Directive aims for good ecological status in water bodies, including wetlands. The need for businesses and government agencies to comply with these regulations directly fuels demand for wetland delineation, permitting, and mitigation services. Compliance costs can represent a significant portion of project budgets, creating a non-discretionary market for specialized firms. This regulatory push also strengthens the broader Environmental Consulting Market, as firms guide clients through complex legal landscapes.
- Recognition of Ecosystem Services: Growing scientific and public understanding of wetlands' invaluable ecosystem services—such as carbon sequestration, flood control, water purification, and biodiversity support—is driving voluntary and market-based conservation efforts. Quantitatively, wetlands globally contribute an estimated $47 trillion in ecosystem services annually, underpinning their economic importance beyond their ecological value. This awareness fuels demand from NGOs, corporate sustainability initiatives, and local municipalities, boosting the Urban Planning Market's focus on green infrastructure.
- Infrastructure Development and Mitigation: Rapid global infrastructure expansion (e.g., roads, energy pipelines, urban development) frequently impacts wetland ecosystems. This necessitates compensatory mitigation, where new wetlands are created or existing ones restored to offset environmental damage. Global infrastructure spending is projected to exceed $9 trillion annually by 2040, a substantial portion of which will interact with aquatic and terrestrial ecosystems, thereby creating a sustained demand for wetland management services. This also influences the Wastewater Treatment Equipment Market, as constructed wetlands are increasingly integrated into nature-based water treatment solutions.
Market Constraints:
- High Initial Costs and Long-Term Maintenance: Wetland creation and restoration projects are inherently capital-intensive, involving significant expenditures on land acquisition, hydrological engineering, native plant material procurement, and long-term monitoring. Average costs for wetland restoration can range from $5,000 to $20,000 per acre, with complex projects in urban or contaminated areas significantly exceeding this range. The need for sustained monitoring and adaptive management over several years adds to the operational expenditure, posing a financial barrier for smaller entities or projects with limited funding. The cost of materials, including those relevant to the Water Treatment Chemicals Market, can also fluctuate, impacting overall project budgets.
- Land Availability and Competing Land Uses: The scarcity of suitable land for large-scale wetland creation or restoration, particularly in densely populated regions or areas dominated by agriculture, presents a significant constraint. Competing land uses, such as for housing, industry, or food production, drive up land prices and limit the feasibility of wetland projects. This spatial limitation complicates mitigation efforts and can increase the cost of mitigation credits.
- Complex Permitting and Regulatory Hurdles: The intricate and often lengthy permitting processes required for wetland projects, involving multiple governmental agencies at federal, state, and local levels, can cause substantial delays and increase administrative costs. Discrepancies in regulatory interpretations and evolving guidelines can further complicate project planning and execution, acting as a deterrent for potential investors or developers.
Competitive Ecosystem of Wetland Management Market
The Wetland Management Market is characterized by a diverse competitive landscape, comprising specialized environmental consulting firms, large engineering and construction companies with ecological divisions, and smaller, regionally focused restoration service providers. The market's fragmentation allows for both niche players and broader service providers to thrive by offering tailored solutions for wetland delineation, permitting, restoration, and monitoring. The emphasis on scientific expertise, regulatory compliance, and local ecological knowledge is paramount for success in this domain.
- Enviroscience, Inc.: A firm specializing in aquatic and wetland resource management, offering a range of services from scientific consulting and permitting to habitat restoration and invasive species control, catering to diverse client needs.
- SOLitude Lake Management: Focuses on sustainable lake and pond management, which often includes the design and implementation of wetland components for water quality improvement, stormwater management, and aesthetic enhancement.
- Applied Aquatic Management: Provides comprehensive aquatic vegetation and water quality management services for ponds, lakes, and wetland areas, addressing issues such as algal blooms and invasive plant species.
- Civil & Environmental Consultants, Inc.: Offers extensive environmental consulting, engineering, and ecological services, including wetland delineation, permitting, mitigation design, and construction oversight for complex development projects.
- Virginia Waters & Wetlands, Inc.: Specializes in wetland delineation, permitting, mitigation banking, and stream restoration, primarily serving clients in the Mid-Atlantic region with a focus on regulatory compliance and ecological integrity.
- Land Management Group: Provides ecological assessment, planning, and design services, with expertise in wetland and stream restoration projects, land conservation, and sustainable site development for public and private clients.
- Wetland Studies and Solutions, Inc.: A leading provider of integrated wetland and water resource services, including regulatory compliance, permitting, mitigation banking, and ecological restoration, known for its scientific rigor and comprehensive approach.
- All Habitat Services: Delivers ecological restoration, invasive species management, and prescribed burning services, often applied in wetland ecosystems, to enhance biodiversity and ecosystem health across various land types.
- Allstate Resource Management, Inc.: Engages in comprehensive natural resource management, including wetland and stormwater management solutions, erosion control, and ecological design for residential, commercial, and municipal projects.
- Dragonfly Pond Works: Offers pond and lake management services, frequently incorporating naturalized wetland edges and vegetative buffers for water quality improvement, erosion control, and wildlife habitat creation.
Recent Developments & Milestones in Wetland Management Market
Recent innovations and strategic shifts underscore the dynamic evolution of the Wetland Management Market, reflecting a collective effort towards enhanced conservation, restoration, and sustainable utilization of these vital ecosystems:
- January 2023: A consortium of leading environmental agencies and geospatial technology firms launched a new satellite-based wetland monitoring platform. This initiative significantly enhanced precision in hydrological assessments and automated degradation detection, bolstering the capabilities of the GIS Mapping Market and the broader Environmental Monitoring Market.
- April 2023: The European Commission announced a substantial increase in funding allocations for nature-based solutions (NBS) initiatives across member states. A significant portion of this funding is specifically directed towards large-scale wetland restoration projects, aiming to improve biodiversity and climate resilience.
- July 2023: A major international conservation NGO partnered with a specialized AI and machine learning company to develop AI-driven tools for rapid wetland degradation detection and predictive modeling. This collaboration aims to optimize intervention strategies and improve the efficiency of restoration efforts within the Ecological Restoration Market.
- October 2023: Several North American states introduced new federal and state-level tax incentives for private landowners who implement wetland conservation easements. These incentives aim to encourage voluntary wetland protection and sustainable land use practices, promoting the Agricultural Water Management Market and land stewardship.
- February 2024: Updated international guidelines for carbon accounting in blue carbon ecosystems, including coastal wetlands, were published. This milestone aims to facilitate the integration of wetland conservation and restoration into national climate mitigation strategies and carbon credit markets, further intertwining environmental services with economic incentives.
- May 2024: A leading university research team announced a breakthrough in developing drought-resistant native plant species specifically engineered for wetland restoration in arid and semi-arid regions. This advancement promises to enhance the success rates of projects in challenging climatic zones.
Regional Market Breakdown for Wetland Management Market
The Global Wetland Management Market exhibits distinct regional dynamics, influenced by varying regulatory frameworks, environmental pressures, and economic development levels. Each major region contributes uniquely to the market's overall growth and innovation.
North America: This region holds a substantial revenue share in the Wetland Management Market and is characterized by a mature regulatory environment, notably the U.S. Clean Water Act, which mandates stringent wetland protection and mitigation requirements. The presence of well-established mitigation banking systems allows for structured compliance and investment. The primary demand driver is regulatory compliance coupled with a strong private sector involvement in infrastructure development and environmental consulting. The United States, in particular, leads in market size due to extensive past wetland loss and ongoing development pressures. Growth in North America is steady, driven by infrastructure upgrades and increasing climate resilience efforts.
Europe: Europe represents another significant market, driven by comprehensive environmental policies such as the EU Water Framework Directive and the Birds and Habitats Directives. The region emphasizes nature-based solutions for water quality improvement, flood risk management, and biodiversity conservation. Government funding and robust scientific research underpin many wetland projects. Germany, France, and the UK are key contributors, investing heavily in ecological restoration and sustainable water management. The focus on integrating wetland health with broader Sustainable Agriculture Market initiatives further stimulates demand.
Asia Pacific: This region is projected to be the fastest-growing market for wetland management services. Rapid industrialization, urbanization, and large-scale infrastructure projects across countries like China, India, and Southeast Asian nations exert immense pressure on natural wetlands, necessitating significant mitigation and restoration efforts. Concurrently, increasing environmental awareness and evolving governmental policies aimed at combating pollution and climate change impacts (e.g., sea-level rise) are fueling market expansion. The demand driver here is primarily the need for environmental impact mitigation and the growing focus on ecological protection to sustain economic growth. There is also a nascent but growing recognition of the role of wetlands in the Agricultural Water Management Market.
Middle East & Africa (MEA): The MEA region is an emerging market, with growth driven by resource extraction impacts, developing environmental regulations, and a growing focus on water scarcity and desertification. Investments in wetland management are often linked to industrial development projects requiring environmental impact assessments and compensatory measures. While smaller in absolute terms, the potential for high growth exists as environmental awareness and regulatory frameworks mature, particularly in GCC countries investing in sustainable urban development and the Environmental Monitoring Market.
South America: This region is also an emerging market with significant biodiversity and large wetland areas like the Amazon and Pantanal. Demand for wetland management is primarily driven by mitigating the environmental impacts of agriculture, mining, and energy projects, as well as increasing awareness of biodiversity loss. Brazil and Argentina are key countries with growing regulatory frameworks and increasing project activity aimed at conservation and sustainable land use practices. The region's vast natural capital offers significant long-term growth potential for the Ecological Restoration Market.
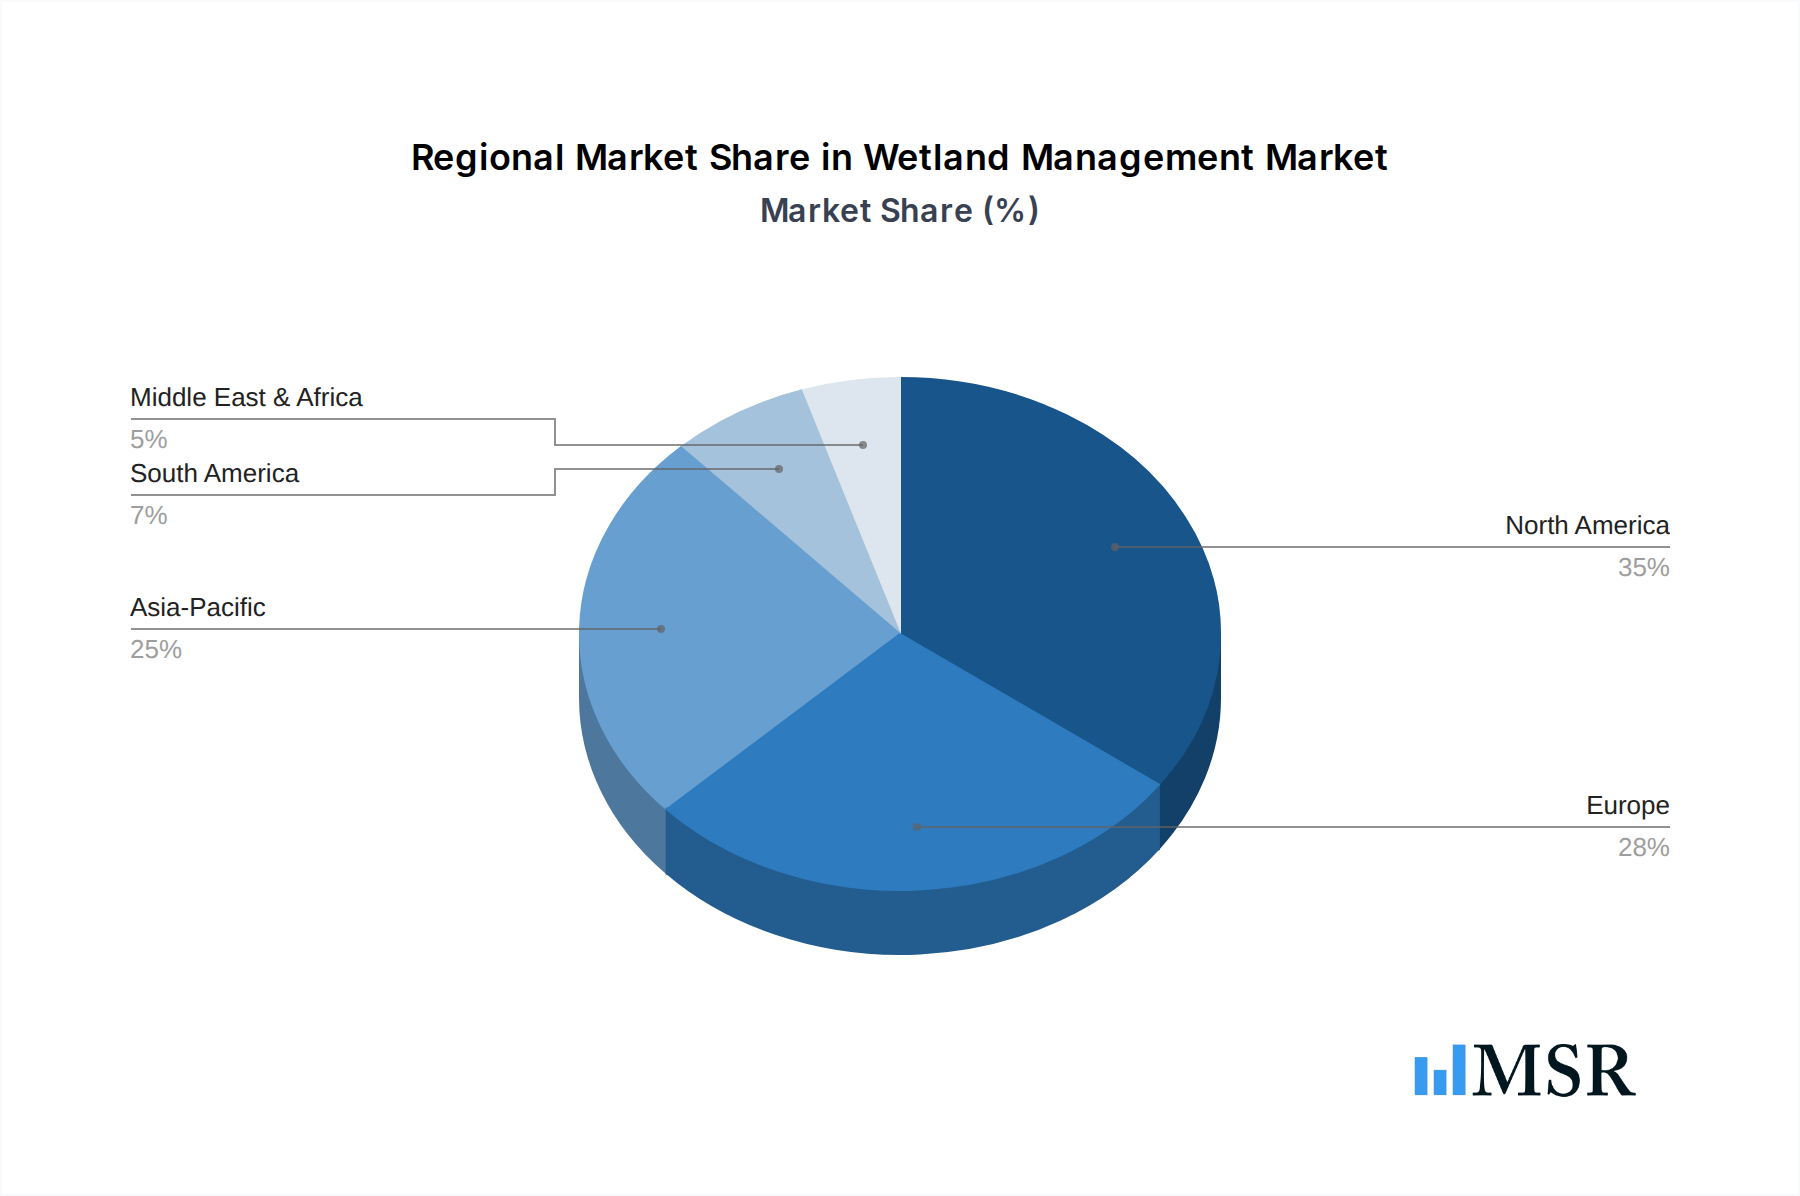
Wetland Management Regional Market Share
Export, Trade Flow & Tariff Impact on Wetland Management Market
The Wetland Management Market is predominantly a service-oriented industry, which inherently limits direct trade flows of finished goods subject to conventional tariffs. However, indirect trade dynamics significantly influence the market. The export and import of specialized knowledge, technological solutions, and skilled environmental professionals constitute key cross-border exchanges. Major trade corridors for intellectual property and consulting services typically follow established economic alliances, with North American and European firms often providing expertise to developing markets in Asia Pacific, Latin America, and Africa. Leading exporting nations of wetland management consulting services and technology include the United States, Germany, the Netherlands, and Canada, while major importing nations are those undergoing rapid infrastructure development or facing significant ecological degradation. For instance, the demand for sophisticated hydrological modeling software and remote sensing data processing capabilities, crucial for the GIS Mapping Market, sees considerable international exchange. Similarly, specialized equipment for water quality analysis, often tied to the Water Treatment Chemicals Market, is sourced globally. Tariff barriers directly impact the cost of these specialized inputs. For example, tariffs on high-precision scientific instruments or specific plant species for restoration, which might be imported due to local scarcity or genetic diversity needs, can incrementally increase project costs. While the direct quantification of tariff impact on the overall $5.8 billion Wetland Management Market is complex, an estimated 2-5% increase in the cost of imported technological components and specialized materials can be observed, particularly amidst global trade tensions. Non-tariff barriers, such as complex licensing requirements for foreign environmental consultants or differing ecological standards, pose more significant challenges to cross-border service provision than direct tariffs. However, the global imperative for climate action and biodiversity conservation often overrides these barriers, facilitating the flow of best practices and collaborative projects, thus enhancing the global footprint of the Environmental Consulting Market.
Supply Chain & Raw Material Dynamics for Wetland Management Market
The Wetland Management Market's supply chain is intricate, characterized by upstream dependencies on specialized providers of ecological materials, advanced technologies, and highly skilled labor. Key upstream dependencies include native plant nurseries, hydrological engineering firms, specialized soil and sediment suppliers, manufacturers of environmental monitoring equipment, and producers of bioremediation agents. These inputs are critical for successful wetland restoration, creation, and ongoing maintenance projects. Sourcing risks are notable, particularly concerning the availability of specific native plant genotypes, which can be localized and seasonal, leading to potential delays or increased costs if demand outstrips supply. Quality control for soil amendments and specific seeding mixes is also crucial. The market for the Wastewater Treatment Equipment Market and related components, vital for constructed wetlands, adds another layer of complexity, with reliance on global manufacturing and supply networks.
Price volatility of key inputs is a moderate concern. Energy costs directly impact the transportation of materials and the manufacturing of synthetic components like geotextiles. Labor costs, especially for skilled ecologists, hydrologists, and field technicians, are a significant and generally upward-trending expense. Prices for native plant stock typically remain stable but can experience spikes for rare or difficult-to-propagate species following high-demand periods or environmental events affecting nurseries. Similarly, certain water quality testing reagents, relevant to the Water Treatment Chemicals Market, may exhibit moderate price fluctuations based on global chemical markets. Historically, global supply chain disruptions, such as those experienced during the COVID-19 pandemic, have affected the availability of manufactured goods like specialized sensors and GPS equipment, vital for the GIS Mapping Market, leading to project delays and increased procurement costs. These disruptions underscored the need for resilient sourcing strategies and localization where feasible. Geotextiles, commonly used for erosion control and substrate stabilization in wetland construction, see their prices influenced by petroleum derivatives, indicating a moderate upward trend consistent with global oil prices. Overall, the supply chain for the Wetland Management Market requires robust planning and diversified sourcing to mitigate risks associated with material availability, quality, and price volatility, ensuring the long-term success and cost-effectiveness of wetland projects.
Wetland Management Segmentation
-
1. Service Type
- 1.1. Restoration & Rehabilitation
- 1.2. Conservation
- 1.3. Assessment, Mapping, & Monitoring
- 1.4. Consulting and Planning
- 1.5. Others
-
2. Wetland Type
- 2.1. Natural Wetlands
- 2.2. Constructed/Artificial Wetlands
-
3. Application
- 3.1. Commercial
- 3.2. Municipal
-
4. End User
- 4.1. Government & Public Agencies
- 4.2. Mining, Energy, & Infrastructure
- 4.3. Agriculture & Forestry
- 4.4. Water & Wastewater Treatment Utilities
- 4.5. NGOs & Trusts
- 4.6. Others
Wetland Management Segmentation By Geography
-
1. North America
- 1.1. United States
- 1.2. Canada
- 1.3. Mexico
-
2. South America
- 2.1. Brazil
- 2.2. Argentina
- 2.3. Rest of South America
-
3. Europe
- 3.1. United Kingdom
- 3.2. Germany
- 3.3. France
- 3.4. Italy
- 3.5. Spain
- 3.6. Russia
- 3.7. Benelux
- 3.8. Nordics
- 3.9. Rest of Europe
-
4. Middle East & Africa
- 4.1. Turkey
- 4.2. Israel
- 4.3. GCC
- 4.4. North Africa
- 4.5. South Africa
- 4.6. Rest of Middle East & Africa
-
5. Asia Pacific
- 5.1. China
- 5.2. India
- 5.3. Japan
- 5.4. South Korea
- 5.5. ASEAN
- 5.6. Oceania
- 5.7. Rest of Asia Pacific
Wetland Management Regional Market Share
Geographic Coverage of Wetland Management
Wetland Management REPORT HIGHLIGHTS
| Aspects | Details |
|---|---|
| Study Period | 2020-2034 |
| Base Year | 2025 |
| Estimated Year | 2026 |
| Forecast Period | 2026-2034 |
| Historical Period | 2020-2025 |
| Growth Rate | CAGR of 6.7% from 2020-2034 |
| Segmentation |
|
Table of Contents
- 1. Introduction
- 1.1. Research Scope
- 1.2. Market Segmentation
- 1.3. Research Objective
- 1.4. Definitions and Assumptions
- 2. Executive Summary
- 2.1. Market Snapshot
- 3. Market Dynamics
- 3.1. Market Drivers
- 3.2. Market Restrains
- 3.3. Market Trends
- 3.4. Market Opportunities
- 4. Market Factor Analysis
- 4.1. Porters Five Forces
- 4.1.1. Bargaining Power of Suppliers
- 4.1.2. Bargaining Power of Buyers
- 4.1.3. Threat of New Entrants
- 4.1.4. Threat of Substitutes
- 4.1.5. Competitive Rivalry
- 4.2. PESTEL analysis
- 4.3. BCG Analysis
- 4.3.1. Stars (High Growth, High Market Share)
- 4.3.2. Cash Cows (Low Growth, High Market Share)
- 4.3.3. Question Mark (High Growth, Low Market Share)
- 4.3.4. Dogs (Low Growth, Low Market Share)
- 4.4. Ansoff Matrix Analysis
- 4.5. Supply Chain Analysis
- 4.6. Regulatory Landscape
- 4.7. Current Market Potential and Opportunity Assessment (TAM–SAM–SOM Framework)
- 4.8. MSR Analyst Note
- 4.1. Porters Five Forces
- 5. Market Analysis, Insights and Forecast 2021-2033
- 5.1. Market Analysis, Insights and Forecast - by Service Type
- 5.1.1. Restoration & Rehabilitation
- 5.1.2. Conservation
- 5.1.3. Assessment, Mapping, & Monitoring
- 5.1.4. Consulting and Planning
- 5.1.5. Others
- 5.2. Market Analysis, Insights and Forecast - by Wetland Type
- 5.2.1. Natural Wetlands
- 5.2.2. Constructed/Artificial Wetlands
- 5.3. Market Analysis, Insights and Forecast - by Application
- 5.3.1. Commercial
- 5.3.2. Municipal
- 5.4. Market Analysis, Insights and Forecast - by End User
- 5.4.1. Government & Public Agencies
- 5.4.2. Mining, Energy, & Infrastructure
- 5.4.3. Agriculture & Forestry
- 5.4.4. Water & Wastewater Treatment Utilities
- 5.4.5. NGOs & Trusts
- 5.4.6. Others
- 5.5. Market Analysis, Insights and Forecast - by Region
- 5.5.1. North America
- 5.5.2. South America
- 5.5.3. Europe
- 5.5.4. Middle East & Africa
- 5.5.5. Asia Pacific
- 5.1. Market Analysis, Insights and Forecast - by Service Type
- 6. Global Wetland Management Analysis, Insights and Forecast, 2021-2033
- 6.1. Market Analysis, Insights and Forecast - by Service Type
- 6.1.1. Restoration & Rehabilitation
- 6.1.2. Conservation
- 6.1.3. Assessment, Mapping, & Monitoring
- 6.1.4. Consulting and Planning
- 6.1.5. Others
- 6.2. Market Analysis, Insights and Forecast - by Wetland Type
- 6.2.1. Natural Wetlands
- 6.2.2. Constructed/Artificial Wetlands
- 6.3. Market Analysis, Insights and Forecast - by Application
- 6.3.1. Commercial
- 6.3.2. Municipal
- 6.4. Market Analysis, Insights and Forecast - by End User
- 6.4.1. Government & Public Agencies
- 6.4.2. Mining, Energy, & Infrastructure
- 6.4.3. Agriculture & Forestry
- 6.4.4. Water & Wastewater Treatment Utilities
- 6.4.5. NGOs & Trusts
- 6.4.6. Others
- 6.1. Market Analysis, Insights and Forecast - by Service Type
- 7. North America Wetland Management Analysis, Insights and Forecast, 2020-2032
- 7.1. Market Analysis, Insights and Forecast - by Service Type
- 7.1.1. Restoration & Rehabilitation
- 7.1.2. Conservation
- 7.1.3. Assessment, Mapping, & Monitoring
- 7.1.4. Consulting and Planning
- 7.1.5. Others
- 7.2. Market Analysis, Insights and Forecast - by Wetland Type
- 7.2.1. Natural Wetlands
- 7.2.2. Constructed/Artificial Wetlands
- 7.3. Market Analysis, Insights and Forecast - by Application
- 7.3.1. Commercial
- 7.3.2. Municipal
- 7.4. Market Analysis, Insights and Forecast - by End User
- 7.4.1. Government & Public Agencies
- 7.4.2. Mining, Energy, & Infrastructure
- 7.4.3. Agriculture & Forestry
- 7.4.4. Water & Wastewater Treatment Utilities
- 7.4.5. NGOs & Trusts
- 7.4.6. Others
- 7.1. Market Analysis, Insights and Forecast - by Service Type
- 8. South America Wetland Management Analysis, Insights and Forecast, 2020-2032
- 8.1. Market Analysis, Insights and Forecast - by Service Type
- 8.1.1. Restoration & Rehabilitation
- 8.1.2. Conservation
- 8.1.3. Assessment, Mapping, & Monitoring
- 8.1.4. Consulting and Planning
- 8.1.5. Others
- 8.2. Market Analysis, Insights and Forecast - by Wetland Type
- 8.2.1. Natural Wetlands
- 8.2.2. Constructed/Artificial Wetlands
- 8.3. Market Analysis, Insights and Forecast - by Application
- 8.3.1. Commercial
- 8.3.2. Municipal
- 8.4. Market Analysis, Insights and Forecast - by End User
- 8.4.1. Government & Public Agencies
- 8.4.2. Mining, Energy, & Infrastructure
- 8.4.3. Agriculture & Forestry
- 8.4.4. Water & Wastewater Treatment Utilities
- 8.4.5. NGOs & Trusts
- 8.4.6. Others
- 8.1. Market Analysis, Insights and Forecast - by Service Type
- 9. Europe Wetland Management Analysis, Insights and Forecast, 2020-2032
- 9.1. Market Analysis, Insights and Forecast - by Service Type
- 9.1.1. Restoration & Rehabilitation
- 9.1.2. Conservation
- 9.1.3. Assessment, Mapping, & Monitoring
- 9.1.4. Consulting and Planning
- 9.1.5. Others
- 9.2. Market Analysis, Insights and Forecast - by Wetland Type
- 9.2.1. Natural Wetlands
- 9.2.2. Constructed/Artificial Wetlands
- 9.3. Market Analysis, Insights and Forecast - by Application
- 9.3.1. Commercial
- 9.3.2. Municipal
- 9.4. Market Analysis, Insights and Forecast - by End User
- 9.4.1. Government & Public Agencies
- 9.4.2. Mining, Energy, & Infrastructure
- 9.4.3. Agriculture & Forestry
- 9.4.4. Water & Wastewater Treatment Utilities
- 9.4.5. NGOs & Trusts
- 9.4.6. Others
- 9.1. Market Analysis, Insights and Forecast - by Service Type
- 10. Middle East & Africa Wetland Management Analysis, Insights and Forecast, 2020-2032
- 10.1. Market Analysis, Insights and Forecast - by Service Type
- 10.1.1. Restoration & Rehabilitation
- 10.1.2. Conservation
- 10.1.3. Assessment, Mapping, & Monitoring
- 10.1.4. Consulting and Planning
- 10.1.5. Others
- 10.2. Market Analysis, Insights and Forecast - by Wetland Type
- 10.2.1. Natural Wetlands
- 10.2.2. Constructed/Artificial Wetlands
- 10.3. Market Analysis, Insights and Forecast - by Application
- 10.3.1. Commercial
- 10.3.2. Municipal
- 10.4. Market Analysis, Insights and Forecast - by End User
- 10.4.1. Government & Public Agencies
- 10.4.2. Mining, Energy, & Infrastructure
- 10.4.3. Agriculture & Forestry
- 10.4.4. Water & Wastewater Treatment Utilities
- 10.4.5. NGOs & Trusts
- 10.4.6. Others
- 10.1. Market Analysis, Insights and Forecast - by Service Type
- 11. Asia Pacific Wetland Management Analysis, Insights and Forecast, 2020-2032
- 11.1. Market Analysis, Insights and Forecast - by Service Type
- 11.1.1. Restoration & Rehabilitation
- 11.1.2. Conservation
- 11.1.3. Assessment, Mapping, & Monitoring
- 11.1.4. Consulting and Planning
- 11.1.5. Others
- 11.2. Market Analysis, Insights and Forecast - by Wetland Type
- 11.2.1. Natural Wetlands
- 11.2.2. Constructed/Artificial Wetlands
- 11.3. Market Analysis, Insights and Forecast - by Application
- 11.3.1. Commercial
- 11.3.2. Municipal
- 11.4. Market Analysis, Insights and Forecast - by End User
- 11.4.1. Government & Public Agencies
- 11.4.2. Mining, Energy, & Infrastructure
- 11.4.3. Agriculture & Forestry
- 11.4.4. Water & Wastewater Treatment Utilities
- 11.4.5. NGOs & Trusts
- 11.4.6. Others
- 11.1. Market Analysis, Insights and Forecast - by Service Type
- 12. Competitive Analysis
- 12.1. Company Profiles
- 12.1.1 Enviroscience
- 12.1.1.1. Company Overview
- 12.1.1.2. Products
- 12.1.1.3. Company Financials
- 12.1.1.4. SWOT Analysis
- 12.1.2 Inc.
- 12.1.2.1. Company Overview
- 12.1.2.2. Products
- 12.1.2.3. Company Financials
- 12.1.2.4. SWOT Analysis
- 12.1.3 SOLitude Lake Management
- 12.1.3.1. Company Overview
- 12.1.3.2. Products
- 12.1.3.3. Company Financials
- 12.1.3.4. SWOT Analysis
- 12.1.4 Applied Aquatic Management
- 12.1.4.1. Company Overview
- 12.1.4.2. Products
- 12.1.4.3. Company Financials
- 12.1.4.4. SWOT Analysis
- 12.1.5 Civil & Environmental Consultants
- 12.1.5.1. Company Overview
- 12.1.5.2. Products
- 12.1.5.3. Company Financials
- 12.1.5.4. SWOT Analysis
- 12.1.6 Inc.
- 12.1.6.1. Company Overview
- 12.1.6.2. Products
- 12.1.6.3. Company Financials
- 12.1.6.4. SWOT Analysis
- 12.1.7 Virginia Waters & Wetlands
- 12.1.7.1. Company Overview
- 12.1.7.2. Products
- 12.1.7.3. Company Financials
- 12.1.7.4. SWOT Analysis
- 12.1.8 Inc.
- 12.1.8.1. Company Overview
- 12.1.8.2. Products
- 12.1.8.3. Company Financials
- 12.1.8.4. SWOT Analysis
- 12.1.9 Land Management Group
- 12.1.9.1. Company Overview
- 12.1.9.2. Products
- 12.1.9.3. Company Financials
- 12.1.9.4. SWOT Analysis
- 12.1.10 Wetland Studies and Solutions
- 12.1.10.1. Company Overview
- 12.1.10.2. Products
- 12.1.10.3. Company Financials
- 12.1.10.4. SWOT Analysis
- 12.1.11 Inc.
- 12.1.11.1. Company Overview
- 12.1.11.2. Products
- 12.1.11.3. Company Financials
- 12.1.11.4. SWOT Analysis
- 12.1.12 All Habitat Services
- 12.1.12.1. Company Overview
- 12.1.12.2. Products
- 12.1.12.3. Company Financials
- 12.1.12.4. SWOT Analysis
- 12.1.13 Allstate Resource Management
- 12.1.13.1. Company Overview
- 12.1.13.2. Products
- 12.1.13.3. Company Financials
- 12.1.13.4. SWOT Analysis
- 12.1.14 Inc.
- 12.1.14.1. Company Overview
- 12.1.14.2. Products
- 12.1.14.3. Company Financials
- 12.1.14.4. SWOT Analysis
- 12.1.15 Dragonfly Pond Works
- 12.1.15.1. Company Overview
- 12.1.15.2. Products
- 12.1.15.3. Company Financials
- 12.1.15.4. SWOT Analysis
- 12.1.1 Enviroscience
- 12.2. Market Entropy
- 12.2.1 Company's Key Areas Served
- 12.2.2 Recent Developments
- 12.3. Company Market Share Analysis 2025
- 12.3.1 Top 5 Companies Market Share Analysis
- 12.3.2 Top 3 Companies Market Share Analysis
- 12.4. List of Potential Customers
- 13. Research Methodology
List of Figures
- Figure 1: Global Wetland Management Revenue Breakdown (billion, %) by Region 2025 & 2033
- Figure 2: North America Wetland Management Revenue (billion), by Service Type 2025 & 2033
- Figure 3: North America Wetland Management Revenue Share (%), by Service Type 2025 & 2033
- Figure 4: North America Wetland Management Revenue (billion), by Wetland Type 2025 & 2033
- Figure 5: North America Wetland Management Revenue Share (%), by Wetland Type 2025 & 2033
- Figure 6: North America Wetland Management Revenue (billion), by Application 2025 & 2033
- Figure 7: North America Wetland Management Revenue Share (%), by Application 2025 & 2033
- Figure 8: North America Wetland Management Revenue (billion), by End User 2025 & 2033
- Figure 9: North America Wetland Management Revenue Share (%), by End User 2025 & 2033
- Figure 10: North America Wetland Management Revenue (billion), by Country 2025 & 2033
- Figure 11: North America Wetland Management Revenue Share (%), by Country 2025 & 2033
- Figure 12: South America Wetland Management Revenue (billion), by Service Type 2025 & 2033
- Figure 13: South America Wetland Management Revenue Share (%), by Service Type 2025 & 2033
- Figure 14: South America Wetland Management Revenue (billion), by Wetland Type 2025 & 2033
- Figure 15: South America Wetland Management Revenue Share (%), by Wetland Type 2025 & 2033
- Figure 16: South America Wetland Management Revenue (billion), by Application 2025 & 2033
- Figure 17: South America Wetland Management Revenue Share (%), by Application 2025 & 2033
- Figure 18: South America Wetland Management Revenue (billion), by End User 2025 & 2033
- Figure 19: South America Wetland Management Revenue Share (%), by End User 2025 & 2033
- Figure 20: South America Wetland Management Revenue (billion), by Country 2025 & 2033
- Figure 21: South America Wetland Management Revenue Share (%), by Country 2025 & 2033
- Figure 22: Europe Wetland Management Revenue (billion), by Service Type 2025 & 2033
- Figure 23: Europe Wetland Management Revenue Share (%), by Service Type 2025 & 2033
- Figure 24: Europe Wetland Management Revenue (billion), by Wetland Type 2025 & 2033
- Figure 25: Europe Wetland Management Revenue Share (%), by Wetland Type 2025 & 2033
- Figure 26: Europe Wetland Management Revenue (billion), by Application 2025 & 2033
- Figure 27: Europe Wetland Management Revenue Share (%), by Application 2025 & 2033
- Figure 28: Europe Wetland Management Revenue (billion), by End User 2025 & 2033
- Figure 29: Europe Wetland Management Revenue Share (%), by End User 2025 & 2033
- Figure 30: Europe Wetland Management Revenue (billion), by Country 2025 & 2033
- Figure 31: Europe Wetland Management Revenue Share (%), by Country 2025 & 2033
- Figure 32: Middle East & Africa Wetland Management Revenue (billion), by Service Type 2025 & 2033
- Figure 33: Middle East & Africa Wetland Management Revenue Share (%), by Service Type 2025 & 2033
- Figure 34: Middle East & Africa Wetland Management Revenue (billion), by Wetland Type 2025 & 2033
- Figure 35: Middle East & Africa Wetland Management Revenue Share (%), by Wetland Type 2025 & 2033
- Figure 36: Middle East & Africa Wetland Management Revenue (billion), by Application 2025 & 2033
- Figure 37: Middle East & Africa Wetland Management Revenue Share (%), by Application 2025 & 2033
- Figure 38: Middle East & Africa Wetland Management Revenue (billion), by End User 2025 & 2033
- Figure 39: Middle East & Africa Wetland Management Revenue Share (%), by End User 2025 & 2033
- Figure 40: Middle East & Africa Wetland Management Revenue (billion), by Country 2025 & 2033
- Figure 41: Middle East & Africa Wetland Management Revenue Share (%), by Country 2025 & 2033
- Figure 42: Asia Pacific Wetland Management Revenue (billion), by Service Type 2025 & 2033
- Figure 43: Asia Pacific Wetland Management Revenue Share (%), by Service Type 2025 & 2033
- Figure 44: Asia Pacific Wetland Management Revenue (billion), by Wetland Type 2025 & 2033
- Figure 45: Asia Pacific Wetland Management Revenue Share (%), by Wetland Type 2025 & 2033
- Figure 46: Asia Pacific Wetland Management Revenue (billion), by Application 2025 & 2033
- Figure 47: Asia Pacific Wetland Management Revenue Share (%), by Application 2025 & 2033
- Figure 48: Asia Pacific Wetland Management Revenue (billion), by End User 2025 & 2033
- Figure 49: Asia Pacific Wetland Management Revenue Share (%), by End User 2025 & 2033
- Figure 50: Asia Pacific Wetland Management Revenue (billion), by Country 2025 & 2033
- Figure 51: Asia Pacific Wetland Management Revenue Share (%), by Country 2025 & 2033
List of Tables
- Table 1: Global Wetland Management Revenue billion Forecast, by Service Type 2020 & 2033
- Table 2: Global Wetland Management Revenue billion Forecast, by Wetland Type 2020 & 2033
- Table 3: Global Wetland Management Revenue billion Forecast, by Application 2020 & 2033
- Table 4: Global Wetland Management Revenue billion Forecast, by End User 2020 & 2033
- Table 5: Global Wetland Management Revenue billion Forecast, by Region 2020 & 2033
- Table 6: Global Wetland Management Revenue billion Forecast, by Service Type 2020 & 2033
- Table 7: Global Wetland Management Revenue billion Forecast, by Wetland Type 2020 & 2033
- Table 8: Global Wetland Management Revenue billion Forecast, by Application 2020 & 2033
- Table 9: Global Wetland Management Revenue billion Forecast, by End User 2020 & 2033
- Table 10: Global Wetland Management Revenue billion Forecast, by Country 2020 & 2033
- Table 11: United States Wetland Management Revenue (billion) Forecast, by Application 2020 & 2033
- Table 12: Canada Wetland Management Revenue (billion) Forecast, by Application 2020 & 2033
- Table 13: Mexico Wetland Management Revenue (billion) Forecast, by Application 2020 & 2033
- Table 14: Global Wetland Management Revenue billion Forecast, by Service Type 2020 & 2033
- Table 15: Global Wetland Management Revenue billion Forecast, by Wetland Type 2020 & 2033
- Table 16: Global Wetland Management Revenue billion Forecast, by Application 2020 & 2033
- Table 17: Global Wetland Management Revenue billion Forecast, by End User 2020 & 2033
- Table 18: Global Wetland Management Revenue billion Forecast, by Country 2020 & 2033
- Table 19: Brazil Wetland Management Revenue (billion) Forecast, by Application 2020 & 2033
- Table 20: Argentina Wetland Management Revenue (billion) Forecast, by Application 2020 & 2033
- Table 21: Rest of South America Wetland Management Revenue (billion) Forecast, by Application 2020 & 2033
- Table 22: Global Wetland Management Revenue billion Forecast, by Service Type 2020 & 2033
- Table 23: Global Wetland Management Revenue billion Forecast, by Wetland Type 2020 & 2033
- Table 24: Global Wetland Management Revenue billion Forecast, by Application 2020 & 2033
- Table 25: Global Wetland Management Revenue billion Forecast, by End User 2020 & 2033
- Table 26: Global Wetland Management Revenue billion Forecast, by Country 2020 & 2033
- Table 27: United Kingdom Wetland Management Revenue (billion) Forecast, by Application 2020 & 2033
- Table 28: Germany Wetland Management Revenue (billion) Forecast, by Application 2020 & 2033
- Table 29: France Wetland Management Revenue (billion) Forecast, by Application 2020 & 2033
- Table 30: Italy Wetland Management Revenue (billion) Forecast, by Application 2020 & 2033
- Table 31: Spain Wetland Management Revenue (billion) Forecast, by Application 2020 & 2033
- Table 32: Russia Wetland Management Revenue (billion) Forecast, by Application 2020 & 2033
- Table 33: Benelux Wetland Management Revenue (billion) Forecast, by Application 2020 & 2033
- Table 34: Nordics Wetland Management Revenue (billion) Forecast, by Application 2020 & 2033
- Table 35: Rest of Europe Wetland Management Revenue (billion) Forecast, by Application 2020 & 2033
- Table 36: Global Wetland Management Revenue billion Forecast, by Service Type 2020 & 2033
- Table 37: Global Wetland Management Revenue billion Forecast, by Wetland Type 2020 & 2033
- Table 38: Global Wetland Management Revenue billion Forecast, by Application 2020 & 2033
- Table 39: Global Wetland Management Revenue billion Forecast, by End User 2020 & 2033
- Table 40: Global Wetland Management Revenue billion Forecast, by Country 2020 & 2033
- Table 41: Turkey Wetland Management Revenue (billion) Forecast, by Application 2020 & 2033
- Table 42: Israel Wetland Management Revenue (billion) Forecast, by Application 2020 & 2033
- Table 43: GCC Wetland Management Revenue (billion) Forecast, by Application 2020 & 2033
- Table 44: North Africa Wetland Management Revenue (billion) Forecast, by Application 2020 & 2033
- Table 45: South Africa Wetland Management Revenue (billion) Forecast, by Application 2020 & 2033
- Table 46: Rest of Middle East & Africa Wetland Management Revenue (billion) Forecast, by Application 2020 & 2033
- Table 47: Global Wetland Management Revenue billion Forecast, by Service Type 2020 & 2033
- Table 48: Global Wetland Management Revenue billion Forecast, by Wetland Type 2020 & 2033
- Table 49: Global Wetland Management Revenue billion Forecast, by Application 2020 & 2033
- Table 50: Global Wetland Management Revenue billion Forecast, by End User 2020 & 2033
- Table 51: Global Wetland Management Revenue billion Forecast, by Country 2020 & 2033
- Table 52: China Wetland Management Revenue (billion) Forecast, by Application 2020 & 2033
- Table 53: India Wetland Management Revenue (billion) Forecast, by Application 2020 & 2033
- Table 54: Japan Wetland Management Revenue (billion) Forecast, by Application 2020 & 2033
- Table 55: South Korea Wetland Management Revenue (billion) Forecast, by Application 2020 & 2033
- Table 56: ASEAN Wetland Management Revenue (billion) Forecast, by Application 2020 & 2033
- Table 57: Oceania Wetland Management Revenue (billion) Forecast, by Application 2020 & 2033
- Table 58: Rest of Asia Pacific Wetland Management Revenue (billion) Forecast, by Application 2020 & 2033
Frequently Asked Questions
1. What is the projected Compound Annual Growth Rate (CAGR) of the Wetland Management?
The projected CAGR is approximately 6.7%.
2. Which companies are prominent players in the Wetland Management?
Key companies in the market include Enviroscience, Inc., SOLitude Lake Management, Applied Aquatic Management, Civil & Environmental Consultants, Inc., Virginia Waters & Wetlands, Inc., Land Management Group, Wetland Studies and Solutions, Inc., All Habitat Services, Allstate Resource Management, Inc., Dragonfly Pond Works.
3. What are the main segments of the Wetland Management?
The market segments include Service Type, Wetland Type, Application, End User.
4. Can you provide details about the market size?
The market size is estimated to be USD 5.8 billion as of 2022.
5. What are some drivers contributing to market growth?
N/A
6. What are the notable trends driving market growth?
N/A
7. Are there any restraints impacting market growth?
N/A
8. Can you provide examples of recent developments in the market?
N/A
9. What pricing options are available for accessing the report?
Pricing options include single-user, multi-user, and enterprise licenses priced at USD 3350.00, USD 5025.00, and USD 6700.00 respectively.
10. Is the market size provided in terms of value or volume?
The market size is provided in terms of value, measured in billion.
11. Are there any specific market keywords associated with the report?
Yes, the market keyword associated with the report is "Wetland Management," which aids in identifying and referencing the specific market segment covered.
12. How do I determine which pricing option suits my needs best?
The pricing options vary based on user requirements and access needs. Individual users may opt for single-user licenses, while businesses requiring broader access may choose multi-user or enterprise licenses for cost-effective access to the report.
13. Are there any additional resources or data provided in the Wetland Management report?
While the report offers comprehensive insights, it's advisable to review the specific contents or supplementary materials provided to ascertain if additional resources or data are available.
14. How can I stay updated on further developments or reports in the Wetland Management?
To stay informed about further developments, trends, and reports in the Wetland Management, consider subscribing to industry newsletters, following relevant companies and organizations, or regularly checking reputable industry news sources and publications.
Methodology
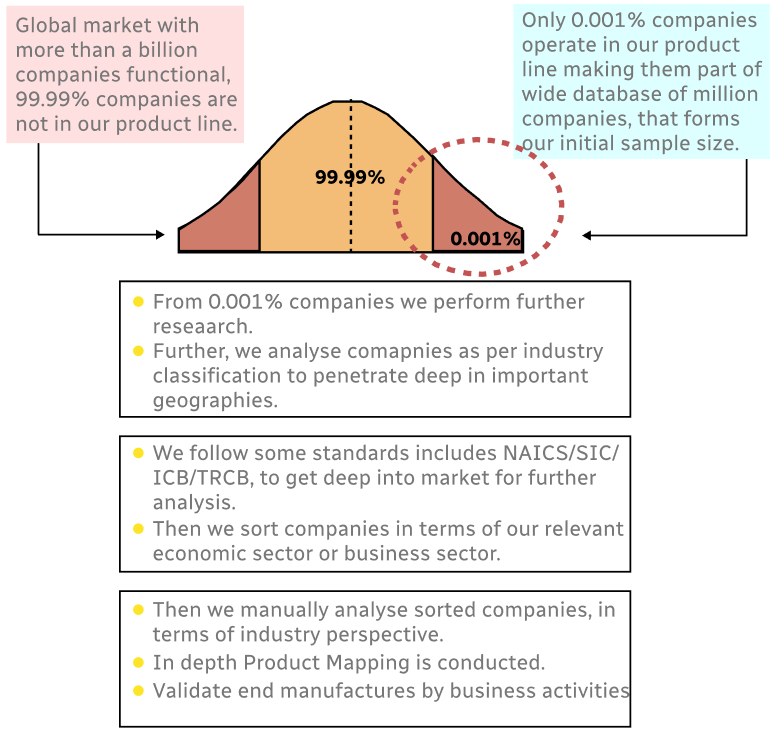
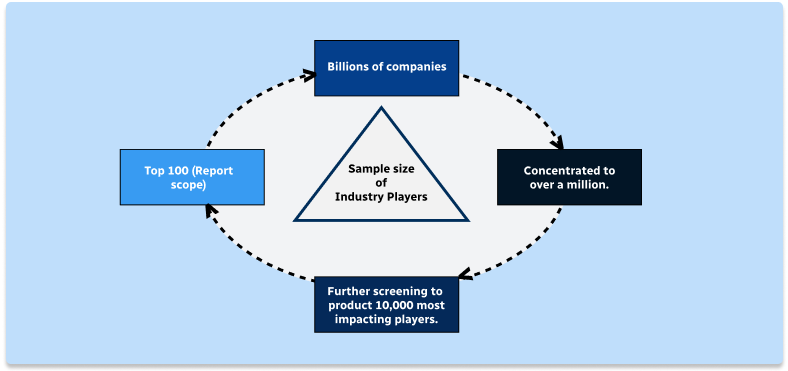
Step 1 - Identification of Relevant Samples Size from Population Database
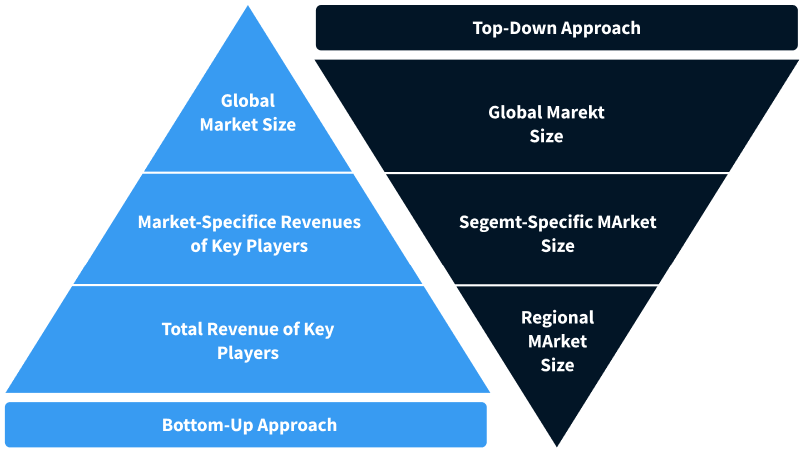
Step 2 - Approaches for Defining Global Market Size (Value, Volume* & Price*)
Note*: In applicable scenarios
Step 3 - Data Sources
Primary Research
- Web Analytics
- Survey Reports
- Research Institute
- Latest Research Reports
- Opinion Leaders
Secondary Research
- Annual Reports
- White Paper
- Latest Press Release
- Industry Association
- Paid Database
- Investor Presentations
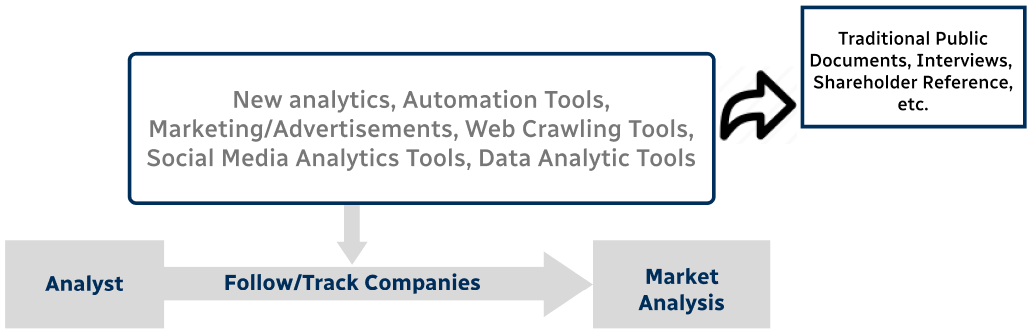
Step 4 - Data Triangulation
Involves using different sources of information in order to increase the validity of a study
These sources are likely to be stakeholders in a program - participants, other researchers, program staff, other community members, and so on.
Then we put all data in single framework & apply various statistical tools to find out the dynamic on the market.
During the analysis stage, feedback from the stakeholder groups would be compared to determine areas of agreement as well as areas of divergence