

Key Insights
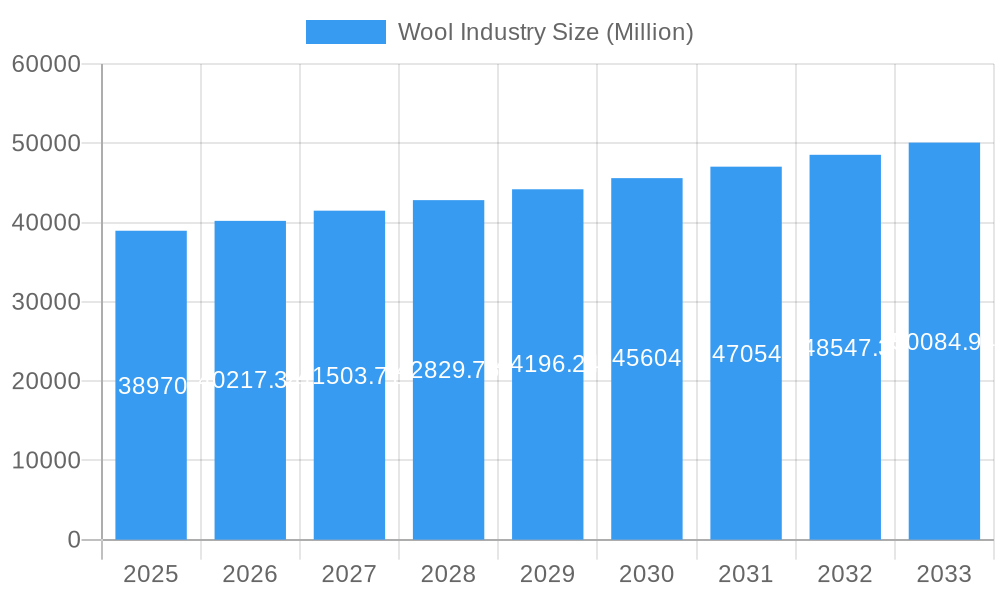
The global wool industry, valued at $38.97 billion in 2025, is projected to experience steady growth, with a compound annual growth rate (CAGR) of 3.20% from 2025 to 2033. This growth is driven by several key factors. Firstly, the increasing demand for sustainable and eco-friendly materials is boosting the popularity of wool, particularly in the apparel and home furnishings sectors. Wool's inherent properties, such as breathability, moisture-wicking capabilities, and natural insulation, make it a desirable choice for consumers seeking high-quality, durable products. Furthermore, innovation in wool processing and textile technology is leading to the development of new wool blends and fabrics with enhanced performance characteristics, expanding its applications in diverse industries, including industrial textiles. The rise of fast fashion, while presenting challenges, also inadvertently highlights the longevity and superior quality of wool compared to synthetic alternatives, further fueling its demand. However, competition from cheaper synthetic fibers and fluctuating wool prices due to climate change and variations in sheep production remain significant restraints.
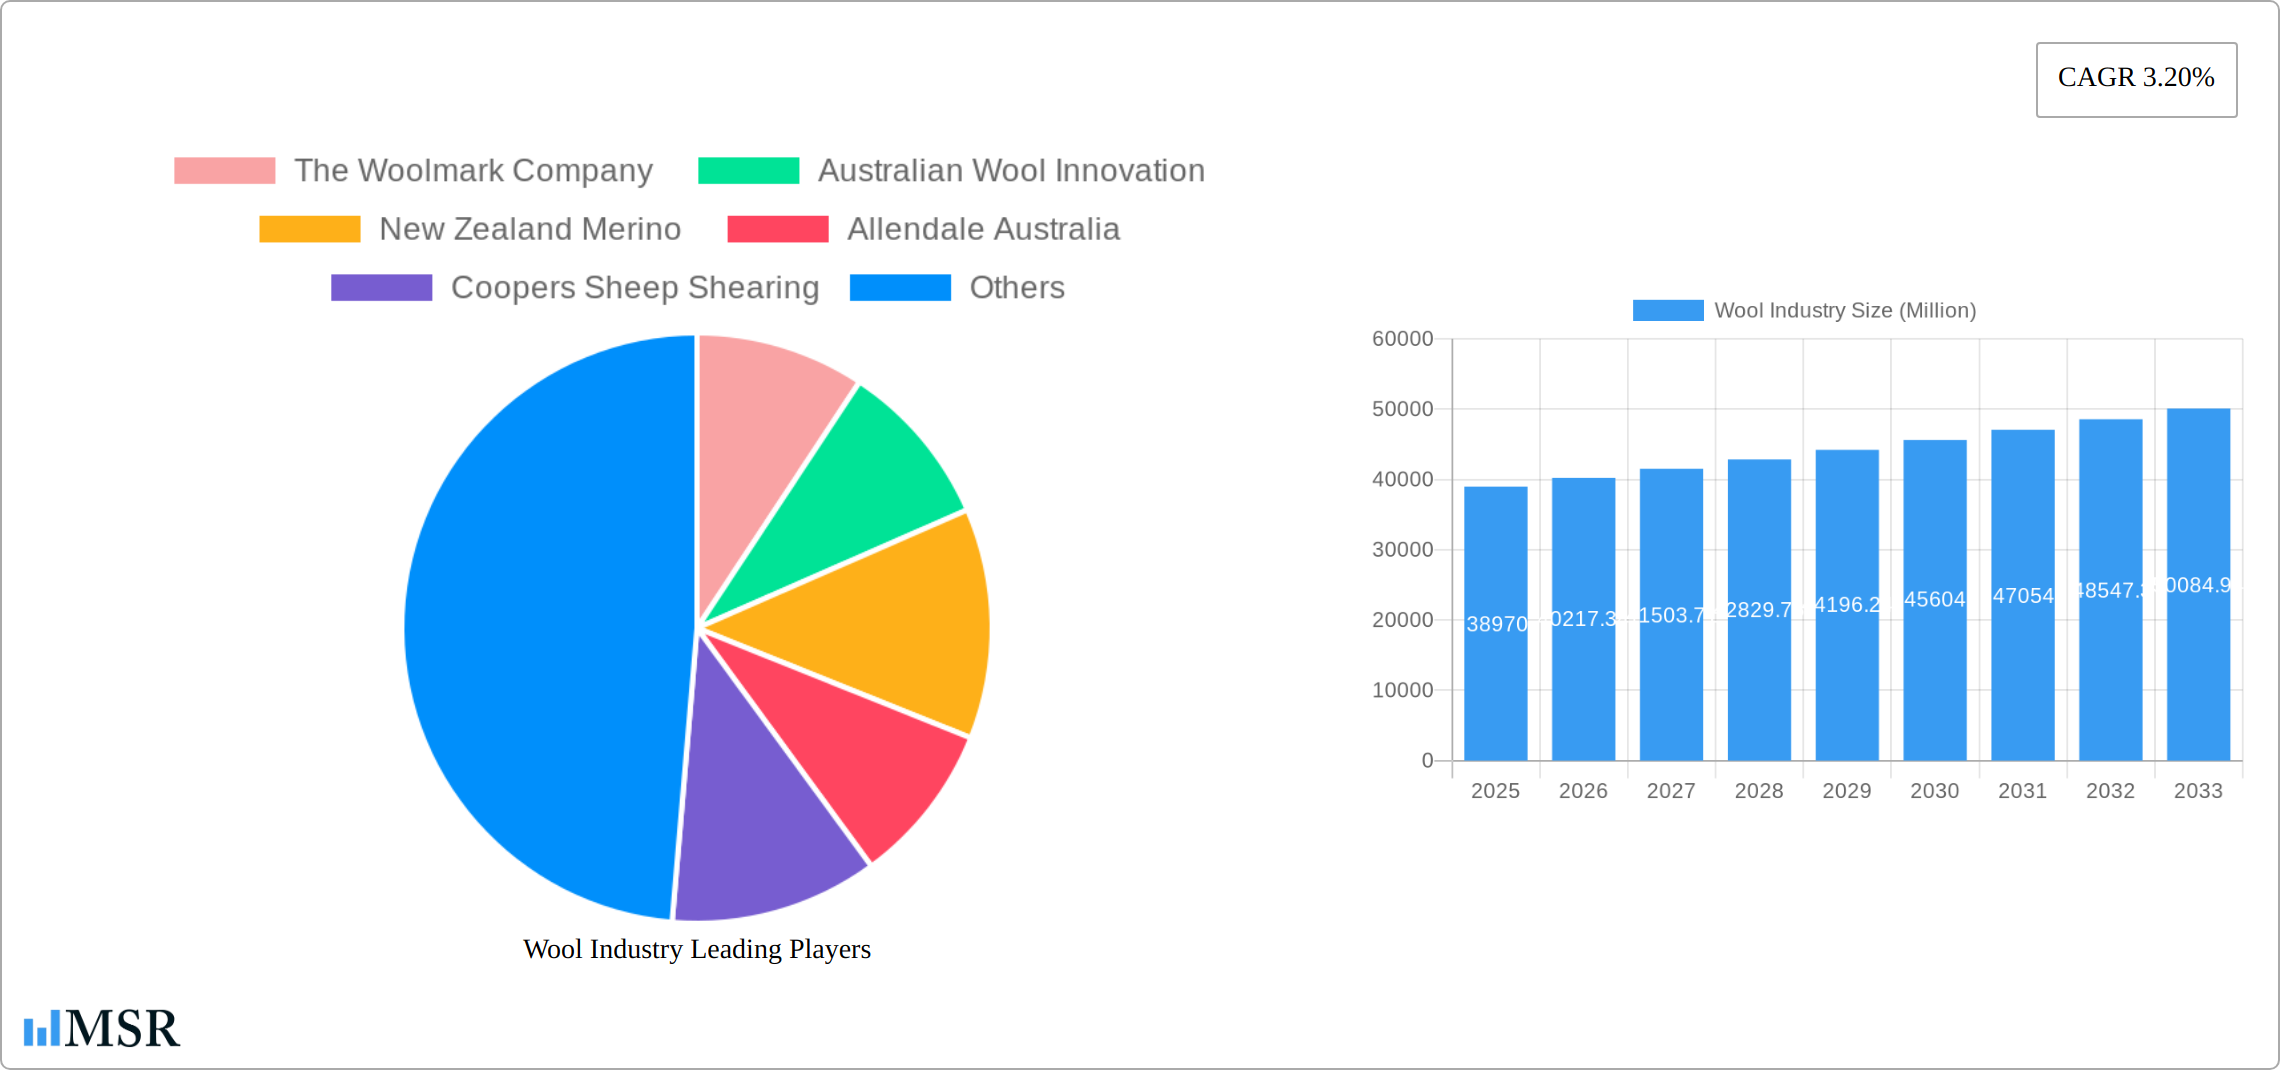
Wool Industry Market Size (In Billion)
Regional market analysis reveals a strong presence in North America and Europe, owing to established textile industries and a high per capita consumption of wool products. Asia-Pacific, specifically China and India, are emerging as significant growth markets, driven by rising disposable incomes and increasing demand for premium apparel and home textiles. South America and the Middle East and Africa also contribute to the overall market, although their shares may be smaller. The industry's segmentation by product type (knitwear yarn, woven fabrics) and end-use industry (textile and apparel, home furnishings, industrial) underscores the versatility of wool and its potential for future expansion into new niche markets. The prominent players – The Woolmark Company, Australian Wool Innovation, New Zealand Merino, and others – play a crucial role in promoting and standardizing wool quality and driving innovation. Continued investment in research and development, along with sustainable farming practices, will be key to ensuring the long-term success and sustainability of the wool industry.
Wool Industry Company Market Share
Unlocking the Future of Wool: A Comprehensive Market Report (2019-2033)
This comprehensive report provides an in-depth analysis of the global wool industry, projecting a market valued at $XX Million by 2033. It offers critical insights into market dynamics, key players, emerging trends, and strategic opportunities for stakeholders across the value chain. The study period covers 2019-2033, with 2025 as the base and estimated year. The forecast period spans 2025-2033, and the historical period encompasses 2019-2024. This report is essential reading for industry leaders, investors, and anyone seeking to understand the evolving landscape of the wool market.
Wool Industry Market Concentration & Dynamics
The global wool market, while subject to evolving dynamics, demonstrates a moderate level of market concentration. Leading organizations such as The Woolmark Company, Australian Wool Innovation, and New Zealand Merino continue to be significant influencers, collectively holding a substantial portion of the market share. Projections for 2025 estimate their combined market share to be approximately **[Insert Percentage]%**, with individual contributions from each entity being **[Insert Percentage]%**, **[Insert Percentage]%**, and **[Insert Percentage]%** respectively. The industry's trajectory is heavily shaped by continuous innovation, particularly in the advancement of wool processing technologies and the implementation of increasingly stringent sustainable farming practices. Regulatory frameworks, encompassing both animal welfare and environmental sustainability, are instrumental in defining market operations and future strategies. A persistent competitive challenge arises from substitute products, notably synthetic fibers, which compels a relentless focus on product innovation and the development of value-added wool offerings. Evolving consumer sentiment, with a pronounced preference for sustainable and ethically sourced materials, directly influences demand patterns. While mergers and acquisitions (M&A) activity within the wool industry has been relatively subdued in recent years, with an estimated **[Insert Number]** deals recorded between 2019 and 2024, a trend towards consolidation within specific market segments is anticipated in the upcoming forecast period. This strategic consolidation is largely driven by the imperative to achieve economies of scale and foster enhanced integration across the entire value chain.
Wool Industry Industry Insights & Trends
The global wool market is poised for growth, driven by a projected Compound Annual Growth Rate (CAGR) of xx% during the forecast period (2025-2033). Market size is expected to reach $XX Million by 2033, up from $XX Million in 2025. This growth is fueled by several key factors: the increasing popularity of natural and sustainable materials among environmentally conscious consumers, the versatility of wool in various applications (from apparel to home furnishings), and advancements in wool processing technologies that enhance performance and functionality. Technological advancements are also transforming the industry, improving shearing techniques (like those employed by Coopers Sheep Shearing) and increasing efficiency in yarn production and fabric manufacturing. Consumer behavior is shifting toward a preference for high-quality, ethically sourced wool products, a trend that presents significant opportunities for companies committed to sustainability and transparency.
Key Markets & Segments Leading Wool Industry
- Dominant Region: [Insert dominant region, e.g., Europe/Asia-Pacific] accounts for the largest market share, driven by strong economic growth, well-established textile industries, and high consumer spending on apparel and home furnishings.
- Dominant Country: [Insert dominant country, e.g., China/Australia] is a key market due to [specific reasons, e.g., large population, robust domestic manufacturing sector].
- Dominant Product Type: Knitwear yarn currently holds the largest market share due to its widespread use in fashion and the increasing demand for comfort and warmth.
- Dominant End-Use Industry: The Textile and Apparel industry is the largest consumer of wool, driven by the versatile nature of the fiber and increasing consumer demand. The Home Furnishings sector is also exhibiting strong growth.
The dominance of these regions, countries, and segments stems from factors such as favorable economic conditions, established infrastructure, and a strong manufacturing base. However, emerging markets in [mention emerging markets] are also showing significant potential, driven by rising disposable incomes and increased awareness of the benefits of wool.
Wool Industry Product Developments
Recent years have been marked by significant advancements in both wool processing and the subsequent product developments. These innovations encompass improvements in spinning technologies, enabling the creation of exceptionally fine yarns, and the successful development of advanced treatments that impart water and stain resistance to wool fabrics. Furthermore, the industry is actively exploring and creating novel fiber blends that integrate wool with other materials to elevate overall performance characteristics. A core strategic focus for companies is the development of innovative and inherently sustainable products, a direct response to shifting consumer preferences and the need for market differentiation in a competitive landscape. This includes a growing emphasis on the utilization of recycled wool fibers and the unwavering commitment to responsible sourcing initiatives throughout the supply chain.
Challenges in the Wool Industry Market
The wool industry is confronted by a multifaceted array of challenges that impact its operational efficiency and profitability. These include the inherent volatility of raw material prices, the persistent and robust competition emanating from synthetic fiber alternatives, and the complex regulatory landscape governing animal welfare and environmental sustainability. Disruptions within the global supply chain can significantly affect production schedules and overall profitability. Moreover, the seasonal nature of wool production, coupled with fluctuating consumer demand patterns, contributes to considerable market volatility. Collectively, these factors present a significant hurdle for the industry in consistently meeting market demand and sustaining robust profitability.
Forces Driving Wool Industry Growth
The growth of the wool industry is propelled by several key drivers. A primary catalyst is the escalating consumer demand for products that are both sustainable and ethically sourced, reflecting a broader societal shift towards conscious consumption. Technological advancements in wool processing and product development are also playing a crucial role in enhancing product quality and opening new market avenues. Furthermore, supportive government policies aimed at promoting the wool industry contribute to its expansion. The rise in disposable incomes across developing economies, coupled with the increasing popularity of natural fibers across a diverse range of end-use industries, further fuels this growth. The emergence of strategic collaborations and partnerships is also instrumental in optimizing the efficiency and sustainability of the entire wool value chain.
Long-Term Growth Catalysts
Long-term growth is fueled by continued investment in research and development, leading to innovative products and processing techniques. Strategic alliances between wool producers, processors, and brands foster collaboration and shared growth. Expansion into new markets and product applications will further enhance market reach and diversify revenue streams, particularly within the sustainable and high-performance apparel segments.
Emerging Opportunities in Wool Industry
Emerging opportunities lie in the development of high-performance wool fabrics for specialized applications, such as sportswear and technical textiles. Growing demand for sustainable and traceable wool products presents a significant opportunity for brands committed to ethical sourcing and transparency. Furthermore, exploring new markets in rapidly developing economies holds significant potential for future growth.
Leading Players in the Wool Industry Sector
- The Woolmark Company
- Australian Wool Innovation
- New Zealand Merino
- Allendale Australia
- Coopers Sheep Shearing
Key Milestones in Wool Industry Industry
- 2020: Launch of a pioneering sustainable wool certification program by [Company Name], setting new benchmarks for responsible sourcing.
- 2022: Successful culmination of a significant research and development project by [Company Name], yielding substantial improvements in wool processing efficiency and reduced environmental impact.
- 2023: A transformative merger between two prominent wool producers, creating a more consolidated entity with enhanced market share and significant economies of scale, poised for greater industry influence.
Strategic Outlook for Wool Industry Market
The wool industry is poised for sustained growth, driven by a confluence of factors, including evolving consumer preferences, technological advancements, and strategic partnerships across the value chain. Companies that effectively address sustainability concerns, invest in innovation, and build strong brands are well-positioned to capture significant market share in the years to come. Further expansion into high-growth markets and diversification into new product applications will be key to maximizing future potential.
Wool Industry Segmentation
- 1. Production Analysis
- 2. Consumption Analysis
- 3. Import Market Analysis (Value & Volume)
- 4. Export Market Analysis (Value & Volume)
- 5. Price Trend Analysis
Wool Industry Segmentation By Geography
-
1. North America
- 1.1. United States
- 1.2. Mexico
-
2. Europe
- 2.1. Germany
- 2.2. Belgium
- 2.3. United Kingdom
- 2.4. Italy
- 2.5. Netherlands
- 2.6. Turkey
-
3. Asia Pacific
- 3.1. China
- 3.2. India
- 3.3. Japan
- 3.4. Australia
- 3.5. New Zealand
-
4. South America
- 4.1. Brazil
- 4.2. Argentina
-
5. Middle East and Africa
- 5.1. UAE
- 5.2. Saudi Arabia
- 5.3. Oman
- 5.4. Morocco
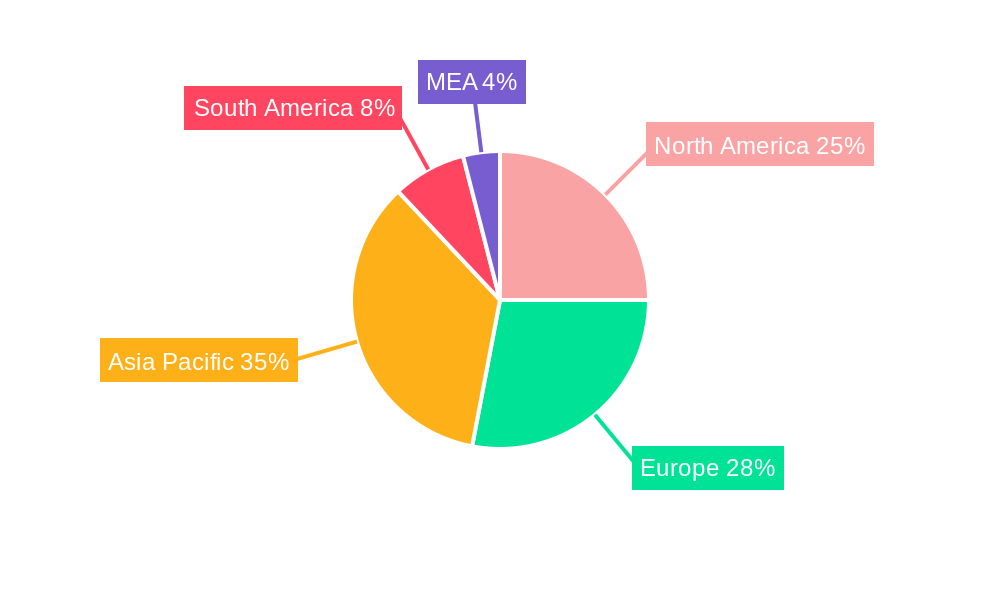
Wool Industry Regional Market Share
Geographic Coverage of Wool Industry
Wool Industry REPORT HIGHLIGHTS
| Aspects | Details |
|---|---|
| Study Period | 2020-2034 |
| Base Year | 2025 |
| Estimated Year | 2026 |
| Forecast Period | 2026-2034 |
| Historical Period | 2020-2025 |
| Growth Rate | CAGR of 3.20% from 2020-2034 |
| Segmentation |
|
Table of Contents
- 1. Introduction
- 1.1. Research Scope
- 1.2. Market Segmentation
- 1.3. Research Objective
- 1.4. Definitions and Assumptions
- 2. Executive Summary
- 2.1. Market Snapshot
- 3. Market Dynamics
- 3.1. Market Drivers
- 3.2. Market Restrains
- 3.3. Market Trends
- 3.4. Market Opportunities
- 4. Market Factor Analysis
- 4.1. Porters Five Forces
- 4.1.1. Bargaining Power of Suppliers
- 4.1.2. Bargaining Power of Buyers
- 4.1.3. Threat of New Entrants
- 4.1.4. Threat of Substitutes
- 4.1.5. Competitive Rivalry
- 4.2. PESTEL analysis
- 4.3. BCG Analysis
- 4.3.1. Stars (High Growth, High Market Share)
- 4.3.2. Cash Cows (Low Growth, High Market Share)
- 4.3.3. Question Mark (High Growth, Low Market Share)
- 4.3.4. Dogs (Low Growth, Low Market Share)
- 4.4. Ansoff Matrix Analysis
- 4.5. Supply Chain Analysis
- 4.6. Regulatory Landscape
- 4.7. Current Market Potential and Opportunity Assessment (TAM–SAM–SOM Framework)
- 4.8. MSR Analyst Note
- 4.1. Porters Five Forces
- 5. Market Analysis, Insights and Forecast 2021-2033
- 5.1. Market Analysis, Insights and Forecast - by Production Analysis
- 5.2. Market Analysis, Insights and Forecast - by Consumption Analysis
- 5.3. Market Analysis, Insights and Forecast - by Import Market Analysis (Value & Volume)
- 5.4. Market Analysis, Insights and Forecast - by Export Market Analysis (Value & Volume)
- 5.5. Market Analysis, Insights and Forecast - by Price Trend Analysis
- 5.6. Market Analysis, Insights and Forecast - by Region
- 5.6.1. North America
- 5.6.2. Europe
- 5.6.3. Asia Pacific
- 5.6.4. South America
- 5.6.5. Middle East and Africa
- 6. Global Wool Industry Analysis, Insights and Forecast, 2021-2033
- 6.1. Market Analysis, Insights and Forecast - by Production Analysis
- 6.2. Market Analysis, Insights and Forecast - by Consumption Analysis
- 6.3. Market Analysis, Insights and Forecast - by Import Market Analysis (Value & Volume)
- 6.4. Market Analysis, Insights and Forecast - by Export Market Analysis (Value & Volume)
- 6.5. Market Analysis, Insights and Forecast - by Price Trend Analysis
- 7. North America Wool Industry Analysis, Insights and Forecast, 2020-2032
- 7.1. Market Analysis, Insights and Forecast - by Production Analysis
- 7.2. Market Analysis, Insights and Forecast - by Consumption Analysis
- 7.3. Market Analysis, Insights and Forecast - by Import Market Analysis (Value & Volume)
- 7.4. Market Analysis, Insights and Forecast - by Export Market Analysis (Value & Volume)
- 7.5. Market Analysis, Insights and Forecast - by Price Trend Analysis
- 8. Europe Wool Industry Analysis, Insights and Forecast, 2020-2032
- 8.1. Market Analysis, Insights and Forecast - by Production Analysis
- 8.2. Market Analysis, Insights and Forecast - by Consumption Analysis
- 8.3. Market Analysis, Insights and Forecast - by Import Market Analysis (Value & Volume)
- 8.4. Market Analysis, Insights and Forecast - by Export Market Analysis (Value & Volume)
- 8.5. Market Analysis, Insights and Forecast - by Price Trend Analysis
- 9. Asia Pacific Wool Industry Analysis, Insights and Forecast, 2020-2032
- 9.1. Market Analysis, Insights and Forecast - by Production Analysis
- 9.2. Market Analysis, Insights and Forecast - by Consumption Analysis
- 9.3. Market Analysis, Insights and Forecast - by Import Market Analysis (Value & Volume)
- 9.4. Market Analysis, Insights and Forecast - by Export Market Analysis (Value & Volume)
- 9.5. Market Analysis, Insights and Forecast - by Price Trend Analysis
- 10. South America Wool Industry Analysis, Insights and Forecast, 2020-2032
- 10.1. Market Analysis, Insights and Forecast - by Production Analysis
- 10.2. Market Analysis, Insights and Forecast - by Consumption Analysis
- 10.3. Market Analysis, Insights and Forecast - by Import Market Analysis (Value & Volume)
- 10.4. Market Analysis, Insights and Forecast - by Export Market Analysis (Value & Volume)
- 10.5. Market Analysis, Insights and Forecast - by Price Trend Analysis
- 11. Middle East and Africa Wool Industry Analysis, Insights and Forecast, 2020-2032
- 11.1. Market Analysis, Insights and Forecast - by Production Analysis
- 11.2. Market Analysis, Insights and Forecast - by Consumption Analysis
- 11.3. Market Analysis, Insights and Forecast - by Import Market Analysis (Value & Volume)
- 11.4. Market Analysis, Insights and Forecast - by Export Market Analysis (Value & Volume)
- 11.5. Market Analysis, Insights and Forecast - by Price Trend Analysis
- 12. Competitive Analysis
- 12.1. Company Profiles
- 12.1.1 The Woolmark Company
- 12.1.1.1. Company Overview
- 12.1.1.2. Products
- 12.1.1.3. Company Financials
- 12.1.1.4. SWOT Analysis
- 12.1.2 Australian Wool Innovation
- 12.1.2.1. Company Overview
- 12.1.2.2. Products
- 12.1.2.3. Company Financials
- 12.1.2.4. SWOT Analysis
- 12.1.3 New Zealand Merino
- 12.1.3.1. Company Overview
- 12.1.3.2. Products
- 12.1.3.3. Company Financials
- 12.1.3.4. SWOT Analysis
- 12.1.4 Allendale Australia
- 12.1.4.1. Company Overview
- 12.1.4.2. Products
- 12.1.4.3. Company Financials
- 12.1.4.4. SWOT Analysis
- 12.1.5 Coopers Sheep Shearing
- 12.1.5.1. Company Overview
- 12.1.5.2. Products
- 12.1.5.3. Company Financials
- 12.1.5.4. SWOT Analysis
- 12.1.1 The Woolmark Company
- 12.2. Market Entropy
- 12.2.1 Company's Key Areas Served
- 12.2.2 Recent Developments
- 12.3. Company Market Share Analysis 2025
- 12.3.1 Top 5 Companies Market Share Analysis
- 12.3.2 Top 3 Companies Market Share Analysis
- 12.4. List of Potential Customers
- 13. Research Methodology
List of Figures
- Figure 1: Global Wool Industry Revenue Breakdown (Million, %) by Region 2025 & 2033
- Figure 2: North America Wool Industry Revenue (Million), by Production Analysis 2025 & 2033
- Figure 3: North America Wool Industry Revenue Share (%), by Production Analysis 2025 & 2033
- Figure 4: North America Wool Industry Revenue (Million), by Consumption Analysis 2025 & 2033
- Figure 5: North America Wool Industry Revenue Share (%), by Consumption Analysis 2025 & 2033
- Figure 6: North America Wool Industry Revenue (Million), by Import Market Analysis (Value & Volume) 2025 & 2033
- Figure 7: North America Wool Industry Revenue Share (%), by Import Market Analysis (Value & Volume) 2025 & 2033
- Figure 8: North America Wool Industry Revenue (Million), by Export Market Analysis (Value & Volume) 2025 & 2033
- Figure 9: North America Wool Industry Revenue Share (%), by Export Market Analysis (Value & Volume) 2025 & 2033
- Figure 10: North America Wool Industry Revenue (Million), by Price Trend Analysis 2025 & 2033
- Figure 11: North America Wool Industry Revenue Share (%), by Price Trend Analysis 2025 & 2033
- Figure 12: North America Wool Industry Revenue (Million), by Country 2025 & 2033
- Figure 13: North America Wool Industry Revenue Share (%), by Country 2025 & 2033
- Figure 14: Europe Wool Industry Revenue (Million), by Production Analysis 2025 & 2033
- Figure 15: Europe Wool Industry Revenue Share (%), by Production Analysis 2025 & 2033
- Figure 16: Europe Wool Industry Revenue (Million), by Consumption Analysis 2025 & 2033
- Figure 17: Europe Wool Industry Revenue Share (%), by Consumption Analysis 2025 & 2033
- Figure 18: Europe Wool Industry Revenue (Million), by Import Market Analysis (Value & Volume) 2025 & 2033
- Figure 19: Europe Wool Industry Revenue Share (%), by Import Market Analysis (Value & Volume) 2025 & 2033
- Figure 20: Europe Wool Industry Revenue (Million), by Export Market Analysis (Value & Volume) 2025 & 2033
- Figure 21: Europe Wool Industry Revenue Share (%), by Export Market Analysis (Value & Volume) 2025 & 2033
- Figure 22: Europe Wool Industry Revenue (Million), by Price Trend Analysis 2025 & 2033
- Figure 23: Europe Wool Industry Revenue Share (%), by Price Trend Analysis 2025 & 2033
- Figure 24: Europe Wool Industry Revenue (Million), by Country 2025 & 2033
- Figure 25: Europe Wool Industry Revenue Share (%), by Country 2025 & 2033
- Figure 26: Asia Pacific Wool Industry Revenue (Million), by Production Analysis 2025 & 2033
- Figure 27: Asia Pacific Wool Industry Revenue Share (%), by Production Analysis 2025 & 2033
- Figure 28: Asia Pacific Wool Industry Revenue (Million), by Consumption Analysis 2025 & 2033
- Figure 29: Asia Pacific Wool Industry Revenue Share (%), by Consumption Analysis 2025 & 2033
- Figure 30: Asia Pacific Wool Industry Revenue (Million), by Import Market Analysis (Value & Volume) 2025 & 2033
- Figure 31: Asia Pacific Wool Industry Revenue Share (%), by Import Market Analysis (Value & Volume) 2025 & 2033
- Figure 32: Asia Pacific Wool Industry Revenue (Million), by Export Market Analysis (Value & Volume) 2025 & 2033
- Figure 33: Asia Pacific Wool Industry Revenue Share (%), by Export Market Analysis (Value & Volume) 2025 & 2033
- Figure 34: Asia Pacific Wool Industry Revenue (Million), by Price Trend Analysis 2025 & 2033
- Figure 35: Asia Pacific Wool Industry Revenue Share (%), by Price Trend Analysis 2025 & 2033
- Figure 36: Asia Pacific Wool Industry Revenue (Million), by Country 2025 & 2033
- Figure 37: Asia Pacific Wool Industry Revenue Share (%), by Country 2025 & 2033
- Figure 38: South America Wool Industry Revenue (Million), by Production Analysis 2025 & 2033
- Figure 39: South America Wool Industry Revenue Share (%), by Production Analysis 2025 & 2033
- Figure 40: South America Wool Industry Revenue (Million), by Consumption Analysis 2025 & 2033
- Figure 41: South America Wool Industry Revenue Share (%), by Consumption Analysis 2025 & 2033
- Figure 42: South America Wool Industry Revenue (Million), by Import Market Analysis (Value & Volume) 2025 & 2033
- Figure 43: South America Wool Industry Revenue Share (%), by Import Market Analysis (Value & Volume) 2025 & 2033
- Figure 44: South America Wool Industry Revenue (Million), by Export Market Analysis (Value & Volume) 2025 & 2033
- Figure 45: South America Wool Industry Revenue Share (%), by Export Market Analysis (Value & Volume) 2025 & 2033
- Figure 46: South America Wool Industry Revenue (Million), by Price Trend Analysis 2025 & 2033
- Figure 47: South America Wool Industry Revenue Share (%), by Price Trend Analysis 2025 & 2033
- Figure 48: South America Wool Industry Revenue (Million), by Country 2025 & 2033
- Figure 49: South America Wool Industry Revenue Share (%), by Country 2025 & 2033
- Figure 50: Middle East and Africa Wool Industry Revenue (Million), by Production Analysis 2025 & 2033
- Figure 51: Middle East and Africa Wool Industry Revenue Share (%), by Production Analysis 2025 & 2033
- Figure 52: Middle East and Africa Wool Industry Revenue (Million), by Consumption Analysis 2025 & 2033
- Figure 53: Middle East and Africa Wool Industry Revenue Share (%), by Consumption Analysis 2025 & 2033
- Figure 54: Middle East and Africa Wool Industry Revenue (Million), by Import Market Analysis (Value & Volume) 2025 & 2033
- Figure 55: Middle East and Africa Wool Industry Revenue Share (%), by Import Market Analysis (Value & Volume) 2025 & 2033
- Figure 56: Middle East and Africa Wool Industry Revenue (Million), by Export Market Analysis (Value & Volume) 2025 & 2033
- Figure 57: Middle East and Africa Wool Industry Revenue Share (%), by Export Market Analysis (Value & Volume) 2025 & 2033
- Figure 58: Middle East and Africa Wool Industry Revenue (Million), by Price Trend Analysis 2025 & 2033
- Figure 59: Middle East and Africa Wool Industry Revenue Share (%), by Price Trend Analysis 2025 & 2033
- Figure 60: Middle East and Africa Wool Industry Revenue (Million), by Country 2025 & 2033
- Figure 61: Middle East and Africa Wool Industry Revenue Share (%), by Country 2025 & 2033
List of Tables
- Table 1: Global Wool Industry Revenue Million Forecast, by Production Analysis 2020 & 2033
- Table 2: Global Wool Industry Revenue Million Forecast, by Consumption Analysis 2020 & 2033
- Table 3: Global Wool Industry Revenue Million Forecast, by Import Market Analysis (Value & Volume) 2020 & 2033
- Table 4: Global Wool Industry Revenue Million Forecast, by Export Market Analysis (Value & Volume) 2020 & 2033
- Table 5: Global Wool Industry Revenue Million Forecast, by Price Trend Analysis 2020 & 2033
- Table 6: Global Wool Industry Revenue Million Forecast, by Region 2020 & 2033
- Table 7: Global Wool Industry Revenue Million Forecast, by Production Analysis 2020 & 2033
- Table 8: Global Wool Industry Revenue Million Forecast, by Consumption Analysis 2020 & 2033
- Table 9: Global Wool Industry Revenue Million Forecast, by Import Market Analysis (Value & Volume) 2020 & 2033
- Table 10: Global Wool Industry Revenue Million Forecast, by Export Market Analysis (Value & Volume) 2020 & 2033
- Table 11: Global Wool Industry Revenue Million Forecast, by Price Trend Analysis 2020 & 2033
- Table 12: Global Wool Industry Revenue Million Forecast, by Country 2020 & 2033
- Table 13: United States Wool Industry Revenue (Million) Forecast, by Application 2020 & 2033
- Table 14: Mexico Wool Industry Revenue (Million) Forecast, by Application 2020 & 2033
- Table 15: Global Wool Industry Revenue Million Forecast, by Production Analysis 2020 & 2033
- Table 16: Global Wool Industry Revenue Million Forecast, by Consumption Analysis 2020 & 2033
- Table 17: Global Wool Industry Revenue Million Forecast, by Import Market Analysis (Value & Volume) 2020 & 2033
- Table 18: Global Wool Industry Revenue Million Forecast, by Export Market Analysis (Value & Volume) 2020 & 2033
- Table 19: Global Wool Industry Revenue Million Forecast, by Price Trend Analysis 2020 & 2033
- Table 20: Global Wool Industry Revenue Million Forecast, by Country 2020 & 2033
- Table 21: Germany Wool Industry Revenue (Million) Forecast, by Application 2020 & 2033
- Table 22: Belgium Wool Industry Revenue (Million) Forecast, by Application 2020 & 2033
- Table 23: United Kingdom Wool Industry Revenue (Million) Forecast, by Application 2020 & 2033
- Table 24: Italy Wool Industry Revenue (Million) Forecast, by Application 2020 & 2033
- Table 25: Netherlands Wool Industry Revenue (Million) Forecast, by Application 2020 & 2033
- Table 26: Turkey Wool Industry Revenue (Million) Forecast, by Application 2020 & 2033
- Table 27: Global Wool Industry Revenue Million Forecast, by Production Analysis 2020 & 2033
- Table 28: Global Wool Industry Revenue Million Forecast, by Consumption Analysis 2020 & 2033
- Table 29: Global Wool Industry Revenue Million Forecast, by Import Market Analysis (Value & Volume) 2020 & 2033
- Table 30: Global Wool Industry Revenue Million Forecast, by Export Market Analysis (Value & Volume) 2020 & 2033
- Table 31: Global Wool Industry Revenue Million Forecast, by Price Trend Analysis 2020 & 2033
- Table 32: Global Wool Industry Revenue Million Forecast, by Country 2020 & 2033
- Table 33: China Wool Industry Revenue (Million) Forecast, by Application 2020 & 2033
- Table 34: India Wool Industry Revenue (Million) Forecast, by Application 2020 & 2033
- Table 35: Japan Wool Industry Revenue (Million) Forecast, by Application 2020 & 2033
- Table 36: Australia Wool Industry Revenue (Million) Forecast, by Application 2020 & 2033
- Table 37: New Zealand Wool Industry Revenue (Million) Forecast, by Application 2020 & 2033
- Table 38: Global Wool Industry Revenue Million Forecast, by Production Analysis 2020 & 2033
- Table 39: Global Wool Industry Revenue Million Forecast, by Consumption Analysis 2020 & 2033
- Table 40: Global Wool Industry Revenue Million Forecast, by Import Market Analysis (Value & Volume) 2020 & 2033
- Table 41: Global Wool Industry Revenue Million Forecast, by Export Market Analysis (Value & Volume) 2020 & 2033
- Table 42: Global Wool Industry Revenue Million Forecast, by Price Trend Analysis 2020 & 2033
- Table 43: Global Wool Industry Revenue Million Forecast, by Country 2020 & 2033
- Table 44: Brazil Wool Industry Revenue (Million) Forecast, by Application 2020 & 2033
- Table 45: Argentina Wool Industry Revenue (Million) Forecast, by Application 2020 & 2033
- Table 46: Global Wool Industry Revenue Million Forecast, by Production Analysis 2020 & 2033
- Table 47: Global Wool Industry Revenue Million Forecast, by Consumption Analysis 2020 & 2033
- Table 48: Global Wool Industry Revenue Million Forecast, by Import Market Analysis (Value & Volume) 2020 & 2033
- Table 49: Global Wool Industry Revenue Million Forecast, by Export Market Analysis (Value & Volume) 2020 & 2033
- Table 50: Global Wool Industry Revenue Million Forecast, by Price Trend Analysis 2020 & 2033
- Table 51: Global Wool Industry Revenue Million Forecast, by Country 2020 & 2033
- Table 52: UAE Wool Industry Revenue (Million) Forecast, by Application 2020 & 2033
- Table 53: Saudi Arabia Wool Industry Revenue (Million) Forecast, by Application 2020 & 2033
- Table 54: Oman Wool Industry Revenue (Million) Forecast, by Application 2020 & 2033
- Table 55: Morocco Wool Industry Revenue (Million) Forecast, by Application 2020 & 2033
Frequently Asked Questions
1. What is the projected Compound Annual Growth Rate (CAGR) of the Wool Industry?
The projected CAGR is approximately 3.20%.
2. Which companies are prominent players in the Wool Industry?
Key companies in the market include The Woolmark Company , Australian Wool Innovation , New Zealand Merino , Allendale Australia , Coopers Sheep Shearing.
3. What are the main segments of the Wool Industry?
The market segments include Production Analysis, Consumption Analysis, Import Market Analysis (Value & Volume), Export Market Analysis (Value & Volume), Price Trend Analysis.
4. Can you provide details about the market size?
The market size is estimated to be USD 38.97 Million as of 2022.
5. What are some drivers contributing to market growth?
; Awareness About Health Benefits Associated With Pecan Consumption; Wide Application of Pecan.
6. What are the notable trends driving market growth?
Institutional Initiatives Ensuring the Quality is Driving the Production.
7. Are there any restraints impacting market growth?
; Volatility in the Prices; Adverse Weather Conditions Affecting Yield.
8. Can you provide examples of recent developments in the market?
N/A
9. What pricing options are available for accessing the report?
Pricing options include single-user, multi-user, and enterprise licenses priced at USD 4750, USD 5250, and USD 8750 respectively.
10. Is the market size provided in terms of value or volume?
The market size is provided in terms of value, measured in Million.
11. Are there any specific market keywords associated with the report?
Yes, the market keyword associated with the report is "Wool Industry," which aids in identifying and referencing the specific market segment covered.
12. How do I determine which pricing option suits my needs best?
The pricing options vary based on user requirements and access needs. Individual users may opt for single-user licenses, while businesses requiring broader access may choose multi-user or enterprise licenses for cost-effective access to the report.
13. Are there any additional resources or data provided in the Wool Industry report?
While the report offers comprehensive insights, it's advisable to review the specific contents or supplementary materials provided to ascertain if additional resources or data are available.
14. How can I stay updated on further developments or reports in the Wool Industry?
To stay informed about further developments, trends, and reports in the Wool Industry, consider subscribing to industry newsletters, following relevant companies and organizations, or regularly checking reputable industry news sources and publications.
Methodology
Step 1 - Identification of Relevant Samples Size from Population Database


Step 2 - Approaches for Defining Global Market Size (Value, Volume* & Price*)

Note*: In applicable scenarios
Step 3 - Data Sources
Primary Research
- Web Analytics
- Survey Reports
- Research Institute
- Latest Research Reports
- Opinion Leaders
Secondary Research
- Annual Reports
- White Paper
- Latest Press Release
- Industry Association
- Paid Database
- Investor Presentations

Step 4 - Data Triangulation
Involves using different sources of information in order to increase the validity of a study
These sources are likely to be stakeholders in a program - participants, other researchers, program staff, other community members, and so on.
Then we put all data in single framework & apply various statistical tools to find out the dynamic on the market.
During the analysis stage, feedback from the stakeholder groups would be compared to determine areas of agreement as well as areas of divergence