

Key Insights
The global 3-ply face mask market exhibits robust growth, driven by increasing awareness of respiratory health and hygiene, particularly amplified by recent global health crises. While precise market sizing requires proprietary data, a reasonable estimation based on industry reports and publicly available information places the 2025 market value around $5 billion USD. This represents a significant increase from the pre-pandemic levels, reflecting sustained demand beyond initial crisis-driven surges. The Compound Annual Growth Rate (CAGR) is projected at approximately 8% from 2025 to 2033, indicating continued, albeit moderated, growth as the market matures. Key drivers include government regulations mandating mask usage in specific settings, rising disposable incomes in developing economies fueling higher demand, and the increasing prevalence of respiratory illnesses and allergies. Market segmentation reveals significant variations in demand across different regions, with North America and Asia-Pacific expected to dominate market share due to higher population density and robust healthcare infrastructure in certain areas. Leading market players like 3M, Honeywell, and Kimberly-Clark leverage their established distribution networks and manufacturing capabilities to maintain strong market positions. However, emerging players, particularly from Asia, are also gaining ground through cost-competitive offerings and innovative product designs.
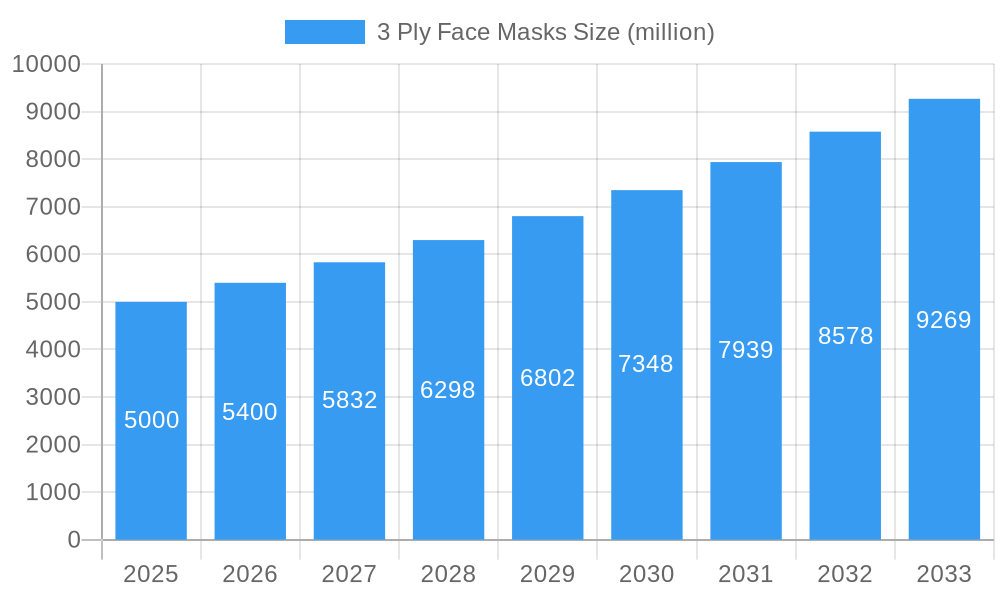
3 Ply Face Masks Market Size (In Billion)
Despite the sustained growth, several restraints exist. These include fluctuating raw material prices (particularly non-woven fabrics), increased competition leading to price pressure, and growing concerns about the environmental impact of single-use masks. Moreover, the market is subject to seasonal variations, with demand peaking during flu seasons and periods of heightened respiratory illness outbreaks. Future market trends point towards a shift towards more sustainable and technologically advanced masks, including those incorporating antimicrobial agents or advanced filtration capabilities. The rise of N95 and KN95 masks, offering superior protection, presents a potential challenge for 3-ply masks; however, 3-ply masks will likely retain significant market share due to their affordability and suitability for everyday use. The ongoing evolution of regulations and public health guidance will continue to shape the future trajectory of this market.
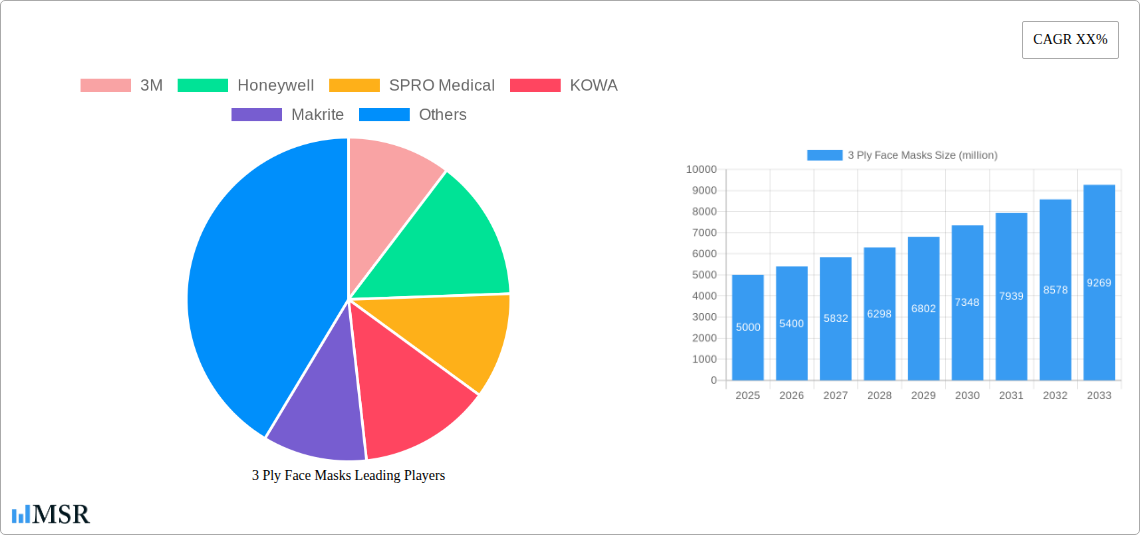
3 Ply Face Masks Company Market Share
3 Ply Face Masks Market Report: 2019-2033
This comprehensive report provides a detailed analysis of the global 3 Ply Face Masks market, offering invaluable insights for industry stakeholders, investors, and businesses involved in the production, distribution, and consumption of these essential protective products. The report covers the period 2019-2033, with a focus on the forecast period 2025-2033, and leverages extensive data analysis to predict market trends and opportunities. The market valuation exceeds $XX million in 2025 and is projected to reach $XX million by 2033, exhibiting a CAGR of XX%. Key players analyzed include 3M, Honeywell, SPRO Medical, KOWA, Makrite, and many more.
3 Ply Face Masks Market Concentration & Dynamics
The 3 Ply Face Masks market exhibits a moderately concentrated landscape, with a few major players holding significant market share. However, the presence of numerous smaller manufacturers and regional players contributes to competitive dynamics. The market is influenced by stringent regulatory frameworks governing product safety and efficacy, particularly in regions like the EU and North America. Substitute products, such as N95 respirators and other advanced face coverings, exist but often cater to different needs or higher risk environments. End-user trends indicate a growing preference for comfortable, breathable, and disposable masks, influencing product development. The historical period (2019-2024) witnessed numerous M&A activities, with an estimated XX million deals, consolidating market share among larger players. This trend is expected to continue, although at a slower pace, in the forecast period.
- Market Share Concentration: Top 5 players hold approximately XX% of the market.
- M&A Activity (2019-2024): Approximately XX million deals, primarily focused on consolidation and expansion.
- Regulatory Landscape: Stringent standards in developed markets drive innovation and product quality.
- Substitute Products: N95 respirators and other specialized masks offer higher protection levels.
- End-User Trends: Growing preference for comfort, disposability, and eco-friendly options.
3 Ply Face Masks Industry Insights & Trends
The global 3 Ply Face Masks market experienced significant growth in recent years, fueled primarily by health crises and evolving public awareness about respiratory protection. The market size exceeded $XX million in 2024, driven by increased demand from healthcare settings, industries with high infection risk, and the general public. Technological disruptions, such as advancements in filter materials and mask design, have played a vital role in enhancing product efficacy and comfort. Evolving consumer behaviors, including increased hygiene consciousness and willingness to pay a premium for quality products, further contribute to market growth. While the initial surge in demand has plateaued, long-term growth remains promising due to continued demand from healthcare and specific industries and evolving public health concerns.
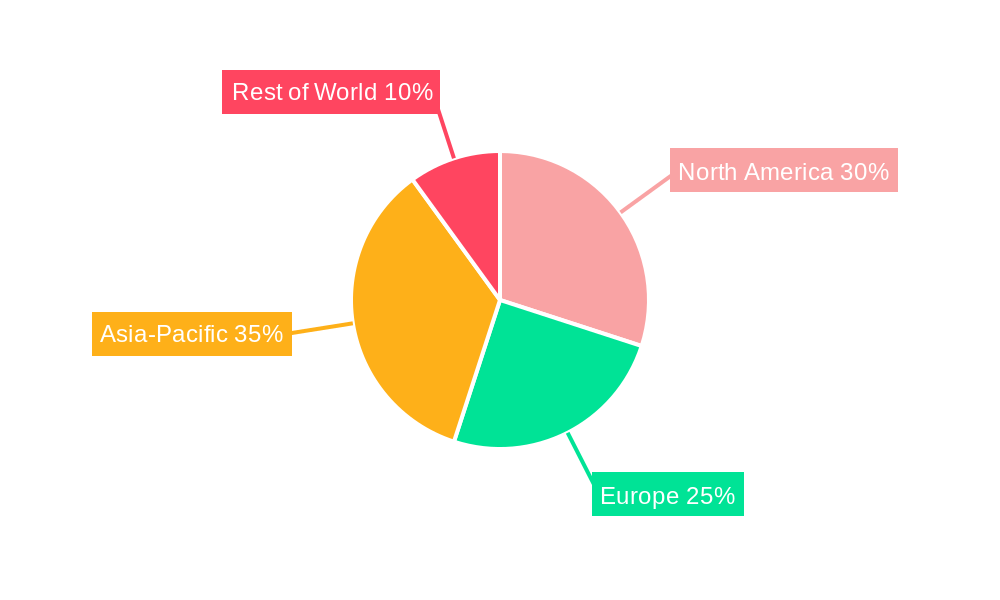
Key Markets & Segments Leading 3 Ply Face Masks
The Asia-Pacific region dominates the global 3 Ply Face Masks market, driven by high population density, growing healthcare infrastructure, and rising disposable incomes. Within this region, countries like China and India are significant contributors due to their massive populations and burgeoning healthcare sectors.
- Drivers for Asia-Pacific Dominance:
- Rapid economic growth and increasing disposable incomes.
- Significant population size and high prevalence of respiratory illnesses.
- Expanding healthcare infrastructure and increasing healthcare expenditure.
- Growing awareness of respiratory health and hygiene.
Detailed analysis reveals the healthcare sector as the leading segment, owing to the crucial role of 3 ply masks in infection control. Other key segments include industrial settings (construction, manufacturing) and personal use. These segments demonstrate significant growth potential, influenced by factors such as stricter workplace safety regulations and increasing consumer awareness of hygiene.
3 Ply Face Masks Product Developments
Recent advancements in 3 ply face mask technology focus on improving breathability, comfort, and filtration efficiency. Innovations include the use of advanced filter media, ergonomic designs, and antimicrobial treatments. These improvements enhance user experience and protection levels, creating competitive advantages for manufacturers. Furthermore, the integration of sustainable and biodegradable materials addresses increasing environmental concerns.
Challenges in the 3 Ply Face Masks Market
The 3 ply face mask market faces challenges including intense competition, supply chain disruptions, and fluctuations in raw material prices. Regulatory hurdles concerning product standards and certifications in different regions also pose significant challenges. Counterfeit products represent another issue, undermining market integrity and consumer trust. These factors impact profitability and market growth, requiring manufacturers to adapt strategically. The overall impact of these challenges on market growth is estimated to be approximately a XX% reduction in the projected growth rate.
Forces Driving 3 Ply Face Masks Growth
The growth of the 3 Ply Face Masks market is driven by several factors, including rising awareness of respiratory health, increasing government regulations promoting workplace safety, and technological innovations enhancing mask performance. The ongoing need for infection control in healthcare and other high-risk settings remains a key growth catalyst. Furthermore, advancements in filter materials and manufacturing processes contribute to improved efficiency and cost-effectiveness.
Challenges in the 3 Ply Face Masks Market
Long-term growth will be fueled by continued innovations in filter technology, partnerships to expand market reach, and expansion into new geographical areas. Focus on sustainability and eco-friendly materials will also be crucial. Strategic collaborations and investments in research and development will be vital to ensure sustained growth in the long term.
Emerging Opportunities in 3 Ply Face Masks
Emerging opportunities include the development of masks with integrated features, such as voice amplification or air filtration sensors. The growing demand for masks with enhanced comfort and breathability for extended use presents significant opportunities. Expansion into new markets, including emerging economies with rising middle classes, presents further growth potential. Personalized and customized mask options cater to individual needs and preferences.
Leading Players in the 3 Ply Face Masks Sector
- 3M
- Honeywell
- SPRO Medical
- KOWA
- Makrite
- Owens & Minor
- UVEX
- Kimberly-Clark
- McKesson
- Prestige Ameritech
- CM
- Winner
- Molnlycke Health
- Moldex-Metric
- Ansell
- Unicharm
- Cardinal Health
- Te Yin
- Japan Vilene
- Shanghai Dasheng
- Hakugen
- Essity (BSN Medical)
- Zhende
- Jiangyin Chang-hung
- Tamagawa Eizai
- Gerson
- Suzhou Sanical
- Sinotextiles
- Alpha Pro Tech
- Irema
- DACH
- Yuanqin
- Troge Medical
Key Milestones in 3 Ply Face Masks Industry
- 2020 Q1: Significant surge in demand due to the COVID-19 pandemic.
- 2020 Q2: Increased production capacity and global supply chain adjustments.
- 2021 Q3: Focus on developing more comfortable and sustainable masks.
- 2022 Q4: Industry consolidation through mergers and acquisitions.
- 2023: Increased focus on regulatory compliance and product safety.
Strategic Outlook for 3 Ply Face Masks Market
The future of the 3 ply face mask market is promising, driven by long-term trends in public health, industrial safety, and technological advancements. Strategic opportunities lie in developing innovative products, expanding into new markets, and fostering strategic partnerships. Focus on sustainability and efficient manufacturing processes will be crucial for long-term success. The market is poised for continued growth, albeit at a more moderate pace than the initial surge experienced during the pandemic.
3 Ply Face Masks Segmentation
-
1. Application
- 1.1. Individual
- 1.2. Hospital & Clinic
- 1.3. Industrial
-
2. Types
- 2.1. Earloop Face Mask
- 2.2. Lace Face Mask
3 Ply Face Masks Segmentation By Geography
-
1. North America
- 1.1. United States
- 1.2. Canada
- 1.3. Mexico
-
2. South America
- 2.1. Brazil
- 2.2. Argentina
- 2.3. Rest of South America
-
3. Europe
- 3.1. United Kingdom
- 3.2. Germany
- 3.3. France
- 3.4. Italy
- 3.5. Spain
- 3.6. Russia
- 3.7. Benelux
- 3.8. Nordics
- 3.9. Rest of Europe
-
4. Middle East & Africa
- 4.1. Turkey
- 4.2. Israel
- 4.3. GCC
- 4.4. North Africa
- 4.5. South Africa
- 4.6. Rest of Middle East & Africa
-
5. Asia Pacific
- 5.1. China
- 5.2. India
- 5.3. Japan
- 5.4. South Korea
- 5.5. ASEAN
- 5.6. Oceania
- 5.7. Rest of Asia Pacific
3 Ply Face Masks Regional Market Share
Geographic Coverage of 3 Ply Face Masks
3 Ply Face Masks REPORT HIGHLIGHTS
| Aspects | Details |
|---|---|
| Study Period | 2020-2034 |
| Base Year | 2025 |
| Estimated Year | 2026 |
| Forecast Period | 2026-2034 |
| Historical Period | 2020-2025 |
| Growth Rate | CAGR of XX% from 2020-2034 |
| Segmentation |
|
Table of Contents
- 1. Introduction
- 1.1. Research Scope
- 1.2. Market Segmentation
- 1.3. Research Objective
- 1.4. Definitions and Assumptions
- 2. Executive Summary
- 2.1. Market Snapshot
- 3. Market Dynamics
- 3.1. Market Drivers
- 3.2. Market Restrains
- 3.3. Market Trends
- 3.4. Market Opportunities
- 4. Market Factor Analysis
- 4.1. Porters Five Forces
- 4.1.1. Bargaining Power of Suppliers
- 4.1.2. Bargaining Power of Buyers
- 4.1.3. Threat of New Entrants
- 4.1.4. Threat of Substitutes
- 4.1.5. Competitive Rivalry
- 4.2. PESTEL analysis
- 4.3. BCG Analysis
- 4.3.1. Stars (High Growth, High Market Share)
- 4.3.2. Cash Cows (Low Growth, High Market Share)
- 4.3.3. Question Mark (High Growth, Low Market Share)
- 4.3.4. Dogs (Low Growth, Low Market Share)
- 4.4. Ansoff Matrix Analysis
- 4.5. Supply Chain Analysis
- 4.6. Regulatory Landscape
- 4.7. Current Market Potential and Opportunity Assessment (TAM–SAM–SOM Framework)
- 4.8. MSR Analyst Note
- 4.1. Porters Five Forces
- 5. Market Analysis, Insights and Forecast 2021-2033
- 5.1. Market Analysis, Insights and Forecast - by Application
- 5.1.1. Individual
- 5.1.2. Hospital & Clinic
- 5.1.3. Industrial
- 5.2. Market Analysis, Insights and Forecast - by Types
- 5.2.1. Earloop Face Mask
- 5.2.2. Lace Face Mask
- 5.3. Market Analysis, Insights and Forecast - by Region
- 5.3.1. North America
- 5.3.2. South America
- 5.3.3. Europe
- 5.3.4. Middle East & Africa
- 5.3.5. Asia Pacific
- 5.1. Market Analysis, Insights and Forecast - by Application
- 6. Global 3 Ply Face Masks Analysis, Insights and Forecast, 2021-2033
- 6.1. Market Analysis, Insights and Forecast - by Application
- 6.1.1. Individual
- 6.1.2. Hospital & Clinic
- 6.1.3. Industrial
- 6.2. Market Analysis, Insights and Forecast - by Types
- 6.2.1. Earloop Face Mask
- 6.2.2. Lace Face Mask
- 6.1. Market Analysis, Insights and Forecast - by Application
- 7. North America 3 Ply Face Masks Analysis, Insights and Forecast, 2020-2032
- 7.1. Market Analysis, Insights and Forecast - by Application
- 7.1.1. Individual
- 7.1.2. Hospital & Clinic
- 7.1.3. Industrial
- 7.2. Market Analysis, Insights and Forecast - by Types
- 7.2.1. Earloop Face Mask
- 7.2.2. Lace Face Mask
- 7.1. Market Analysis, Insights and Forecast - by Application
- 8. South America 3 Ply Face Masks Analysis, Insights and Forecast, 2020-2032
- 8.1. Market Analysis, Insights and Forecast - by Application
- 8.1.1. Individual
- 8.1.2. Hospital & Clinic
- 8.1.3. Industrial
- 8.2. Market Analysis, Insights and Forecast - by Types
- 8.2.1. Earloop Face Mask
- 8.2.2. Lace Face Mask
- 8.1. Market Analysis, Insights and Forecast - by Application
- 9. Europe 3 Ply Face Masks Analysis, Insights and Forecast, 2020-2032
- 9.1. Market Analysis, Insights and Forecast - by Application
- 9.1.1. Individual
- 9.1.2. Hospital & Clinic
- 9.1.3. Industrial
- 9.2. Market Analysis, Insights and Forecast - by Types
- 9.2.1. Earloop Face Mask
- 9.2.2. Lace Face Mask
- 9.1. Market Analysis, Insights and Forecast - by Application
- 10. Middle East & Africa 3 Ply Face Masks Analysis, Insights and Forecast, 2020-2032
- 10.1. Market Analysis, Insights and Forecast - by Application
- 10.1.1. Individual
- 10.1.2. Hospital & Clinic
- 10.1.3. Industrial
- 10.2. Market Analysis, Insights and Forecast - by Types
- 10.2.1. Earloop Face Mask
- 10.2.2. Lace Face Mask
- 10.1. Market Analysis, Insights and Forecast - by Application
- 11. Asia Pacific 3 Ply Face Masks Analysis, Insights and Forecast, 2020-2032
- 11.1. Market Analysis, Insights and Forecast - by Application
- 11.1.1. Individual
- 11.1.2. Hospital & Clinic
- 11.1.3. Industrial
- 11.2. Market Analysis, Insights and Forecast - by Types
- 11.2.1. Earloop Face Mask
- 11.2.2. Lace Face Mask
- 11.1. Market Analysis, Insights and Forecast - by Application
- 12. Competitive Analysis
- 12.1. Company Profiles
- 12.1.1 3M
- 12.1.1.1. Company Overview
- 12.1.1.2. Products
- 12.1.1.3. Company Financials
- 12.1.1.4. SWOT Analysis
- 12.1.2 Honeywell
- 12.1.2.1. Company Overview
- 12.1.2.2. Products
- 12.1.2.3. Company Financials
- 12.1.2.4. SWOT Analysis
- 12.1.3 SPRO Medical
- 12.1.3.1. Company Overview
- 12.1.3.2. Products
- 12.1.3.3. Company Financials
- 12.1.3.4. SWOT Analysis
- 12.1.4 KOWA
- 12.1.4.1. Company Overview
- 12.1.4.2. Products
- 12.1.4.3. Company Financials
- 12.1.4.4. SWOT Analysis
- 12.1.5 Makrite
- 12.1.5.1. Company Overview
- 12.1.5.2. Products
- 12.1.5.3. Company Financials
- 12.1.5.4. SWOT Analysis
- 12.1.6 Owens & Minor
- 12.1.6.1. Company Overview
- 12.1.6.2. Products
- 12.1.6.3. Company Financials
- 12.1.6.4. SWOT Analysis
- 12.1.7 UVEX
- 12.1.7.1. Company Overview
- 12.1.7.2. Products
- 12.1.7.3. Company Financials
- 12.1.7.4. SWOT Analysis
- 12.1.8 Kimberly-clark
- 12.1.8.1. Company Overview
- 12.1.8.2. Products
- 12.1.8.3. Company Financials
- 12.1.8.4. SWOT Analysis
- 12.1.9 McKesson
- 12.1.9.1. Company Overview
- 12.1.9.2. Products
- 12.1.9.3. Company Financials
- 12.1.9.4. SWOT Analysis
- 12.1.10 Prestige Ameritech
- 12.1.10.1. Company Overview
- 12.1.10.2. Products
- 12.1.10.3. Company Financials
- 12.1.10.4. SWOT Analysis
- 12.1.11 CM
- 12.1.11.1. Company Overview
- 12.1.11.2. Products
- 12.1.11.3. Company Financials
- 12.1.11.4. SWOT Analysis
- 12.1.12 Winner
- 12.1.12.1. Company Overview
- 12.1.12.2. Products
- 12.1.12.3. Company Financials
- 12.1.12.4. SWOT Analysis
- 12.1.13 Molnlycke Health
- 12.1.13.1. Company Overview
- 12.1.13.2. Products
- 12.1.13.3. Company Financials
- 12.1.13.4. SWOT Analysis
- 12.1.14 Moldex-Metric
- 12.1.14.1. Company Overview
- 12.1.14.2. Products
- 12.1.14.3. Company Financials
- 12.1.14.4. SWOT Analysis
- 12.1.15 Ansell
- 12.1.15.1. Company Overview
- 12.1.15.2. Products
- 12.1.15.3. Company Financials
- 12.1.15.4. SWOT Analysis
- 12.1.16 Unicharm
- 12.1.16.1. Company Overview
- 12.1.16.2. Products
- 12.1.16.3. Company Financials
- 12.1.16.4. SWOT Analysis
- 12.1.17 Cardinal Health
- 12.1.17.1. Company Overview
- 12.1.17.2. Products
- 12.1.17.3. Company Financials
- 12.1.17.4. SWOT Analysis
- 12.1.18 Te Yin
- 12.1.18.1. Company Overview
- 12.1.18.2. Products
- 12.1.18.3. Company Financials
- 12.1.18.4. SWOT Analysis
- 12.1.19 Japan Vilene
- 12.1.19.1. Company Overview
- 12.1.19.2. Products
- 12.1.19.3. Company Financials
- 12.1.19.4. SWOT Analysis
- 12.1.20 Shanghai Dasheng
- 12.1.20.1. Company Overview
- 12.1.20.2. Products
- 12.1.20.3. Company Financials
- 12.1.20.4. SWOT Analysis
- 12.1.21 Hakugen
- 12.1.21.1. Company Overview
- 12.1.21.2. Products
- 12.1.21.3. Company Financials
- 12.1.21.4. SWOT Analysis
- 12.1.22 Essity (BSN Medical)
- 12.1.22.1. Company Overview
- 12.1.22.2. Products
- 12.1.22.3. Company Financials
- 12.1.22.4. SWOT Analysis
- 12.1.23 Zhende
- 12.1.23.1. Company Overview
- 12.1.23.2. Products
- 12.1.23.3. Company Financials
- 12.1.23.4. SWOT Analysis
- 12.1.24 Jiangyin Chang-hung
- 12.1.24.1. Company Overview
- 12.1.24.2. Products
- 12.1.24.3. Company Financials
- 12.1.24.4. SWOT Analysis
- 12.1.25 Tamagawa Eizai
- 12.1.25.1. Company Overview
- 12.1.25.2. Products
- 12.1.25.3. Company Financials
- 12.1.25.4. SWOT Analysis
- 12.1.26 Gerson
- 12.1.26.1. Company Overview
- 12.1.26.2. Products
- 12.1.26.3. Company Financials
- 12.1.26.4. SWOT Analysis
- 12.1.27 Suzhou Sanical
- 12.1.27.1. Company Overview
- 12.1.27.2. Products
- 12.1.27.3. Company Financials
- 12.1.27.4. SWOT Analysis
- 12.1.28 Sinotextiles
- 12.1.28.1. Company Overview
- 12.1.28.2. Products
- 12.1.28.3. Company Financials
- 12.1.28.4. SWOT Analysis
- 12.1.29 Alpha Pro Tech
- 12.1.29.1. Company Overview
- 12.1.29.2. Products
- 12.1.29.3. Company Financials
- 12.1.29.4. SWOT Analysis
- 12.1.30 Irema
- 12.1.30.1. Company Overview
- 12.1.30.2. Products
- 12.1.30.3. Company Financials
- 12.1.30.4. SWOT Analysis
- 12.1.31 DACH
- 12.1.31.1. Company Overview
- 12.1.31.2. Products
- 12.1.31.3. Company Financials
- 12.1.31.4. SWOT Analysis
- 12.1.32 Yuanqin
- 12.1.32.1. Company Overview
- 12.1.32.2. Products
- 12.1.32.3. Company Financials
- 12.1.32.4. SWOT Analysis
- 12.1.33 Troge Medical
- 12.1.33.1. Company Overview
- 12.1.33.2. Products
- 12.1.33.3. Company Financials
- 12.1.33.4. SWOT Analysis
- 12.1.1 3M
- 12.2. Market Entropy
- 12.2.1 Company's Key Areas Served
- 12.2.2 Recent Developments
- 12.3. Company Market Share Analysis 2025
- 12.3.1 Top 5 Companies Market Share Analysis
- 12.3.2 Top 3 Companies Market Share Analysis
- 12.4. List of Potential Customers
- 13. Research Methodology
List of Figures
- Figure 1: Global 3 Ply Face Masks Revenue Breakdown (million, %) by Region 2025 & 2033
- Figure 2: Global 3 Ply Face Masks Volume Breakdown (K, %) by Region 2025 & 2033
- Figure 3: North America 3 Ply Face Masks Revenue (million), by Application 2025 & 2033
- Figure 4: North America 3 Ply Face Masks Volume (K), by Application 2025 & 2033
- Figure 5: North America 3 Ply Face Masks Revenue Share (%), by Application 2025 & 2033
- Figure 6: North America 3 Ply Face Masks Volume Share (%), by Application 2025 & 2033
- Figure 7: North America 3 Ply Face Masks Revenue (million), by Types 2025 & 2033
- Figure 8: North America 3 Ply Face Masks Volume (K), by Types 2025 & 2033
- Figure 9: North America 3 Ply Face Masks Revenue Share (%), by Types 2025 & 2033
- Figure 10: North America 3 Ply Face Masks Volume Share (%), by Types 2025 & 2033
- Figure 11: North America 3 Ply Face Masks Revenue (million), by Country 2025 & 2033
- Figure 12: North America 3 Ply Face Masks Volume (K), by Country 2025 & 2033
- Figure 13: North America 3 Ply Face Masks Revenue Share (%), by Country 2025 & 2033
- Figure 14: North America 3 Ply Face Masks Volume Share (%), by Country 2025 & 2033
- Figure 15: South America 3 Ply Face Masks Revenue (million), by Application 2025 & 2033
- Figure 16: South America 3 Ply Face Masks Volume (K), by Application 2025 & 2033
- Figure 17: South America 3 Ply Face Masks Revenue Share (%), by Application 2025 & 2033
- Figure 18: South America 3 Ply Face Masks Volume Share (%), by Application 2025 & 2033
- Figure 19: South America 3 Ply Face Masks Revenue (million), by Types 2025 & 2033
- Figure 20: South America 3 Ply Face Masks Volume (K), by Types 2025 & 2033
- Figure 21: South America 3 Ply Face Masks Revenue Share (%), by Types 2025 & 2033
- Figure 22: South America 3 Ply Face Masks Volume Share (%), by Types 2025 & 2033
- Figure 23: South America 3 Ply Face Masks Revenue (million), by Country 2025 & 2033
- Figure 24: South America 3 Ply Face Masks Volume (K), by Country 2025 & 2033
- Figure 25: South America 3 Ply Face Masks Revenue Share (%), by Country 2025 & 2033
- Figure 26: South America 3 Ply Face Masks Volume Share (%), by Country 2025 & 2033
- Figure 27: Europe 3 Ply Face Masks Revenue (million), by Application 2025 & 2033
- Figure 28: Europe 3 Ply Face Masks Volume (K), by Application 2025 & 2033
- Figure 29: Europe 3 Ply Face Masks Revenue Share (%), by Application 2025 & 2033
- Figure 30: Europe 3 Ply Face Masks Volume Share (%), by Application 2025 & 2033
- Figure 31: Europe 3 Ply Face Masks Revenue (million), by Types 2025 & 2033
- Figure 32: Europe 3 Ply Face Masks Volume (K), by Types 2025 & 2033
- Figure 33: Europe 3 Ply Face Masks Revenue Share (%), by Types 2025 & 2033
- Figure 34: Europe 3 Ply Face Masks Volume Share (%), by Types 2025 & 2033
- Figure 35: Europe 3 Ply Face Masks Revenue (million), by Country 2025 & 2033
- Figure 36: Europe 3 Ply Face Masks Volume (K), by Country 2025 & 2033
- Figure 37: Europe 3 Ply Face Masks Revenue Share (%), by Country 2025 & 2033
- Figure 38: Europe 3 Ply Face Masks Volume Share (%), by Country 2025 & 2033
- Figure 39: Middle East & Africa 3 Ply Face Masks Revenue (million), by Application 2025 & 2033
- Figure 40: Middle East & Africa 3 Ply Face Masks Volume (K), by Application 2025 & 2033
- Figure 41: Middle East & Africa 3 Ply Face Masks Revenue Share (%), by Application 2025 & 2033
- Figure 42: Middle East & Africa 3 Ply Face Masks Volume Share (%), by Application 2025 & 2033
- Figure 43: Middle East & Africa 3 Ply Face Masks Revenue (million), by Types 2025 & 2033
- Figure 44: Middle East & Africa 3 Ply Face Masks Volume (K), by Types 2025 & 2033
- Figure 45: Middle East & Africa 3 Ply Face Masks Revenue Share (%), by Types 2025 & 2033
- Figure 46: Middle East & Africa 3 Ply Face Masks Volume Share (%), by Types 2025 & 2033
- Figure 47: Middle East & Africa 3 Ply Face Masks Revenue (million), by Country 2025 & 2033
- Figure 48: Middle East & Africa 3 Ply Face Masks Volume (K), by Country 2025 & 2033
- Figure 49: Middle East & Africa 3 Ply Face Masks Revenue Share (%), by Country 2025 & 2033
- Figure 50: Middle East & Africa 3 Ply Face Masks Volume Share (%), by Country 2025 & 2033
- Figure 51: Asia Pacific 3 Ply Face Masks Revenue (million), by Application 2025 & 2033
- Figure 52: Asia Pacific 3 Ply Face Masks Volume (K), by Application 2025 & 2033
- Figure 53: Asia Pacific 3 Ply Face Masks Revenue Share (%), by Application 2025 & 2033
- Figure 54: Asia Pacific 3 Ply Face Masks Volume Share (%), by Application 2025 & 2033
- Figure 55: Asia Pacific 3 Ply Face Masks Revenue (million), by Types 2025 & 2033
- Figure 56: Asia Pacific 3 Ply Face Masks Volume (K), by Types 2025 & 2033
- Figure 57: Asia Pacific 3 Ply Face Masks Revenue Share (%), by Types 2025 & 2033
- Figure 58: Asia Pacific 3 Ply Face Masks Volume Share (%), by Types 2025 & 2033
- Figure 59: Asia Pacific 3 Ply Face Masks Revenue (million), by Country 2025 & 2033
- Figure 60: Asia Pacific 3 Ply Face Masks Volume (K), by Country 2025 & 2033
- Figure 61: Asia Pacific 3 Ply Face Masks Revenue Share (%), by Country 2025 & 2033
- Figure 62: Asia Pacific 3 Ply Face Masks Volume Share (%), by Country 2025 & 2033
List of Tables
- Table 1: Global 3 Ply Face Masks Revenue million Forecast, by Application 2020 & 2033
- Table 2: Global 3 Ply Face Masks Volume K Forecast, by Application 2020 & 2033
- Table 3: Global 3 Ply Face Masks Revenue million Forecast, by Types 2020 & 2033
- Table 4: Global 3 Ply Face Masks Volume K Forecast, by Types 2020 & 2033
- Table 5: Global 3 Ply Face Masks Revenue million Forecast, by Region 2020 & 2033
- Table 6: Global 3 Ply Face Masks Volume K Forecast, by Region 2020 & 2033
- Table 7: Global 3 Ply Face Masks Revenue million Forecast, by Application 2020 & 2033
- Table 8: Global 3 Ply Face Masks Volume K Forecast, by Application 2020 & 2033
- Table 9: Global 3 Ply Face Masks Revenue million Forecast, by Types 2020 & 2033
- Table 10: Global 3 Ply Face Masks Volume K Forecast, by Types 2020 & 2033
- Table 11: Global 3 Ply Face Masks Revenue million Forecast, by Country 2020 & 2033
- Table 12: Global 3 Ply Face Masks Volume K Forecast, by Country 2020 & 2033
- Table 13: United States 3 Ply Face Masks Revenue (million) Forecast, by Application 2020 & 2033
- Table 14: United States 3 Ply Face Masks Volume (K) Forecast, by Application 2020 & 2033
- Table 15: Canada 3 Ply Face Masks Revenue (million) Forecast, by Application 2020 & 2033
- Table 16: Canada 3 Ply Face Masks Volume (K) Forecast, by Application 2020 & 2033
- Table 17: Mexico 3 Ply Face Masks Revenue (million) Forecast, by Application 2020 & 2033
- Table 18: Mexico 3 Ply Face Masks Volume (K) Forecast, by Application 2020 & 2033
- Table 19: Global 3 Ply Face Masks Revenue million Forecast, by Application 2020 & 2033
- Table 20: Global 3 Ply Face Masks Volume K Forecast, by Application 2020 & 2033
- Table 21: Global 3 Ply Face Masks Revenue million Forecast, by Types 2020 & 2033
- Table 22: Global 3 Ply Face Masks Volume K Forecast, by Types 2020 & 2033
- Table 23: Global 3 Ply Face Masks Revenue million Forecast, by Country 2020 & 2033
- Table 24: Global 3 Ply Face Masks Volume K Forecast, by Country 2020 & 2033
- Table 25: Brazil 3 Ply Face Masks Revenue (million) Forecast, by Application 2020 & 2033
- Table 26: Brazil 3 Ply Face Masks Volume (K) Forecast, by Application 2020 & 2033
- Table 27: Argentina 3 Ply Face Masks Revenue (million) Forecast, by Application 2020 & 2033
- Table 28: Argentina 3 Ply Face Masks Volume (K) Forecast, by Application 2020 & 2033
- Table 29: Rest of South America 3 Ply Face Masks Revenue (million) Forecast, by Application 2020 & 2033
- Table 30: Rest of South America 3 Ply Face Masks Volume (K) Forecast, by Application 2020 & 2033
- Table 31: Global 3 Ply Face Masks Revenue million Forecast, by Application 2020 & 2033
- Table 32: Global 3 Ply Face Masks Volume K Forecast, by Application 2020 & 2033
- Table 33: Global 3 Ply Face Masks Revenue million Forecast, by Types 2020 & 2033
- Table 34: Global 3 Ply Face Masks Volume K Forecast, by Types 2020 & 2033
- Table 35: Global 3 Ply Face Masks Revenue million Forecast, by Country 2020 & 2033
- Table 36: Global 3 Ply Face Masks Volume K Forecast, by Country 2020 & 2033
- Table 37: United Kingdom 3 Ply Face Masks Revenue (million) Forecast, by Application 2020 & 2033
- Table 38: United Kingdom 3 Ply Face Masks Volume (K) Forecast, by Application 2020 & 2033
- Table 39: Germany 3 Ply Face Masks Revenue (million) Forecast, by Application 2020 & 2033
- Table 40: Germany 3 Ply Face Masks Volume (K) Forecast, by Application 2020 & 2033
- Table 41: France 3 Ply Face Masks Revenue (million) Forecast, by Application 2020 & 2033
- Table 42: France 3 Ply Face Masks Volume (K) Forecast, by Application 2020 & 2033
- Table 43: Italy 3 Ply Face Masks Revenue (million) Forecast, by Application 2020 & 2033
- Table 44: Italy 3 Ply Face Masks Volume (K) Forecast, by Application 2020 & 2033
- Table 45: Spain 3 Ply Face Masks Revenue (million) Forecast, by Application 2020 & 2033
- Table 46: Spain 3 Ply Face Masks Volume (K) Forecast, by Application 2020 & 2033
- Table 47: Russia 3 Ply Face Masks Revenue (million) Forecast, by Application 2020 & 2033
- Table 48: Russia 3 Ply Face Masks Volume (K) Forecast, by Application 2020 & 2033
- Table 49: Benelux 3 Ply Face Masks Revenue (million) Forecast, by Application 2020 & 2033
- Table 50: Benelux 3 Ply Face Masks Volume (K) Forecast, by Application 2020 & 2033
- Table 51: Nordics 3 Ply Face Masks Revenue (million) Forecast, by Application 2020 & 2033
- Table 52: Nordics 3 Ply Face Masks Volume (K) Forecast, by Application 2020 & 2033
- Table 53: Rest of Europe 3 Ply Face Masks Revenue (million) Forecast, by Application 2020 & 2033
- Table 54: Rest of Europe 3 Ply Face Masks Volume (K) Forecast, by Application 2020 & 2033
- Table 55: Global 3 Ply Face Masks Revenue million Forecast, by Application 2020 & 2033
- Table 56: Global 3 Ply Face Masks Volume K Forecast, by Application 2020 & 2033
- Table 57: Global 3 Ply Face Masks Revenue million Forecast, by Types 2020 & 2033
- Table 58: Global 3 Ply Face Masks Volume K Forecast, by Types 2020 & 2033
- Table 59: Global 3 Ply Face Masks Revenue million Forecast, by Country 2020 & 2033
- Table 60: Global 3 Ply Face Masks Volume K Forecast, by Country 2020 & 2033
- Table 61: Turkey 3 Ply Face Masks Revenue (million) Forecast, by Application 2020 & 2033
- Table 62: Turkey 3 Ply Face Masks Volume (K) Forecast, by Application 2020 & 2033
- Table 63: Israel 3 Ply Face Masks Revenue (million) Forecast, by Application 2020 & 2033
- Table 64: Israel 3 Ply Face Masks Volume (K) Forecast, by Application 2020 & 2033
- Table 65: GCC 3 Ply Face Masks Revenue (million) Forecast, by Application 2020 & 2033
- Table 66: GCC 3 Ply Face Masks Volume (K) Forecast, by Application 2020 & 2033
- Table 67: North Africa 3 Ply Face Masks Revenue (million) Forecast, by Application 2020 & 2033
- Table 68: North Africa 3 Ply Face Masks Volume (K) Forecast, by Application 2020 & 2033
- Table 69: South Africa 3 Ply Face Masks Revenue (million) Forecast, by Application 2020 & 2033
- Table 70: South Africa 3 Ply Face Masks Volume (K) Forecast, by Application 2020 & 2033
- Table 71: Rest of Middle East & Africa 3 Ply Face Masks Revenue (million) Forecast, by Application 2020 & 2033
- Table 72: Rest of Middle East & Africa 3 Ply Face Masks Volume (K) Forecast, by Application 2020 & 2033
- Table 73: Global 3 Ply Face Masks Revenue million Forecast, by Application 2020 & 2033
- Table 74: Global 3 Ply Face Masks Volume K Forecast, by Application 2020 & 2033
- Table 75: Global 3 Ply Face Masks Revenue million Forecast, by Types 2020 & 2033
- Table 76: Global 3 Ply Face Masks Volume K Forecast, by Types 2020 & 2033
- Table 77: Global 3 Ply Face Masks Revenue million Forecast, by Country 2020 & 2033
- Table 78: Global 3 Ply Face Masks Volume K Forecast, by Country 2020 & 2033
- Table 79: China 3 Ply Face Masks Revenue (million) Forecast, by Application 2020 & 2033
- Table 80: China 3 Ply Face Masks Volume (K) Forecast, by Application 2020 & 2033
- Table 81: India 3 Ply Face Masks Revenue (million) Forecast, by Application 2020 & 2033
- Table 82: India 3 Ply Face Masks Volume (K) Forecast, by Application 2020 & 2033
- Table 83: Japan 3 Ply Face Masks Revenue (million) Forecast, by Application 2020 & 2033
- Table 84: Japan 3 Ply Face Masks Volume (K) Forecast, by Application 2020 & 2033
- Table 85: South Korea 3 Ply Face Masks Revenue (million) Forecast, by Application 2020 & 2033
- Table 86: South Korea 3 Ply Face Masks Volume (K) Forecast, by Application 2020 & 2033
- Table 87: ASEAN 3 Ply Face Masks Revenue (million) Forecast, by Application 2020 & 2033
- Table 88: ASEAN 3 Ply Face Masks Volume (K) Forecast, by Application 2020 & 2033
- Table 89: Oceania 3 Ply Face Masks Revenue (million) Forecast, by Application 2020 & 2033
- Table 90: Oceania 3 Ply Face Masks Volume (K) Forecast, by Application 2020 & 2033
- Table 91: Rest of Asia Pacific 3 Ply Face Masks Revenue (million) Forecast, by Application 2020 & 2033
- Table 92: Rest of Asia Pacific 3 Ply Face Masks Volume (K) Forecast, by Application 2020 & 2033
Frequently Asked Questions
1. What is the projected Compound Annual Growth Rate (CAGR) of the 3 Ply Face Masks?
The projected CAGR is approximately XX%.
2. Which companies are prominent players in the 3 Ply Face Masks?
Key companies in the market include 3M, Honeywell, SPRO Medical, KOWA, Makrite, Owens & Minor, UVEX, Kimberly-clark, McKesson, Prestige Ameritech, CM, Winner, Molnlycke Health, Moldex-Metric, Ansell, Unicharm, Cardinal Health, Te Yin, Japan Vilene, Shanghai Dasheng, Hakugen, Essity (BSN Medical), Zhende, Jiangyin Chang-hung, Tamagawa Eizai, Gerson, Suzhou Sanical, Sinotextiles, Alpha Pro Tech, Irema, DACH, Yuanqin, Troge Medical.
3. What are the main segments of the 3 Ply Face Masks?
The market segments include Application, Types.
4. Can you provide details about the market size?
The market size is estimated to be USD XXX million as of 2022.
5. What are some drivers contributing to market growth?
N/A
6. What are the notable trends driving market growth?
N/A
7. Are there any restraints impacting market growth?
N/A
8. Can you provide examples of recent developments in the market?
N/A
9. What pricing options are available for accessing the report?
Pricing options include single-user, multi-user, and enterprise licenses priced at USD 3950.00, USD 5925.00, and USD 7900.00 respectively.
10. Is the market size provided in terms of value or volume?
The market size is provided in terms of value, measured in million and volume, measured in K.
11. Are there any specific market keywords associated with the report?
Yes, the market keyword associated with the report is "3 Ply Face Masks," which aids in identifying and referencing the specific market segment covered.
12. How do I determine which pricing option suits my needs best?
The pricing options vary based on user requirements and access needs. Individual users may opt for single-user licenses, while businesses requiring broader access may choose multi-user or enterprise licenses for cost-effective access to the report.
13. Are there any additional resources or data provided in the 3 Ply Face Masks report?
While the report offers comprehensive insights, it's advisable to review the specific contents or supplementary materials provided to ascertain if additional resources or data are available.
14. How can I stay updated on further developments or reports in the 3 Ply Face Masks?
To stay informed about further developments, trends, and reports in the 3 Ply Face Masks, consider subscribing to industry newsletters, following relevant companies and organizations, or regularly checking reputable industry news sources and publications.
Methodology
Step 1 - Identification of Relevant Samples Size from Population Database


Step 2 - Approaches for Defining Global Market Size (Value, Volume* & Price*)

Note*: In applicable scenarios
Step 3 - Data Sources
Primary Research
- Web Analytics
- Survey Reports
- Research Institute
- Latest Research Reports
- Opinion Leaders
Secondary Research
- Annual Reports
- White Paper
- Latest Press Release
- Industry Association
- Paid Database
- Investor Presentations

Step 4 - Data Triangulation
Involves using different sources of information in order to increase the validity of a study
These sources are likely to be stakeholders in a program - participants, other researchers, program staff, other community members, and so on.
Then we put all data in single framework & apply various statistical tools to find out the dynamic on the market.
During the analysis stage, feedback from the stakeholder groups would be compared to determine areas of agreement as well as areas of divergence