

Key Insights
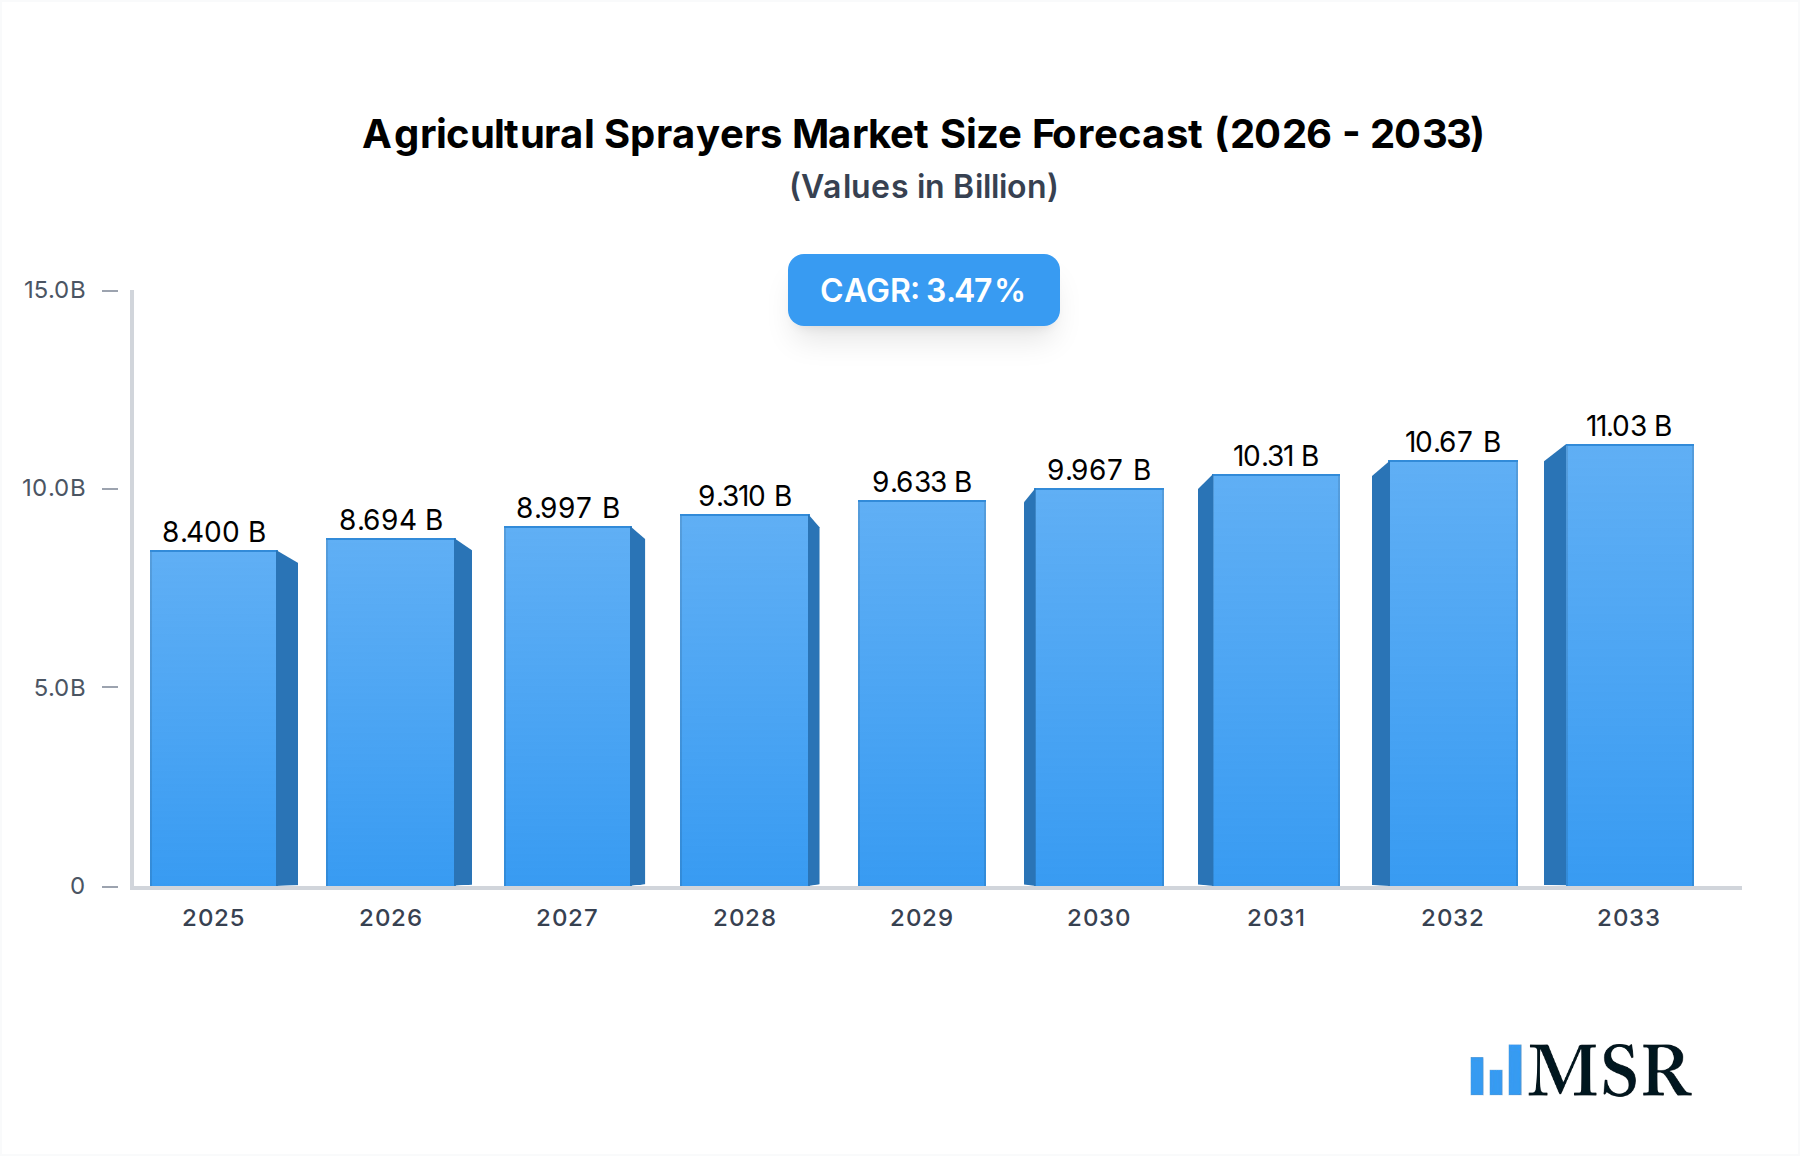
The global agricultural sprayers market is poised for robust growth, projected to reach approximately $8.4 billion in 2025. Driven by the increasing need for efficient crop protection and yield enhancement, the market is expected to witness a Compound Annual Growth Rate (CAGR) of 3.5% from 2019 to 2033. This expansion is fueled by several key factors, including the rising global population demanding greater food production, the need to combat escalating pest and disease outbreaks that threaten crop yields, and the growing adoption of precision agriculture techniques. Farmers are increasingly investing in advanced spraying technologies to optimize resource utilization, reduce chemical waste, and improve overall farm productivity. The demand for ultra-low volume (ULV) and low-volume (LV) sprayers is particularly strong, reflecting a trend towards more targeted and efficient application of pesticides and fertilizers.

Agricultural Sprayers Market Size (In Billion)
The market's trajectory is further shaped by emerging trends such as the integration of IoT and AI in sprayers for real-time data analysis and automated operations, and the development of drone-based spraying solutions for enhanced coverage and reduced labor costs. However, certain restraints, including the high initial investment cost for sophisticated spraying equipment and stringent regulatory frameworks governing the use of agrochemicals in some regions, could temper growth. Despite these challenges, the expanding agricultural sector across key regions like Asia Pacific and North America, coupled with a strong presence of leading manufacturers such as John Deere, CNH Industrial, and DJI, indicates a positive outlook. The application segment for cereals and oilseeds is expected to dominate due to their widespread cultivation, while fruits and vegetables will also contribute significantly to market demand.
Agricultural Sprayers Company Market Share
Unlocking Agricultural Efficiency: In-depth Report on the Global Agricultural Sprayers Market
This comprehensive report provides an authoritative analysis of the global agricultural sprayers market, offering critical insights and actionable intelligence for stakeholders. Delving deep into market dynamics, technological advancements, and emerging opportunities, this study equips you with the knowledge to navigate the evolving landscape of precision agriculture. With a study period from 2019–2033, including a base year of 2025 and a forecast period extending to 2033, this report offers a robust and forward-looking perspective on this vital sector. The global agricultural sprayers market size is projected to reach $12.5 billion by 2025, with a Compound Annual Growth Rate (CAGR) of 6.8% during the forecast period, driven by increasing adoption of smart farming technologies and a growing demand for enhanced crop yields.
Agricultural Sprayers Market Concentration & Dynamics
The agricultural sprayers market exhibits a moderately concentrated structure, with key players like John Deere (US), CNH Industrial (UK), EXEL Industries (France), Bucher Industries (Switzerland), and Mahindra & Mahindra (India) holding significant market share. Innovation ecosystems are thriving, particularly in areas of drone sprayers and smart spraying technology, fueled by investments in research and development. Regulatory frameworks, while varied by region, are increasingly focusing on environmental protection and pesticide application efficiency, indirectly driving demand for advanced agriculture spraying equipment. Substitute products, such as manual application methods or biological pest control, pose a limited threat due to the scalability and efficiency of mechanical sprayers. End-user trends indicate a growing preference for precision agriculture solutions and automated sprayers to optimize resource utilization and minimize chemical runoff. Mergers and Acquisitions (M&A) activities are observed, with 15 M&A deals recorded in the historical period (2019-2024), primarily aimed at acquiring innovative technologies and expanding market reach. The total market value was an estimated $10.2 billion in 2024.
Market Share Snapshot (2025 Estimates):
- John Deere (US): 18%
- CNH Industrial (UK): 15%
- EXEL Industries (France): 12%
- Bucher Industries (Switzerland): 10%
- Mahindra & Mahindra (India): 8%
- Others: 37%
M&A Deal Count (2019-2024): 15 deals, focusing on precision agriculture technologies and market expansion.
Agricultural Sprayers Industry Insights & Trends
The agricultural sprayers industry is experiencing robust growth, propelled by several key factors. The escalating global population necessitates increased food production, driving demand for efficient and productive farming practices, making crop sprayers indispensable. Advancements in precision agriculture, including GPS-guided systems, variable rate technology (VRT), and real-time data analytics, are revolutionizing how farmers apply agrochemicals, leading to optimized application and reduced waste. This technological disruption is a major growth driver, enabling variable rate spraying and significantly improving crop protection. The integration of IoT sensors and artificial intelligence (AI) into sprayers allows for hyper-localized application based on pest pressure and crop health, further enhancing efficiency.
Evolving consumer behaviors, such as the increasing demand for sustainably produced food and organic produce, are indirectly influencing the agricultural sprayers market. Farmers are seeking solutions that minimize environmental impact, leading to a preference for low-volume sprayers and ultra-low volume (ULV) sprayers that reduce chemical usage. The development of sophisticated nozzle technology and spray drift reduction systems further supports this trend. The global agricultural sprayers market size was valued at approximately $9.8 billion in 2019 and is projected to reach $12.5 billion by 2025, with an estimated CAGR of 6.8% during the forecast period. This growth trajectory highlights the critical role of efficient spraying solutions in modern agriculture.
- Key Trends Driving Growth:
- Precision Agriculture Adoption: Increased investment in smart farming technologies.
- Demand for Food Security: Growing need for enhanced crop yields to feed a rising global population.
- Technological Innovations: Integration of IoT, AI, and drone technology.
- Sustainability Concerns: Focus on reducing chemical usage and environmental impact.
Key Markets & Segments Leading Agricultural Sprayers
The global agricultural sprayers market is dominated by several key regions and application segments. North America, particularly the United States, stands as a leading market due to its large-scale agricultural operations and high adoption rate of advanced farming technologies. The cereals segment represents the largest application area, driven by the widespread cultivation of crops like corn, wheat, and soybeans, which require significant and efficient spraying for pest and disease control. In terms of types, high volume sprayers continue to hold a substantial market share due to their applicability in large-scale field operations. However, the ultra-low volume (ULV) and low volume (LV) sprayers segments are witnessing rapid growth, fueled by the increasing emphasis on precision application and chemical reduction.
Asia Pacific, with its vast agricultural land and a growing focus on modernizing farming practices, is emerging as another significant growth region. Countries like India and China are witnessing increased adoption of agricultural spray equipment to boost productivity and address food security challenges. The fruits & vegetables segment, while smaller in overall volume compared to cereals, presents a high-value market due to the specific spraying needs and the higher market price of these produce. The adoption of drone sprayers is particularly gaining traction in this segment for targeted applications in orchards and vineyards.
Dominant Application Segments:
- Cereals: Accounting for approximately 45% of the market share due to extensive cultivation of major grain crops.
- Fruits & Vegetables: A high-value segment with growing demand for specialized spraying solutions.
- Oilseeds: Significant market share driven by the global demand for edible oils.
Leading Sprayer Types:
- High Volume Sprayers: Essential for broad-acre farming, representing around 55% of the market.
- Low Volume & Ultra-Low Volume Sprayers: Experiencing rapid growth driven by precision farming and sustainability initiatives, collectively holding 40% market share.
Agricultural Sprayers Product Developments
Innovations in agricultural sprayers are rapidly transforming crop management. Recent product developments include the integration of AI-powered sensors for real-time pest detection and targeted herbicide application, drastically reducing chemical usage. Smart sprayers with GPS guidance and automatic boom height adjustment ensure uniform coverage and minimize overlap, leading to significant cost savings. The emergence of autonomous drone sprayers offers enhanced maneuverability for complex terrains and precise application in orchards and vineyards. These advancements are crucial for increasing crop yield and ensuring effective pest control and disease management.
- Key Product Innovations:
- AI-powered real-time pest detection and targeted spraying.
- GPS-guided systems for precision application and route optimization.
- Autonomous drone sprayers for increased maneuverability and efficiency.
Challenges in the Agricultural Sprayers Market
Despite strong growth prospects, the agricultural sprayers market faces several challenges. Regulatory hurdles, particularly stringent regulations on pesticide use and environmental impact in regions like Europe, can slow down the adoption of new technologies. High initial investment costs for advanced precision spraying equipment can be a barrier for smallholder farmers. Supply chain disruptions, exacerbated by global events, can impact the availability of critical components and affect production timelines. Intense competition among manufacturers, especially from low-cost providers, puts pressure on profit margins.
- Key Restraints:
- High upfront cost of advanced spraying technology.
- Stringent environmental and pesticide regulations.
- Supply chain volatility and component shortages.
Forces Driving Agricultural Sprayers Growth
The growth of the agricultural sprayers market is propelled by a confluence of technological, economic, and regulatory forces. The relentless drive for increased food production to meet the demands of a growing global population is a fundamental driver. Technological advancements, including the miniaturization of sensors, the proliferation of drones for agriculture, and the development of sophisticated software for farm management, are enabling more efficient and precise crop protection. Government initiatives promoting sustainable agriculture and offering subsidies for adopting modern farming equipment also play a crucial role. The increasing recognition of precision farming benefits, such as optimized resource allocation and reduced environmental impact, further fuels market expansion.
- Key Growth Drivers:
- Global demand for food security.
- Advancements in precision agriculture technologies.
- Government support for modern farming practices.
Challenges in the Agricultural Sprayers Market
Long-term growth catalysts for the agricultural sprayers market lie in continued innovation and strategic market expansion. The development of more affordable and accessible smart spraying solutions will be crucial for broader adoption, particularly among small and medium-sized farms. Partnerships between technology providers and agricultural machinery manufacturers will foster integrated solutions. Furthermore, expanding into emerging economies with significant agricultural sectors presents substantial growth potential. The ongoing research into biodegradable and more environmentally friendly agrochemicals will also necessitate the development of sprayers designed for their effective and precise application.
- Long-Term Growth Catalysts:
- Development of affordable precision spraying technologies.
- Strategic alliances for integrated farming solutions.
- Expansion into emerging agricultural markets.
Emerging Opportunities in Agricultural Sprayers
Emerging opportunities in the agricultural sprayers market are centered around the integration of advanced digital technologies and catering to niche applications. The burgeoning market for robotics in agriculture presents a significant opportunity for autonomous and semi-autonomous spraying systems. The growing demand for organic farming and integrated pest management (IPM) creates a need for highly precise and targeted spraying solutions that minimize chemical inputs. Furthermore, the development of specialized sprayers for vertical farming and greenhouse agriculture offers a new avenue for market growth. The increasing use of data analytics and cloud-based platforms for precision spraying recommendations will create value-added services for farmers.
- Key Emerging Opportunities:
- Autonomous and robotic spraying systems.
- Specialized sprayers for vertical and greenhouse farming.
- Data-driven precision spraying advisory services.
Leading Players in the Agricultural Sprayers Sector
- John Deere
- CNH Industrial
- EXEL Industries
- Bucher Industries
- Mahindra & Mahindra
- STIHL
- AGCO Corporation
- Kubota
- Yamaha
- BGroup S.p.A.
- Amazonen-Werke
- DJI
Key Milestones in Agricultural Sprayers Industry
- 2019: Introduction of AI-powered boom control systems for enhanced precision.
- 2020: Significant increase in drone sprayer adoption for targeted applications.
- 2021: Development of advanced nozzle technologies for reduced drift and improved coverage.
- 2022: Expansion of smart spraying solutions with integrated data analytics platforms.
- 2023: Growing interest in battery-powered and electric agricultural sprayers for sustainability.
- 2024: Increased investment in research for autonomous spraying robots.
Strategic Outlook for Agricultural Sprayers Market
The strategic outlook for the agricultural sprayers market is highly promising, driven by the indispensable role of efficient and precise crop management in global food security. Growth accelerators will stem from the continued innovation in smart spraying technology, the increasing adoption of drones and robotics in agriculture, and the development of sustainable and environmentally friendly spraying solutions. The market will witness a greater integration of data analytics and AI, enabling farmers to make more informed decisions for pest management and fertilizer application. Strategic collaborations and acquisitions will continue to shape the competitive landscape, fostering the development of comprehensive precision farming ecosystems.
- Future Growth Accelerators:
- Continued innovation in smart spraying and automation.
- Expansion of drone and robotic spraying applications.
- Focus on sustainable and environmentally conscious spraying solutions.
Agricultural Sprayers Segmentation
-
1. Application
- 1.1. Cereals
- 1.2. Oilseeds
- 1.3. Fruits & Vegetables
- 1.4. Others
-
2. Types
- 2.1. Ultra-Low Volume
- 2.2. Low Volume
- 2.3. High Volume
Agricultural Sprayers Segmentation By Geography
-
1. North America
- 1.1. United States
- 1.2. Canada
- 1.3. Mexico
-
2. South America
- 2.1. Brazil
- 2.2. Argentina
- 2.3. Rest of South America
-
3. Europe
- 3.1. United Kingdom
- 3.2. Germany
- 3.3. France
- 3.4. Italy
- 3.5. Spain
- 3.6. Russia
- 3.7. Benelux
- 3.8. Nordics
- 3.9. Rest of Europe
-
4. Middle East & Africa
- 4.1. Turkey
- 4.2. Israel
- 4.3. GCC
- 4.4. North Africa
- 4.5. South Africa
- 4.6. Rest of Middle East & Africa
-
5. Asia Pacific
- 5.1. China
- 5.2. India
- 5.3. Japan
- 5.4. South Korea
- 5.5. ASEAN
- 5.6. Oceania
- 5.7. Rest of Asia Pacific
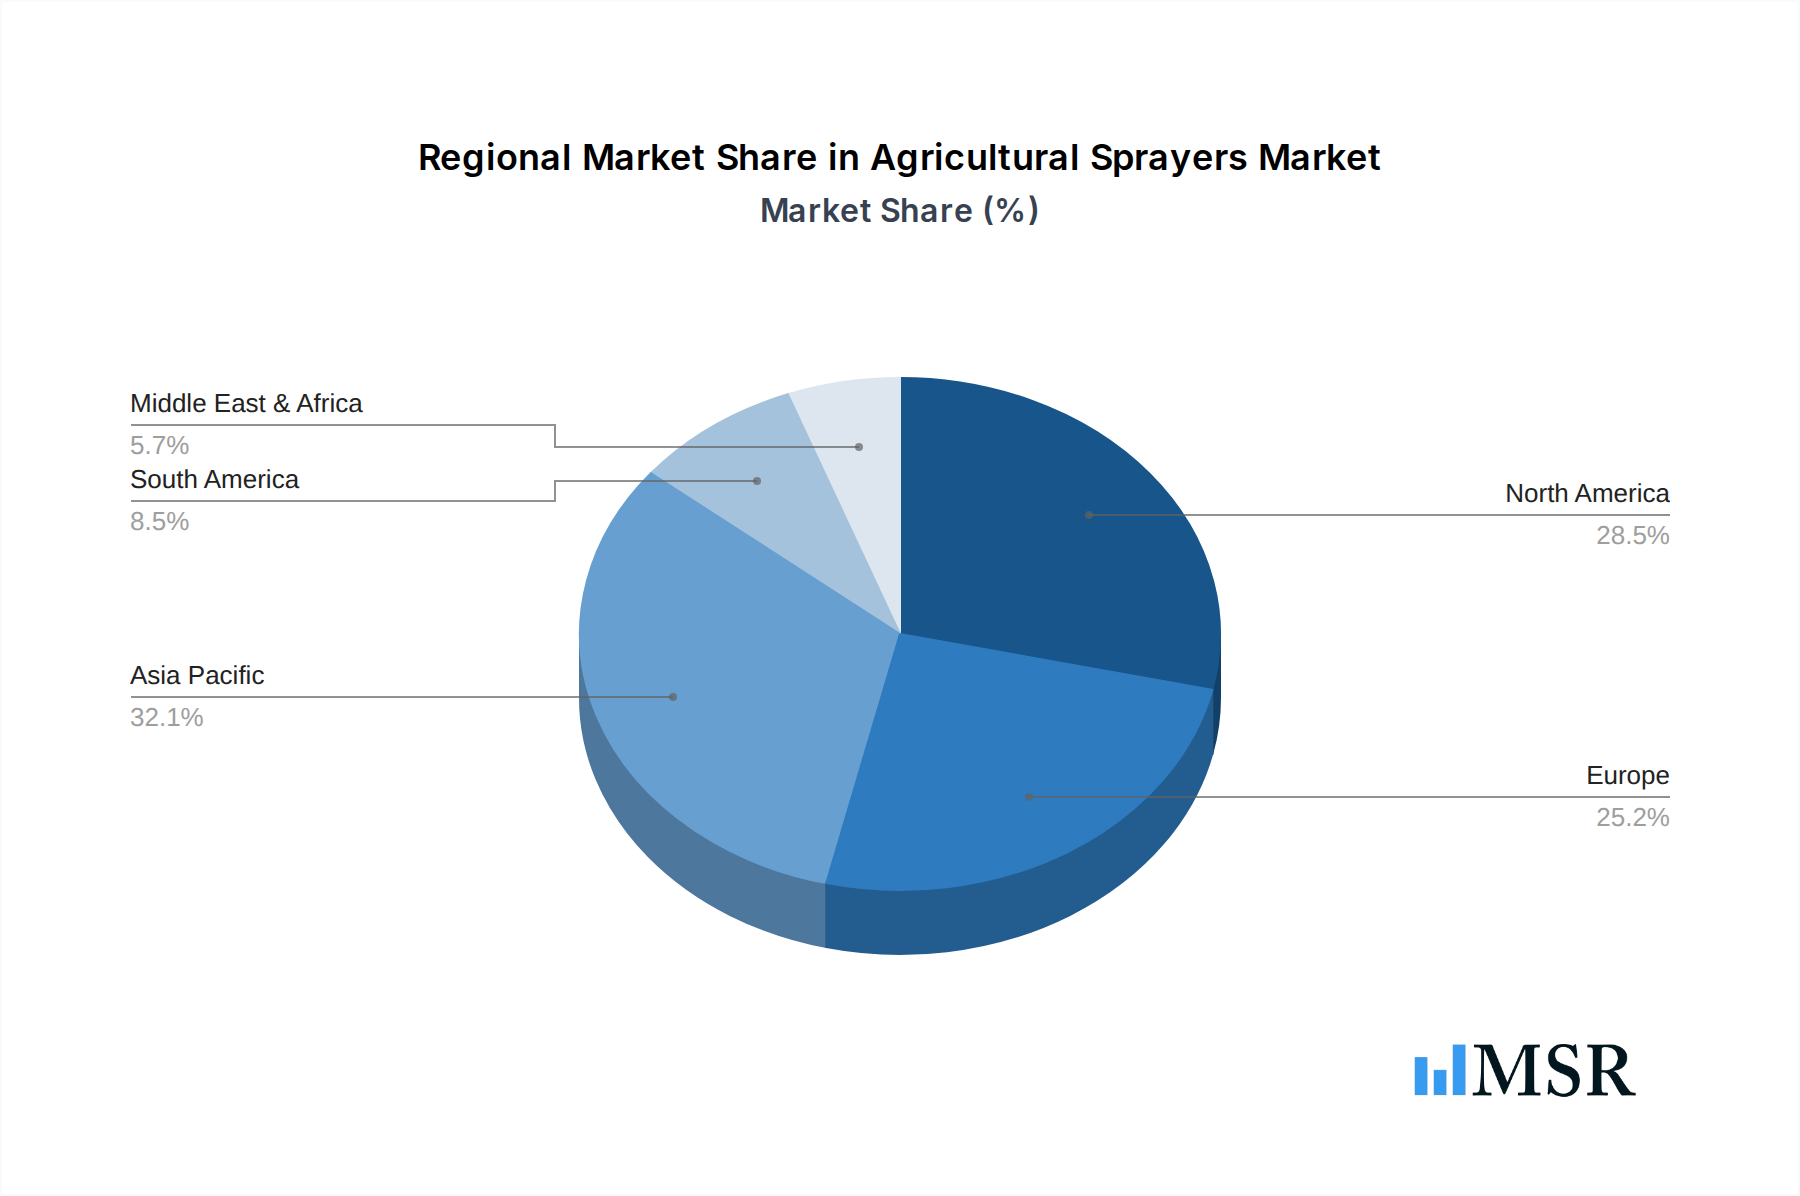
Agricultural Sprayers Regional Market Share
Geographic Coverage of Agricultural Sprayers
Agricultural Sprayers REPORT HIGHLIGHTS
| Aspects | Details |
|---|---|
| Study Period | 2020-2034 |
| Base Year | 2025 |
| Estimated Year | 2026 |
| Forecast Period | 2026-2034 |
| Historical Period | 2020-2025 |
| Growth Rate | CAGR of 3.5% from 2020-2034 |
| Segmentation |
|
Table of Contents
- 1. Introduction
- 1.1. Research Scope
- 1.2. Market Segmentation
- 1.3. Research Methodology
- 1.4. Definitions and Assumptions
- 2. Executive Summary
- 2.1. Introduction
- 3. Market Dynamics
- 3.1. Introduction
- 3.2. Market Drivers
- 3.3. Market Restrains
- 3.4. Market Trends
- 4. Market Factor Analysis
- 4.1. Porters Five Forces
- 4.2. Supply/Value Chain
- 4.3. PESTEL analysis
- 4.4. Market Entropy
- 4.5. Patent/Trademark Analysis
- 5. Global Agricultural Sprayers Analysis, Insights and Forecast, 2020-2032
- 5.1. Market Analysis, Insights and Forecast - by Application
- 5.1.1. Cereals
- 5.1.2. Oilseeds
- 5.1.3. Fruits & Vegetables
- 5.1.4. Others
- 5.2. Market Analysis, Insights and Forecast - by Types
- 5.2.1. Ultra-Low Volume
- 5.2.2. Low Volume
- 5.2.3. High Volume
- 5.3. Market Analysis, Insights and Forecast - by Region
- 5.3.1. North America
- 5.3.2. South America
- 5.3.3. Europe
- 5.3.4. Middle East & Africa
- 5.3.5. Asia Pacific
- 5.1. Market Analysis, Insights and Forecast - by Application
- 6. North America Agricultural Sprayers Analysis, Insights and Forecast, 2020-2032
- 6.1. Market Analysis, Insights and Forecast - by Application
- 6.1.1. Cereals
- 6.1.2. Oilseeds
- 6.1.3. Fruits & Vegetables
- 6.1.4. Others
- 6.2. Market Analysis, Insights and Forecast - by Types
- 6.2.1. Ultra-Low Volume
- 6.2.2. Low Volume
- 6.2.3. High Volume
- 6.1. Market Analysis, Insights and Forecast - by Application
- 7. South America Agricultural Sprayers Analysis, Insights and Forecast, 2020-2032
- 7.1. Market Analysis, Insights and Forecast - by Application
- 7.1.1. Cereals
- 7.1.2. Oilseeds
- 7.1.3. Fruits & Vegetables
- 7.1.4. Others
- 7.2. Market Analysis, Insights and Forecast - by Types
- 7.2.1. Ultra-Low Volume
- 7.2.2. Low Volume
- 7.2.3. High Volume
- 7.1. Market Analysis, Insights and Forecast - by Application
- 8. Europe Agricultural Sprayers Analysis, Insights and Forecast, 2020-2032
- 8.1. Market Analysis, Insights and Forecast - by Application
- 8.1.1. Cereals
- 8.1.2. Oilseeds
- 8.1.3. Fruits & Vegetables
- 8.1.4. Others
- 8.2. Market Analysis, Insights and Forecast - by Types
- 8.2.1. Ultra-Low Volume
- 8.2.2. Low Volume
- 8.2.3. High Volume
- 8.1. Market Analysis, Insights and Forecast - by Application
- 9. Middle East & Africa Agricultural Sprayers Analysis, Insights and Forecast, 2020-2032
- 9.1. Market Analysis, Insights and Forecast - by Application
- 9.1.1. Cereals
- 9.1.2. Oilseeds
- 9.1.3. Fruits & Vegetables
- 9.1.4. Others
- 9.2. Market Analysis, Insights and Forecast - by Types
- 9.2.1. Ultra-Low Volume
- 9.2.2. Low Volume
- 9.2.3. High Volume
- 9.1. Market Analysis, Insights and Forecast - by Application
- 10. Asia Pacific Agricultural Sprayers Analysis, Insights and Forecast, 2020-2032
- 10.1. Market Analysis, Insights and Forecast - by Application
- 10.1.1. Cereals
- 10.1.2. Oilseeds
- 10.1.3. Fruits & Vegetables
- 10.1.4. Others
- 10.2. Market Analysis, Insights and Forecast - by Types
- 10.2.1. Ultra-Low Volume
- 10.2.2. Low Volume
- 10.2.3. High Volume
- 10.1. Market Analysis, Insights and Forecast - by Application
- 11. Competitive Analysis
- 11.1. Global Market Share Analysis 2025
- 11.2. Company Profiles
- 11.2.1 John Deere (US)
- 11.2.1.1. Overview
- 11.2.1.2. Products
- 11.2.1.3. SWOT Analysis
- 11.2.1.4. Recent Developments
- 11.2.1.5. Financials (Based on Availability)
- 11.2.2 CNH Industrial (UK)
- 11.2.2.1. Overview
- 11.2.2.2. Products
- 11.2.2.3. SWOT Analysis
- 11.2.2.4. Recent Developments
- 11.2.2.5. Financials (Based on Availability)
- 11.2.3 EXEL Industries (France)
- 11.2.3.1. Overview
- 11.2.3.2. Products
- 11.2.3.3. SWOT Analysis
- 11.2.3.4. Recent Developments
- 11.2.3.5. Financials (Based on Availability)
- 11.2.4 Bucher Industries (Switzerland)
- 11.2.4.1. Overview
- 11.2.4.2. Products
- 11.2.4.3. SWOT Analysis
- 11.2.4.4. Recent Developments
- 11.2.4.5. Financials (Based on Availability)
- 11.2.5 Mahindra & Mahindra (India)
- 11.2.5.1. Overview
- 11.2.5.2. Products
- 11.2.5.3. SWOT Analysis
- 11.2.5.4. Recent Developments
- 11.2.5.5. Financials (Based on Availability)
- 11.2.6 STIHL (Germany)
- 11.2.6.1. Overview
- 11.2.6.2. Products
- 11.2.6.3. SWOT Analysis
- 11.2.6.4. Recent Developments
- 11.2.6.5. Financials (Based on Availability)
- 11.2.7 AGCO Corporation (US)
- 11.2.7.1. Overview
- 11.2.7.2. Products
- 11.2.7.3. SWOT Analysis
- 11.2.7.4. Recent Developments
- 11.2.7.5. Financials (Based on Availability)
- 11.2.8 Kubota (Japan)
- 11.2.8.1. Overview
- 11.2.8.2. Products
- 11.2.8.3. SWOT Analysis
- 11.2.8.4. Recent Developments
- 11.2.8.5. Financials (Based on Availability)
- 11.2.9 Yamaha (Japan)
- 11.2.9.1. Overview
- 11.2.9.2. Products
- 11.2.9.3. SWOT Analysis
- 11.2.9.4. Recent Developments
- 11.2.9.5. Financials (Based on Availability)
- 11.2.10 BGroup S.p.A. (Italy)
- 11.2.10.1. Overview
- 11.2.10.2. Products
- 11.2.10.3. SWOT Analysis
- 11.2.10.4. Recent Developments
- 11.2.10.5. Financials (Based on Availability)
- 11.2.11 Amazonen-Werke (Germany)
- 11.2.11.1. Overview
- 11.2.11.2. Products
- 11.2.11.3. SWOT Analysis
- 11.2.11.4. Recent Developments
- 11.2.11.5. Financials (Based on Availability)
- 11.2.12 DJI (China)
- 11.2.12.1. Overview
- 11.2.12.2. Products
- 11.2.12.3. SWOT Analysis
- 11.2.12.4. Recent Developments
- 11.2.12.5. Financials (Based on Availability)
- 11.2.1 John Deere (US)
List of Figures
- Figure 1: Global Agricultural Sprayers Revenue Breakdown (billion, %) by Region 2025 & 2033
- Figure 2: Global Agricultural Sprayers Volume Breakdown (K, %) by Region 2025 & 2033
- Figure 3: North America Agricultural Sprayers Revenue (billion), by Application 2025 & 2033
- Figure 4: North America Agricultural Sprayers Volume (K), by Application 2025 & 2033
- Figure 5: North America Agricultural Sprayers Revenue Share (%), by Application 2025 & 2033
- Figure 6: North America Agricultural Sprayers Volume Share (%), by Application 2025 & 2033
- Figure 7: North America Agricultural Sprayers Revenue (billion), by Types 2025 & 2033
- Figure 8: North America Agricultural Sprayers Volume (K), by Types 2025 & 2033
- Figure 9: North America Agricultural Sprayers Revenue Share (%), by Types 2025 & 2033
- Figure 10: North America Agricultural Sprayers Volume Share (%), by Types 2025 & 2033
- Figure 11: North America Agricultural Sprayers Revenue (billion), by Country 2025 & 2033
- Figure 12: North America Agricultural Sprayers Volume (K), by Country 2025 & 2033
- Figure 13: North America Agricultural Sprayers Revenue Share (%), by Country 2025 & 2033
- Figure 14: North America Agricultural Sprayers Volume Share (%), by Country 2025 & 2033
- Figure 15: South America Agricultural Sprayers Revenue (billion), by Application 2025 & 2033
- Figure 16: South America Agricultural Sprayers Volume (K), by Application 2025 & 2033
- Figure 17: South America Agricultural Sprayers Revenue Share (%), by Application 2025 & 2033
- Figure 18: South America Agricultural Sprayers Volume Share (%), by Application 2025 & 2033
- Figure 19: South America Agricultural Sprayers Revenue (billion), by Types 2025 & 2033
- Figure 20: South America Agricultural Sprayers Volume (K), by Types 2025 & 2033
- Figure 21: South America Agricultural Sprayers Revenue Share (%), by Types 2025 & 2033
- Figure 22: South America Agricultural Sprayers Volume Share (%), by Types 2025 & 2033
- Figure 23: South America Agricultural Sprayers Revenue (billion), by Country 2025 & 2033
- Figure 24: South America Agricultural Sprayers Volume (K), by Country 2025 & 2033
- Figure 25: South America Agricultural Sprayers Revenue Share (%), by Country 2025 & 2033
- Figure 26: South America Agricultural Sprayers Volume Share (%), by Country 2025 & 2033
- Figure 27: Europe Agricultural Sprayers Revenue (billion), by Application 2025 & 2033
- Figure 28: Europe Agricultural Sprayers Volume (K), by Application 2025 & 2033
- Figure 29: Europe Agricultural Sprayers Revenue Share (%), by Application 2025 & 2033
- Figure 30: Europe Agricultural Sprayers Volume Share (%), by Application 2025 & 2033
- Figure 31: Europe Agricultural Sprayers Revenue (billion), by Types 2025 & 2033
- Figure 32: Europe Agricultural Sprayers Volume (K), by Types 2025 & 2033
- Figure 33: Europe Agricultural Sprayers Revenue Share (%), by Types 2025 & 2033
- Figure 34: Europe Agricultural Sprayers Volume Share (%), by Types 2025 & 2033
- Figure 35: Europe Agricultural Sprayers Revenue (billion), by Country 2025 & 2033
- Figure 36: Europe Agricultural Sprayers Volume (K), by Country 2025 & 2033
- Figure 37: Europe Agricultural Sprayers Revenue Share (%), by Country 2025 & 2033
- Figure 38: Europe Agricultural Sprayers Volume Share (%), by Country 2025 & 2033
- Figure 39: Middle East & Africa Agricultural Sprayers Revenue (billion), by Application 2025 & 2033
- Figure 40: Middle East & Africa Agricultural Sprayers Volume (K), by Application 2025 & 2033
- Figure 41: Middle East & Africa Agricultural Sprayers Revenue Share (%), by Application 2025 & 2033
- Figure 42: Middle East & Africa Agricultural Sprayers Volume Share (%), by Application 2025 & 2033
- Figure 43: Middle East & Africa Agricultural Sprayers Revenue (billion), by Types 2025 & 2033
- Figure 44: Middle East & Africa Agricultural Sprayers Volume (K), by Types 2025 & 2033
- Figure 45: Middle East & Africa Agricultural Sprayers Revenue Share (%), by Types 2025 & 2033
- Figure 46: Middle East & Africa Agricultural Sprayers Volume Share (%), by Types 2025 & 2033
- Figure 47: Middle East & Africa Agricultural Sprayers Revenue (billion), by Country 2025 & 2033
- Figure 48: Middle East & Africa Agricultural Sprayers Volume (K), by Country 2025 & 2033
- Figure 49: Middle East & Africa Agricultural Sprayers Revenue Share (%), by Country 2025 & 2033
- Figure 50: Middle East & Africa Agricultural Sprayers Volume Share (%), by Country 2025 & 2033
- Figure 51: Asia Pacific Agricultural Sprayers Revenue (billion), by Application 2025 & 2033
- Figure 52: Asia Pacific Agricultural Sprayers Volume (K), by Application 2025 & 2033
- Figure 53: Asia Pacific Agricultural Sprayers Revenue Share (%), by Application 2025 & 2033
- Figure 54: Asia Pacific Agricultural Sprayers Volume Share (%), by Application 2025 & 2033
- Figure 55: Asia Pacific Agricultural Sprayers Revenue (billion), by Types 2025 & 2033
- Figure 56: Asia Pacific Agricultural Sprayers Volume (K), by Types 2025 & 2033
- Figure 57: Asia Pacific Agricultural Sprayers Revenue Share (%), by Types 2025 & 2033
- Figure 58: Asia Pacific Agricultural Sprayers Volume Share (%), by Types 2025 & 2033
- Figure 59: Asia Pacific Agricultural Sprayers Revenue (billion), by Country 2025 & 2033
- Figure 60: Asia Pacific Agricultural Sprayers Volume (K), by Country 2025 & 2033
- Figure 61: Asia Pacific Agricultural Sprayers Revenue Share (%), by Country 2025 & 2033
- Figure 62: Asia Pacific Agricultural Sprayers Volume Share (%), by Country 2025 & 2033
List of Tables
- Table 1: Global Agricultural Sprayers Revenue billion Forecast, by Application 2020 & 2033
- Table 2: Global Agricultural Sprayers Volume K Forecast, by Application 2020 & 2033
- Table 3: Global Agricultural Sprayers Revenue billion Forecast, by Types 2020 & 2033
- Table 4: Global Agricultural Sprayers Volume K Forecast, by Types 2020 & 2033
- Table 5: Global Agricultural Sprayers Revenue billion Forecast, by Region 2020 & 2033
- Table 6: Global Agricultural Sprayers Volume K Forecast, by Region 2020 & 2033
- Table 7: Global Agricultural Sprayers Revenue billion Forecast, by Application 2020 & 2033
- Table 8: Global Agricultural Sprayers Volume K Forecast, by Application 2020 & 2033
- Table 9: Global Agricultural Sprayers Revenue billion Forecast, by Types 2020 & 2033
- Table 10: Global Agricultural Sprayers Volume K Forecast, by Types 2020 & 2033
- Table 11: Global Agricultural Sprayers Revenue billion Forecast, by Country 2020 & 2033
- Table 12: Global Agricultural Sprayers Volume K Forecast, by Country 2020 & 2033
- Table 13: United States Agricultural Sprayers Revenue (billion) Forecast, by Application 2020 & 2033
- Table 14: United States Agricultural Sprayers Volume (K) Forecast, by Application 2020 & 2033
- Table 15: Canada Agricultural Sprayers Revenue (billion) Forecast, by Application 2020 & 2033
- Table 16: Canada Agricultural Sprayers Volume (K) Forecast, by Application 2020 & 2033
- Table 17: Mexico Agricultural Sprayers Revenue (billion) Forecast, by Application 2020 & 2033
- Table 18: Mexico Agricultural Sprayers Volume (K) Forecast, by Application 2020 & 2033
- Table 19: Global Agricultural Sprayers Revenue billion Forecast, by Application 2020 & 2033
- Table 20: Global Agricultural Sprayers Volume K Forecast, by Application 2020 & 2033
- Table 21: Global Agricultural Sprayers Revenue billion Forecast, by Types 2020 & 2033
- Table 22: Global Agricultural Sprayers Volume K Forecast, by Types 2020 & 2033
- Table 23: Global Agricultural Sprayers Revenue billion Forecast, by Country 2020 & 2033
- Table 24: Global Agricultural Sprayers Volume K Forecast, by Country 2020 & 2033
- Table 25: Brazil Agricultural Sprayers Revenue (billion) Forecast, by Application 2020 & 2033
- Table 26: Brazil Agricultural Sprayers Volume (K) Forecast, by Application 2020 & 2033
- Table 27: Argentina Agricultural Sprayers Revenue (billion) Forecast, by Application 2020 & 2033
- Table 28: Argentina Agricultural Sprayers Volume (K) Forecast, by Application 2020 & 2033
- Table 29: Rest of South America Agricultural Sprayers Revenue (billion) Forecast, by Application 2020 & 2033
- Table 30: Rest of South America Agricultural Sprayers Volume (K) Forecast, by Application 2020 & 2033
- Table 31: Global Agricultural Sprayers Revenue billion Forecast, by Application 2020 & 2033
- Table 32: Global Agricultural Sprayers Volume K Forecast, by Application 2020 & 2033
- Table 33: Global Agricultural Sprayers Revenue billion Forecast, by Types 2020 & 2033
- Table 34: Global Agricultural Sprayers Volume K Forecast, by Types 2020 & 2033
- Table 35: Global Agricultural Sprayers Revenue billion Forecast, by Country 2020 & 2033
- Table 36: Global Agricultural Sprayers Volume K Forecast, by Country 2020 & 2033
- Table 37: United Kingdom Agricultural Sprayers Revenue (billion) Forecast, by Application 2020 & 2033
- Table 38: United Kingdom Agricultural Sprayers Volume (K) Forecast, by Application 2020 & 2033
- Table 39: Germany Agricultural Sprayers Revenue (billion) Forecast, by Application 2020 & 2033
- Table 40: Germany Agricultural Sprayers Volume (K) Forecast, by Application 2020 & 2033
- Table 41: France Agricultural Sprayers Revenue (billion) Forecast, by Application 2020 & 2033
- Table 42: France Agricultural Sprayers Volume (K) Forecast, by Application 2020 & 2033
- Table 43: Italy Agricultural Sprayers Revenue (billion) Forecast, by Application 2020 & 2033
- Table 44: Italy Agricultural Sprayers Volume (K) Forecast, by Application 2020 & 2033
- Table 45: Spain Agricultural Sprayers Revenue (billion) Forecast, by Application 2020 & 2033
- Table 46: Spain Agricultural Sprayers Volume (K) Forecast, by Application 2020 & 2033
- Table 47: Russia Agricultural Sprayers Revenue (billion) Forecast, by Application 2020 & 2033
- Table 48: Russia Agricultural Sprayers Volume (K) Forecast, by Application 2020 & 2033
- Table 49: Benelux Agricultural Sprayers Revenue (billion) Forecast, by Application 2020 & 2033
- Table 50: Benelux Agricultural Sprayers Volume (K) Forecast, by Application 2020 & 2033
- Table 51: Nordics Agricultural Sprayers Revenue (billion) Forecast, by Application 2020 & 2033
- Table 52: Nordics Agricultural Sprayers Volume (K) Forecast, by Application 2020 & 2033
- Table 53: Rest of Europe Agricultural Sprayers Revenue (billion) Forecast, by Application 2020 & 2033
- Table 54: Rest of Europe Agricultural Sprayers Volume (K) Forecast, by Application 2020 & 2033
- Table 55: Global Agricultural Sprayers Revenue billion Forecast, by Application 2020 & 2033
- Table 56: Global Agricultural Sprayers Volume K Forecast, by Application 2020 & 2033
- Table 57: Global Agricultural Sprayers Revenue billion Forecast, by Types 2020 & 2033
- Table 58: Global Agricultural Sprayers Volume K Forecast, by Types 2020 & 2033
- Table 59: Global Agricultural Sprayers Revenue billion Forecast, by Country 2020 & 2033
- Table 60: Global Agricultural Sprayers Volume K Forecast, by Country 2020 & 2033
- Table 61: Turkey Agricultural Sprayers Revenue (billion) Forecast, by Application 2020 & 2033
- Table 62: Turkey Agricultural Sprayers Volume (K) Forecast, by Application 2020 & 2033
- Table 63: Israel Agricultural Sprayers Revenue (billion) Forecast, by Application 2020 & 2033
- Table 64: Israel Agricultural Sprayers Volume (K) Forecast, by Application 2020 & 2033
- Table 65: GCC Agricultural Sprayers Revenue (billion) Forecast, by Application 2020 & 2033
- Table 66: GCC Agricultural Sprayers Volume (K) Forecast, by Application 2020 & 2033
- Table 67: North Africa Agricultural Sprayers Revenue (billion) Forecast, by Application 2020 & 2033
- Table 68: North Africa Agricultural Sprayers Volume (K) Forecast, by Application 2020 & 2033
- Table 69: South Africa Agricultural Sprayers Revenue (billion) Forecast, by Application 2020 & 2033
- Table 70: South Africa Agricultural Sprayers Volume (K) Forecast, by Application 2020 & 2033
- Table 71: Rest of Middle East & Africa Agricultural Sprayers Revenue (billion) Forecast, by Application 2020 & 2033
- Table 72: Rest of Middle East & Africa Agricultural Sprayers Volume (K) Forecast, by Application 2020 & 2033
- Table 73: Global Agricultural Sprayers Revenue billion Forecast, by Application 2020 & 2033
- Table 74: Global Agricultural Sprayers Volume K Forecast, by Application 2020 & 2033
- Table 75: Global Agricultural Sprayers Revenue billion Forecast, by Types 2020 & 2033
- Table 76: Global Agricultural Sprayers Volume K Forecast, by Types 2020 & 2033
- Table 77: Global Agricultural Sprayers Revenue billion Forecast, by Country 2020 & 2033
- Table 78: Global Agricultural Sprayers Volume K Forecast, by Country 2020 & 2033
- Table 79: China Agricultural Sprayers Revenue (billion) Forecast, by Application 2020 & 2033
- Table 80: China Agricultural Sprayers Volume (K) Forecast, by Application 2020 & 2033
- Table 81: India Agricultural Sprayers Revenue (billion) Forecast, by Application 2020 & 2033
- Table 82: India Agricultural Sprayers Volume (K) Forecast, by Application 2020 & 2033
- Table 83: Japan Agricultural Sprayers Revenue (billion) Forecast, by Application 2020 & 2033
- Table 84: Japan Agricultural Sprayers Volume (K) Forecast, by Application 2020 & 2033
- Table 85: South Korea Agricultural Sprayers Revenue (billion) Forecast, by Application 2020 & 2033
- Table 86: South Korea Agricultural Sprayers Volume (K) Forecast, by Application 2020 & 2033
- Table 87: ASEAN Agricultural Sprayers Revenue (billion) Forecast, by Application 2020 & 2033
- Table 88: ASEAN Agricultural Sprayers Volume (K) Forecast, by Application 2020 & 2033
- Table 89: Oceania Agricultural Sprayers Revenue (billion) Forecast, by Application 2020 & 2033
- Table 90: Oceania Agricultural Sprayers Volume (K) Forecast, by Application 2020 & 2033
- Table 91: Rest of Asia Pacific Agricultural Sprayers Revenue (billion) Forecast, by Application 2020 & 2033
- Table 92: Rest of Asia Pacific Agricultural Sprayers Volume (K) Forecast, by Application 2020 & 2033
Frequently Asked Questions
1. What is the projected Compound Annual Growth Rate (CAGR) of the Agricultural Sprayers?
The projected CAGR is approximately 3.5%.
2. Which companies are prominent players in the Agricultural Sprayers?
Key companies in the market include John Deere (US), CNH Industrial (UK), EXEL Industries (France), Bucher Industries (Switzerland), Mahindra & Mahindra (India), STIHL (Germany), AGCO Corporation (US), Kubota (Japan), Yamaha (Japan), BGroup S.p.A. (Italy), Amazonen-Werke (Germany), DJI (China).
3. What are the main segments of the Agricultural Sprayers?
The market segments include Application, Types.
4. Can you provide details about the market size?
The market size is estimated to be USD 8.4 billion as of 2022.
5. What are some drivers contributing to market growth?
N/A
6. What are the notable trends driving market growth?
N/A
7. Are there any restraints impacting market growth?
N/A
8. Can you provide examples of recent developments in the market?
N/A
9. What pricing options are available for accessing the report?
Pricing options include single-user, multi-user, and enterprise licenses priced at USD 3350.00, USD 5025.00, and USD 6700.00 respectively.
10. Is the market size provided in terms of value or volume?
The market size is provided in terms of value, measured in billion and volume, measured in K.
11. Are there any specific market keywords associated with the report?
Yes, the market keyword associated with the report is "Agricultural Sprayers," which aids in identifying and referencing the specific market segment covered.
12. How do I determine which pricing option suits my needs best?
The pricing options vary based on user requirements and access needs. Individual users may opt for single-user licenses, while businesses requiring broader access may choose multi-user or enterprise licenses for cost-effective access to the report.
13. Are there any additional resources or data provided in the Agricultural Sprayers report?
While the report offers comprehensive insights, it's advisable to review the specific contents or supplementary materials provided to ascertain if additional resources or data are available.
14. How can I stay updated on further developments or reports in the Agricultural Sprayers?
To stay informed about further developments, trends, and reports in the Agricultural Sprayers, consider subscribing to industry newsletters, following relevant companies and organizations, or regularly checking reputable industry news sources and publications.
Methodology
Step 1 - Identification of Relevant Samples Size from Population Database


Step 2 - Approaches for Defining Global Market Size (Value, Volume* & Price*)

Note*: In applicable scenarios
Step 3 - Data Sources
Primary Research
- Web Analytics
- Survey Reports
- Research Institute
- Latest Research Reports
- Opinion Leaders
Secondary Research
- Annual Reports
- White Paper
- Latest Press Release
- Industry Association
- Paid Database
- Investor Presentations

Step 4 - Data Triangulation
Involves using different sources of information in order to increase the validity of a study
These sources are likely to be stakeholders in a program - participants, other researchers, program staff, other community members, and so on.
Then we put all data in single framework & apply various statistical tools to find out the dynamic on the market.
During the analysis stage, feedback from the stakeholder groups would be compared to determine areas of agreement as well as areas of divergence