

Key Insights
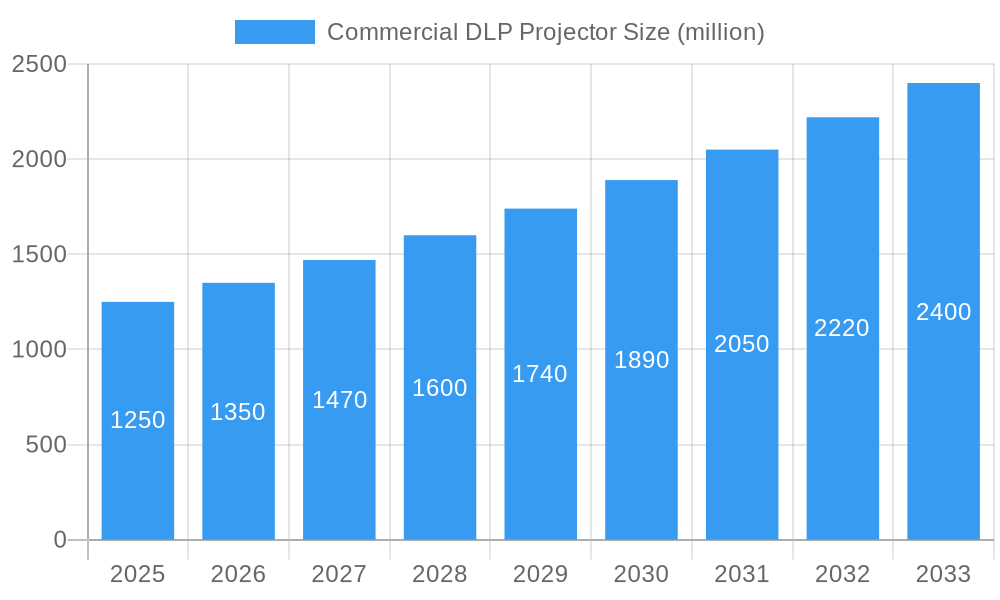
The global Commercial DLP Projector market is projected for substantial growth, expected to reach a market size of 10.71 billion by 2025. A compelling Compound Annual Growth Rate (CAGR) of 13.19% is anticipated between 2025 and 2033. This expansion is driven by the increasing need for high-definition visual solutions across diverse commercial sectors. Key contributors include the Enterprise sector, adopting advanced presentation tools for boardrooms and collaborative spaces, and the Education sector, utilizing DLP projectors for immersive and interactive learning. The Cinema segment remains a robust market, with continuous investment in digital projection technology for superior quality.
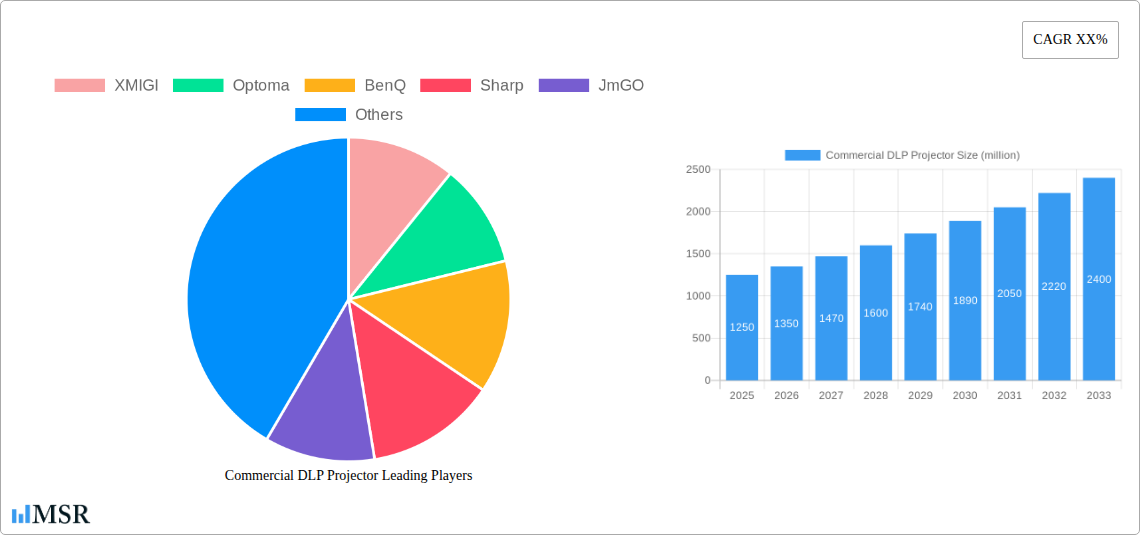
Commercial DLP Projector Market Size (In Billion)
Market evolution is influenced by continuous innovation in DLP technology, delivering projectors with superior brightness, 4K resolution, and enhanced color accuracy. The integration of smart features, such as wireless connectivity and IoT capabilities, is also boosting appeal. Potential restraints include the initial cost of high-end DLP projectors and competition from alternative display technologies like LED screens and flat panels in specific applications. Nevertheless, DLP's inherent advantages in brightness, contrast, and durability are expected to secure its market standing.
Commercial DLP Projector Company Market Share
Unlocking the Future of Visual Display: Comprehensive Report on the Global Commercial DLP Projector Market (2019-2033)
This in-depth commercial DLP projector market report provides an authoritative analysis of a dynamic and rapidly evolving industry. Covering the historical period of 2019-2024, the base year of 2025, and extending through an extensive forecast period of 2025-2033, this study delves into the intricate forces shaping the global DLP projector landscape. Discover key market insights, emerging trends, and strategic opportunities for enterprise, education, and cinema applications, including the latest 1-chip DLP projector and 3-chip DLP projector innovations. This report is an essential resource for industry stakeholders, investors, and decision-makers seeking to navigate the competitive projector market.
Commercial DLP Projector Market Concentration & Dynamics
The commercial DLP projector market exhibits a moderate to high level of concentration, with a significant portion of the market share held by established global players. Key companies like Optoma, BenQ, and Epson are actively engaged in intense competition, driving innovation and influencing market dynamics. The innovation ecosystem is characterized by continuous advancements in resolution (4K UHD), brightness (lumens), laser technology, and smart features. Regulatory frameworks primarily focus on energy efficiency and safety standards, which, while generally supportive, can influence product development cycles. The availability of substitute products, such as large-format displays and interactive whiteboards, presents a constant challenge, necessitating a focus on DLP projectors' unique advantages like large screen sizes, portability, and cost-effectiveness for specific applications. End-user trends are shifting towards demand for higher image quality, ease of integration, and enhanced connectivity in enterprise solutions and educational technology. Mergers and Acquisitions (M&A) activities have been strategic, aimed at expanding product portfolios, geographical reach, or acquiring innovative technologies, with an estimated M&A deal count of 5-10 significant transactions annually during the historical period.
Commercial DLP Projector Industry Insights & Trends
The global commercial DLP projector market is poised for robust expansion, driven by a confluence of technological advancements, increasing adoption across diverse sectors, and evolving user demands. The market size was estimated at $6,500 million in the base year 2025, with projections indicating a compound annual growth rate (CAGR) of approximately 7.5% throughout the forecast period (2025-2033). Key growth drivers include the escalating need for immersive visual experiences in corporate environments for presentations, video conferencing, and training, as well as the persistent demand for engaging learning tools in educational institutions, from K-12 to higher education. Technological disruptions are at the forefront, with the widespread integration of laser light sources offering superior brightness, color accuracy, and extended lifespan compared to traditional lamp-based projectors, significantly reducing maintenance costs. The advancement of 4K UHD resolution is becoming a standard expectation, delivering unparalleled clarity and detail essential for professional applications. Furthermore, the rise of smart projectors with integrated operating systems, wireless connectivity, and AI-powered features is transforming user interaction and convenience. Evolving consumer behaviors are also playing a crucial role, with a growing preference for flexible, scalable, and cost-effective display solutions that can adapt to various room sizes and lighting conditions. The expansion of the cinema projector market, particularly in emerging economies, and the increasing use of projectors in digital signage and event production further contribute to the market's upward trajectory.
Key Markets & Segments Leading Commercial DLP Projector
The commercial DLP projector market is led by the Asia-Pacific region, driven by rapid economic growth, significant investments in infrastructure, and a burgeoning demand for advanced visual technologies across its developing economies. Within this region, China and India stand out as dominant countries due to their large populations, expanding corporate sectors, and a considerable push towards digitizing educational systems.
- Dominant Segment Analysis:
- Application: Enterprise: This segment represents the largest share of the market, fueled by the increasing adoption of projectors for boardrooms, conference halls, training rooms, and collaborative workspaces. The need for high-quality, reliable projectors for critical business presentations, data visualization, and remote collaboration solutions significantly bolsters this segment's growth. Economic growth and the emphasis on digitalization in businesses are key drivers here.
- Application: Education: The education sector is another significant growth engine. As schools and universities globally embrace digital learning initiatives, demand for interactive and engaging projectors for classrooms, lecture halls, and auditoriums is soaring. Government initiatives supporting educational technology upgrades and the pursuit of enhanced learning outcomes are crucial accelerators. The market for projectors in higher education and professional training is particularly strong.
- Types: 1-Chip DLP Projector: While 3-chip DLP projectors offer superior color performance and brightness for high-end cinematic and professional applications, 1-chip DLP projectors continue to dominate the broader commercial market due to their cost-effectiveness, portability, and suitability for a wide range of everyday business and educational needs. Their competitive pricing makes them accessible to a larger user base, driving volume sales. Technological advancements in 1-chip DLP have also improved their performance, narrowing the gap with their 3-chip counterparts in many applications.
The cinema segment, while smaller in volume, is characterized by very high-value sales of advanced 3-chip DLP projectors, driven by the demand for premium viewing experiences in multiplexes and independent cinemas. The "Others" segment, encompassing applications like digital signage, event production, and museum exhibits, is also showing promising growth, driven by the increasing use of large-format, dynamic displays.
Commercial DLP Projector Product Developments
Recent product developments in the commercial DLP projector market are characterized by a strong emphasis on enhanced imaging capabilities and user convenience. Innovations such as 4K UHD resolution, with an estimated 45% increase in adoption over the historical period, are becoming standard, delivering unparalleled detail and sharpness. The transition to laser light sources is a significant trend, offering exceptional brightness levels, vibrant color reproduction, and an extended lifespan of up to 20,000 hours, drastically reducing maintenance costs. Furthermore, the integration of smart features, including Wi-Fi and Bluetooth connectivity, built-in operating systems, and support for popular streaming services, is transforming projectors into versatile entertainment and presentation hubs. Manufacturers are also focusing on improving energy efficiency and reducing the environmental footprint of their products.
Challenges in the Commercial DLP Projector Market
Despite the positive growth trajectory, the commercial DLP projector market faces several challenges. Intense competition from alternative display technologies, particularly large-format LEDs and interactive flat-panel displays, continues to exert price pressure and necessitate continuous innovation. Supply chain disruptions, exacerbated by global events, can impact the availability of components and lead to increased manufacturing costs. Furthermore, the cost of advanced technologies, such as high-resolution sensors and laser diodes, can be a barrier to entry for some smaller businesses and educational institutions, limiting market penetration. Evolving energy efficiency regulations also require ongoing product redesign and investment. Quantifiable impacts include an estimated 5-10% increase in production costs due to component shortages during peak disruptions.
Forces Driving Commercial DLP Projector Growth
Several powerful forces are driving the growth of the commercial DLP projector market. Technological advancements, particularly in laser illumination and 4K resolution, are significantly enhancing image quality and user experience, making DLP projectors more attractive for a wider range of applications. The increasing adoption of digital learning platforms and the need for engaging visual aids in educational settings are creating substantial demand. Similarly, the push for more immersive and effective corporate communication and collaboration tools is boosting adoption in the enterprise sector. Furthermore, the growing popularity of large-format displays in public spaces, events, and digital signage applications represents a significant growth avenue. The global expansion of the entertainment industry and the demand for premium viewing experiences in cinemas also contribute to market growth.
Challenges in the Commercial DLP Projector Market
Long-term growth catalysts for the commercial DLP projector market lie in continued innovation and strategic market expansion. The development of more compact, portable, and energy-efficient projectors will broaden their appeal and accessibility. Further integration of AI-powered features for enhanced usability, such as automatic keystone correction and intelligent content optimization, will be crucial. Partnerships and collaborations between projector manufacturers and software developers can unlock new application possibilities and create integrated ecosystems. The growing demand for projectors in niche markets like virtual reality (VR) and augmented reality (AR) experiences, as well as their application in interactive installations and simulations, present significant future growth potential. Expansion into emerging economies with a strong focus on infrastructure development and technology adoption will also be a key driver.
Emerging Opportunities in Commercial DLP Projector
Emerging opportunities in the commercial DLP projector market are diverse and promising. The burgeoning demand for interactive and collaborative learning tools in online education and hybrid learning environments presents a significant avenue. The increasing use of projectors for immersive gaming experiences and home entertainment systems is another growing segment. As the Metaverse and immersive digital environments gain traction, projectors capable of delivering high-fidelity, large-scale visuals will become increasingly vital. The development of ultra-short-throw projectors that can create massive images from very close distances is opening up new possibilities for space-constrained environments. Furthermore, the application of DLP projectors in industrial settings for training simulations, design reviews, and quality control offers substantial untapped potential.
Leading Players in the Commercial DLP Projector Sector
- XMIGI
- Optoma
- BenQ
- Sharp
- JmGO
- Acer
- BARCO
- Appotronics Corporation
- Vivitek
- ViewSonic
- LG
- Dangbei
- Panasonic
- JVC
- Mitsubishi Electric
- Honghe Tech
- Canon
- MI
- Christie
- INFocus
- Digital Projection
- ASUS
- Acto
- Boxlight
- Eiki Industrial
Key Milestones in Commercial DLP Projector Industry
- 2019: Introduction of widespread 4K UHD resolution DLP projectors for commercial applications.
- 2020: Increased focus on laser light source technology for enhanced brightness and longevity.
- 2021: Significant growth in adoption for remote work and online education solutions.
- 2022: Advancements in smart projector features, including integrated OS and AI capabilities.
- 2023: Growing demand for ultra-short-throw projectors in smaller spaces.
- 2024: Continued innovation in color accuracy and contrast ratios for professional visual displays.
- 2025: Expected surge in adoption of advanced DLP projectors in emerging economies.
- 2026-2033: Anticipated breakthroughs in miniaturization, energy efficiency, and interactive display integration.
Strategic Outlook for Commercial DLP Projector Market
The strategic outlook for the commercial DLP projector market is characterized by continued innovation and a focus on value-added features. Growth accelerators will include the widespread adoption of laser technology, the evolution towards higher resolutions (beyond 4K), and the seamless integration of smart capabilities. Companies that can effectively cater to the increasing demand for interactive and collaborative solutions in enterprise and education sectors will gain a competitive edge. Expanding into emerging markets and exploring niche applications like immersive entertainment and industrial simulations will be crucial for long-term success. The market's future potential lies in its ability to deliver flexible, cost-effective, and high-performance visual display solutions that meet the evolving needs of a digitally transforming world.
Commercial DLP Projector Segmentation
-
1. Application
- 1.1. Enterprise
- 1.2. Education
- 1.3. Cinema
- 1.4. Others
-
2. Types
- 2.1. 1-Chip DLP Projector
- 2.2. 3-Chip DLP Projector
Commercial DLP Projector Segmentation By Geography
-
1. North America
- 1.1. United States
- 1.2. Canada
- 1.3. Mexico
-
2. South America
- 2.1. Brazil
- 2.2. Argentina
- 2.3. Rest of South America
-
3. Europe
- 3.1. United Kingdom
- 3.2. Germany
- 3.3. France
- 3.4. Italy
- 3.5. Spain
- 3.6. Russia
- 3.7. Benelux
- 3.8. Nordics
- 3.9. Rest of Europe
-
4. Middle East & Africa
- 4.1. Turkey
- 4.2. Israel
- 4.3. GCC
- 4.4. North Africa
- 4.5. South Africa
- 4.6. Rest of Middle East & Africa
-
5. Asia Pacific
- 5.1. China
- 5.2. India
- 5.3. Japan
- 5.4. South Korea
- 5.5. ASEAN
- 5.6. Oceania
- 5.7. Rest of Asia Pacific
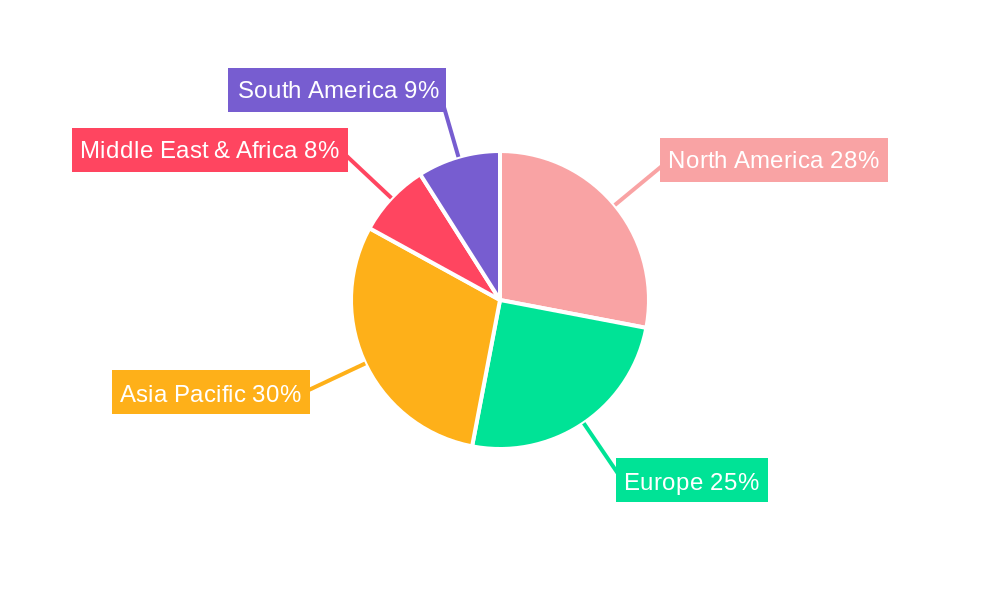
Commercial DLP Projector Regional Market Share
Geographic Coverage of Commercial DLP Projector
Commercial DLP Projector REPORT HIGHLIGHTS
| Aspects | Details |
|---|---|
| Study Period | 2020-2034 |
| Base Year | 2025 |
| Estimated Year | 2026 |
| Forecast Period | 2026-2034 |
| Historical Period | 2020-2025 |
| Growth Rate | CAGR of 13.19% from 2020-2034 |
| Segmentation |
|
Table of Contents
- 1. Introduction
- 1.1. Research Scope
- 1.2. Market Segmentation
- 1.3. Research Objective
- 1.4. Definitions and Assumptions
- 2. Executive Summary
- 2.1. Market Snapshot
- 3. Market Dynamics
- 3.1. Market Drivers
- 3.2. Market Restrains
- 3.3. Market Trends
- 3.4. Market Opportunities
- 4. Market Factor Analysis
- 4.1. Porters Five Forces
- 4.1.1. Bargaining Power of Suppliers
- 4.1.2. Bargaining Power of Buyers
- 4.1.3. Threat of New Entrants
- 4.1.4. Threat of Substitutes
- 4.1.5. Competitive Rivalry
- 4.2. PESTEL analysis
- 4.3. BCG Analysis
- 4.3.1. Stars (High Growth, High Market Share)
- 4.3.2. Cash Cows (Low Growth, High Market Share)
- 4.3.3. Question Mark (High Growth, Low Market Share)
- 4.3.4. Dogs (Low Growth, Low Market Share)
- 4.4. Ansoff Matrix Analysis
- 4.5. Supply Chain Analysis
- 4.6. Regulatory Landscape
- 4.7. Current Market Potential and Opportunity Assessment (TAM–SAM–SOM Framework)
- 4.8. MSR Analyst Note
- 4.1. Porters Five Forces
- 5. Market Analysis, Insights and Forecast 2021-2033
- 5.1. Market Analysis, Insights and Forecast - by Application
- 5.1.1. Enterprise
- 5.1.2. Education
- 5.1.3. Cinema
- 5.1.4. Others
- 5.2. Market Analysis, Insights and Forecast - by Types
- 5.2.1. 1-Chip DLP Projector
- 5.2.2. 3-Chip DLP Projector
- 5.3. Market Analysis, Insights and Forecast - by Region
- 5.3.1. North America
- 5.3.2. South America
- 5.3.3. Europe
- 5.3.4. Middle East & Africa
- 5.3.5. Asia Pacific
- 5.1. Market Analysis, Insights and Forecast - by Application
- 6. Global Commercial DLP Projector Analysis, Insights and Forecast, 2021-2033
- 6.1. Market Analysis, Insights and Forecast - by Application
- 6.1.1. Enterprise
- 6.1.2. Education
- 6.1.3. Cinema
- 6.1.4. Others
- 6.2. Market Analysis, Insights and Forecast - by Types
- 6.2.1. 1-Chip DLP Projector
- 6.2.2. 3-Chip DLP Projector
- 6.1. Market Analysis, Insights and Forecast - by Application
- 7. North America Commercial DLP Projector Analysis, Insights and Forecast, 2020-2032
- 7.1. Market Analysis, Insights and Forecast - by Application
- 7.1.1. Enterprise
- 7.1.2. Education
- 7.1.3. Cinema
- 7.1.4. Others
- 7.2. Market Analysis, Insights and Forecast - by Types
- 7.2.1. 1-Chip DLP Projector
- 7.2.2. 3-Chip DLP Projector
- 7.1. Market Analysis, Insights and Forecast - by Application
- 8. South America Commercial DLP Projector Analysis, Insights and Forecast, 2020-2032
- 8.1. Market Analysis, Insights and Forecast - by Application
- 8.1.1. Enterprise
- 8.1.2. Education
- 8.1.3. Cinema
- 8.1.4. Others
- 8.2. Market Analysis, Insights and Forecast - by Types
- 8.2.1. 1-Chip DLP Projector
- 8.2.2. 3-Chip DLP Projector
- 8.1. Market Analysis, Insights and Forecast - by Application
- 9. Europe Commercial DLP Projector Analysis, Insights and Forecast, 2020-2032
- 9.1. Market Analysis, Insights and Forecast - by Application
- 9.1.1. Enterprise
- 9.1.2. Education
- 9.1.3. Cinema
- 9.1.4. Others
- 9.2. Market Analysis, Insights and Forecast - by Types
- 9.2.1. 1-Chip DLP Projector
- 9.2.2. 3-Chip DLP Projector
- 9.1. Market Analysis, Insights and Forecast - by Application
- 10. Middle East & Africa Commercial DLP Projector Analysis, Insights and Forecast, 2020-2032
- 10.1. Market Analysis, Insights and Forecast - by Application
- 10.1.1. Enterprise
- 10.1.2. Education
- 10.1.3. Cinema
- 10.1.4. Others
- 10.2. Market Analysis, Insights and Forecast - by Types
- 10.2.1. 1-Chip DLP Projector
- 10.2.2. 3-Chip DLP Projector
- 10.1. Market Analysis, Insights and Forecast - by Application
- 11. Asia Pacific Commercial DLP Projector Analysis, Insights and Forecast, 2020-2032
- 11.1. Market Analysis, Insights and Forecast - by Application
- 11.1.1. Enterprise
- 11.1.2. Education
- 11.1.3. Cinema
- 11.1.4. Others
- 11.2. Market Analysis, Insights and Forecast - by Types
- 11.2.1. 1-Chip DLP Projector
- 11.2.2. 3-Chip DLP Projector
- 11.1. Market Analysis, Insights and Forecast - by Application
- 12. Competitive Analysis
- 12.1. Company Profiles
- 12.1.1 XMIGI
- 12.1.1.1. Company Overview
- 12.1.1.2. Products
- 12.1.1.3. Company Financials
- 12.1.1.4. SWOT Analysis
- 12.1.2 Optoma
- 12.1.2.1. Company Overview
- 12.1.2.2. Products
- 12.1.2.3. Company Financials
- 12.1.2.4. SWOT Analysis
- 12.1.3 BenQ
- 12.1.3.1. Company Overview
- 12.1.3.2. Products
- 12.1.3.3. Company Financials
- 12.1.3.4. SWOT Analysis
- 12.1.4 Sharp
- 12.1.4.1. Company Overview
- 12.1.4.2. Products
- 12.1.4.3. Company Financials
- 12.1.4.4. SWOT Analysis
- 12.1.5 JmGO
- 12.1.5.1. Company Overview
- 12.1.5.2. Products
- 12.1.5.3. Company Financials
- 12.1.5.4. SWOT Analysis
- 12.1.6 Acer
- 12.1.6.1. Company Overview
- 12.1.6.2. Products
- 12.1.6.3. Company Financials
- 12.1.6.4. SWOT Analysis
- 12.1.7 BARCO
- 12.1.7.1. Company Overview
- 12.1.7.2. Products
- 12.1.7.3. Company Financials
- 12.1.7.4. SWOT Analysis
- 12.1.8 Appotronics Corporation
- 12.1.8.1. Company Overview
- 12.1.8.2. Products
- 12.1.8.3. Company Financials
- 12.1.8.4. SWOT Analysis
- 12.1.9 Vivitek
- 12.1.9.1. Company Overview
- 12.1.9.2. Products
- 12.1.9.3. Company Financials
- 12.1.9.4. SWOT Analysis
- 12.1.10 ViewSonic
- 12.1.10.1. Company Overview
- 12.1.10.2. Products
- 12.1.10.3. Company Financials
- 12.1.10.4. SWOT Analysis
- 12.1.11 LG
- 12.1.11.1. Company Overview
- 12.1.11.2. Products
- 12.1.11.3. Company Financials
- 12.1.11.4. SWOT Analysis
- 12.1.12 Dangbei
- 12.1.12.1. Company Overview
- 12.1.12.2. Products
- 12.1.12.3. Company Financials
- 12.1.12.4. SWOT Analysis
- 12.1.13 Panasonic
- 12.1.13.1. Company Overview
- 12.1.13.2. Products
- 12.1.13.3. Company Financials
- 12.1.13.4. SWOT Analysis
- 12.1.14 JVC
- 12.1.14.1. Company Overview
- 12.1.14.2. Products
- 12.1.14.3. Company Financials
- 12.1.14.4. SWOT Analysis
- 12.1.15 Mitsubishi Electric
- 12.1.15.1. Company Overview
- 12.1.15.2. Products
- 12.1.15.3. Company Financials
- 12.1.15.4. SWOT Analysis
- 12.1.16 Honghe Tech
- 12.1.16.1. Company Overview
- 12.1.16.2. Products
- 12.1.16.3. Company Financials
- 12.1.16.4. SWOT Analysis
- 12.1.17 Canon
- 12.1.17.1. Company Overview
- 12.1.17.2. Products
- 12.1.17.3. Company Financials
- 12.1.17.4. SWOT Analysis
- 12.1.18 MI
- 12.1.18.1. Company Overview
- 12.1.18.2. Products
- 12.1.18.3. Company Financials
- 12.1.18.4. SWOT Analysis
- 12.1.19 Christie
- 12.1.19.1. Company Overview
- 12.1.19.2. Products
- 12.1.19.3. Company Financials
- 12.1.19.4. SWOT Analysis
- 12.1.20 INFocus
- 12.1.20.1. Company Overview
- 12.1.20.2. Products
- 12.1.20.3. Company Financials
- 12.1.20.4. SWOT Analysis
- 12.1.21 Digital Projection
- 12.1.21.1. Company Overview
- 12.1.21.2. Products
- 12.1.21.3. Company Financials
- 12.1.21.4. SWOT Analysis
- 12.1.22 ASUS
- 12.1.22.1. Company Overview
- 12.1.22.2. Products
- 12.1.22.3. Company Financials
- 12.1.22.4. SWOT Analysis
- 12.1.23 Acto
- 12.1.23.1. Company Overview
- 12.1.23.2. Products
- 12.1.23.3. Company Financials
- 12.1.23.4. SWOT Analysis
- 12.1.24 Boxlight
- 12.1.24.1. Company Overview
- 12.1.24.2. Products
- 12.1.24.3. Company Financials
- 12.1.24.4. SWOT Analysis
- 12.1.25 Eiki Industrial
- 12.1.25.1. Company Overview
- 12.1.25.2. Products
- 12.1.25.3. Company Financials
- 12.1.25.4. SWOT Analysis
- 12.1.1 XMIGI
- 12.2. Market Entropy
- 12.2.1 Company's Key Areas Served
- 12.2.2 Recent Developments
- 12.3. Company Market Share Analysis 2025
- 12.3.1 Top 5 Companies Market Share Analysis
- 12.3.2 Top 3 Companies Market Share Analysis
- 12.4. List of Potential Customers
- 13. Research Methodology
List of Figures
- Figure 1: Global Commercial DLP Projector Revenue Breakdown (billion, %) by Region 2025 & 2033
- Figure 2: Global Commercial DLP Projector Volume Breakdown (K, %) by Region 2025 & 2033
- Figure 3: North America Commercial DLP Projector Revenue (billion), by Application 2025 & 2033
- Figure 4: North America Commercial DLP Projector Volume (K), by Application 2025 & 2033
- Figure 5: North America Commercial DLP Projector Revenue Share (%), by Application 2025 & 2033
- Figure 6: North America Commercial DLP Projector Volume Share (%), by Application 2025 & 2033
- Figure 7: North America Commercial DLP Projector Revenue (billion), by Types 2025 & 2033
- Figure 8: North America Commercial DLP Projector Volume (K), by Types 2025 & 2033
- Figure 9: North America Commercial DLP Projector Revenue Share (%), by Types 2025 & 2033
- Figure 10: North America Commercial DLP Projector Volume Share (%), by Types 2025 & 2033
- Figure 11: North America Commercial DLP Projector Revenue (billion), by Country 2025 & 2033
- Figure 12: North America Commercial DLP Projector Volume (K), by Country 2025 & 2033
- Figure 13: North America Commercial DLP Projector Revenue Share (%), by Country 2025 & 2033
- Figure 14: North America Commercial DLP Projector Volume Share (%), by Country 2025 & 2033
- Figure 15: South America Commercial DLP Projector Revenue (billion), by Application 2025 & 2033
- Figure 16: South America Commercial DLP Projector Volume (K), by Application 2025 & 2033
- Figure 17: South America Commercial DLP Projector Revenue Share (%), by Application 2025 & 2033
- Figure 18: South America Commercial DLP Projector Volume Share (%), by Application 2025 & 2033
- Figure 19: South America Commercial DLP Projector Revenue (billion), by Types 2025 & 2033
- Figure 20: South America Commercial DLP Projector Volume (K), by Types 2025 & 2033
- Figure 21: South America Commercial DLP Projector Revenue Share (%), by Types 2025 & 2033
- Figure 22: South America Commercial DLP Projector Volume Share (%), by Types 2025 & 2033
- Figure 23: South America Commercial DLP Projector Revenue (billion), by Country 2025 & 2033
- Figure 24: South America Commercial DLP Projector Volume (K), by Country 2025 & 2033
- Figure 25: South America Commercial DLP Projector Revenue Share (%), by Country 2025 & 2033
- Figure 26: South America Commercial DLP Projector Volume Share (%), by Country 2025 & 2033
- Figure 27: Europe Commercial DLP Projector Revenue (billion), by Application 2025 & 2033
- Figure 28: Europe Commercial DLP Projector Volume (K), by Application 2025 & 2033
- Figure 29: Europe Commercial DLP Projector Revenue Share (%), by Application 2025 & 2033
- Figure 30: Europe Commercial DLP Projector Volume Share (%), by Application 2025 & 2033
- Figure 31: Europe Commercial DLP Projector Revenue (billion), by Types 2025 & 2033
- Figure 32: Europe Commercial DLP Projector Volume (K), by Types 2025 & 2033
- Figure 33: Europe Commercial DLP Projector Revenue Share (%), by Types 2025 & 2033
- Figure 34: Europe Commercial DLP Projector Volume Share (%), by Types 2025 & 2033
- Figure 35: Europe Commercial DLP Projector Revenue (billion), by Country 2025 & 2033
- Figure 36: Europe Commercial DLP Projector Volume (K), by Country 2025 & 2033
- Figure 37: Europe Commercial DLP Projector Revenue Share (%), by Country 2025 & 2033
- Figure 38: Europe Commercial DLP Projector Volume Share (%), by Country 2025 & 2033
- Figure 39: Middle East & Africa Commercial DLP Projector Revenue (billion), by Application 2025 & 2033
- Figure 40: Middle East & Africa Commercial DLP Projector Volume (K), by Application 2025 & 2033
- Figure 41: Middle East & Africa Commercial DLP Projector Revenue Share (%), by Application 2025 & 2033
- Figure 42: Middle East & Africa Commercial DLP Projector Volume Share (%), by Application 2025 & 2033
- Figure 43: Middle East & Africa Commercial DLP Projector Revenue (billion), by Types 2025 & 2033
- Figure 44: Middle East & Africa Commercial DLP Projector Volume (K), by Types 2025 & 2033
- Figure 45: Middle East & Africa Commercial DLP Projector Revenue Share (%), by Types 2025 & 2033
- Figure 46: Middle East & Africa Commercial DLP Projector Volume Share (%), by Types 2025 & 2033
- Figure 47: Middle East & Africa Commercial DLP Projector Revenue (billion), by Country 2025 & 2033
- Figure 48: Middle East & Africa Commercial DLP Projector Volume (K), by Country 2025 & 2033
- Figure 49: Middle East & Africa Commercial DLP Projector Revenue Share (%), by Country 2025 & 2033
- Figure 50: Middle East & Africa Commercial DLP Projector Volume Share (%), by Country 2025 & 2033
- Figure 51: Asia Pacific Commercial DLP Projector Revenue (billion), by Application 2025 & 2033
- Figure 52: Asia Pacific Commercial DLP Projector Volume (K), by Application 2025 & 2033
- Figure 53: Asia Pacific Commercial DLP Projector Revenue Share (%), by Application 2025 & 2033
- Figure 54: Asia Pacific Commercial DLP Projector Volume Share (%), by Application 2025 & 2033
- Figure 55: Asia Pacific Commercial DLP Projector Revenue (billion), by Types 2025 & 2033
- Figure 56: Asia Pacific Commercial DLP Projector Volume (K), by Types 2025 & 2033
- Figure 57: Asia Pacific Commercial DLP Projector Revenue Share (%), by Types 2025 & 2033
- Figure 58: Asia Pacific Commercial DLP Projector Volume Share (%), by Types 2025 & 2033
- Figure 59: Asia Pacific Commercial DLP Projector Revenue (billion), by Country 2025 & 2033
- Figure 60: Asia Pacific Commercial DLP Projector Volume (K), by Country 2025 & 2033
- Figure 61: Asia Pacific Commercial DLP Projector Revenue Share (%), by Country 2025 & 2033
- Figure 62: Asia Pacific Commercial DLP Projector Volume Share (%), by Country 2025 & 2033
List of Tables
- Table 1: Global Commercial DLP Projector Revenue billion Forecast, by Application 2020 & 2033
- Table 2: Global Commercial DLP Projector Volume K Forecast, by Application 2020 & 2033
- Table 3: Global Commercial DLP Projector Revenue billion Forecast, by Types 2020 & 2033
- Table 4: Global Commercial DLP Projector Volume K Forecast, by Types 2020 & 2033
- Table 5: Global Commercial DLP Projector Revenue billion Forecast, by Region 2020 & 2033
- Table 6: Global Commercial DLP Projector Volume K Forecast, by Region 2020 & 2033
- Table 7: Global Commercial DLP Projector Revenue billion Forecast, by Application 2020 & 2033
- Table 8: Global Commercial DLP Projector Volume K Forecast, by Application 2020 & 2033
- Table 9: Global Commercial DLP Projector Revenue billion Forecast, by Types 2020 & 2033
- Table 10: Global Commercial DLP Projector Volume K Forecast, by Types 2020 & 2033
- Table 11: Global Commercial DLP Projector Revenue billion Forecast, by Country 2020 & 2033
- Table 12: Global Commercial DLP Projector Volume K Forecast, by Country 2020 & 2033
- Table 13: United States Commercial DLP Projector Revenue (billion) Forecast, by Application 2020 & 2033
- Table 14: United States Commercial DLP Projector Volume (K) Forecast, by Application 2020 & 2033
- Table 15: Canada Commercial DLP Projector Revenue (billion) Forecast, by Application 2020 & 2033
- Table 16: Canada Commercial DLP Projector Volume (K) Forecast, by Application 2020 & 2033
- Table 17: Mexico Commercial DLP Projector Revenue (billion) Forecast, by Application 2020 & 2033
- Table 18: Mexico Commercial DLP Projector Volume (K) Forecast, by Application 2020 & 2033
- Table 19: Global Commercial DLP Projector Revenue billion Forecast, by Application 2020 & 2033
- Table 20: Global Commercial DLP Projector Volume K Forecast, by Application 2020 & 2033
- Table 21: Global Commercial DLP Projector Revenue billion Forecast, by Types 2020 & 2033
- Table 22: Global Commercial DLP Projector Volume K Forecast, by Types 2020 & 2033
- Table 23: Global Commercial DLP Projector Revenue billion Forecast, by Country 2020 & 2033
- Table 24: Global Commercial DLP Projector Volume K Forecast, by Country 2020 & 2033
- Table 25: Brazil Commercial DLP Projector Revenue (billion) Forecast, by Application 2020 & 2033
- Table 26: Brazil Commercial DLP Projector Volume (K) Forecast, by Application 2020 & 2033
- Table 27: Argentina Commercial DLP Projector Revenue (billion) Forecast, by Application 2020 & 2033
- Table 28: Argentina Commercial DLP Projector Volume (K) Forecast, by Application 2020 & 2033
- Table 29: Rest of South America Commercial DLP Projector Revenue (billion) Forecast, by Application 2020 & 2033
- Table 30: Rest of South America Commercial DLP Projector Volume (K) Forecast, by Application 2020 & 2033
- Table 31: Global Commercial DLP Projector Revenue billion Forecast, by Application 2020 & 2033
- Table 32: Global Commercial DLP Projector Volume K Forecast, by Application 2020 & 2033
- Table 33: Global Commercial DLP Projector Revenue billion Forecast, by Types 2020 & 2033
- Table 34: Global Commercial DLP Projector Volume K Forecast, by Types 2020 & 2033
- Table 35: Global Commercial DLP Projector Revenue billion Forecast, by Country 2020 & 2033
- Table 36: Global Commercial DLP Projector Volume K Forecast, by Country 2020 & 2033
- Table 37: United Kingdom Commercial DLP Projector Revenue (billion) Forecast, by Application 2020 & 2033
- Table 38: United Kingdom Commercial DLP Projector Volume (K) Forecast, by Application 2020 & 2033
- Table 39: Germany Commercial DLP Projector Revenue (billion) Forecast, by Application 2020 & 2033
- Table 40: Germany Commercial DLP Projector Volume (K) Forecast, by Application 2020 & 2033
- Table 41: France Commercial DLP Projector Revenue (billion) Forecast, by Application 2020 & 2033
- Table 42: France Commercial DLP Projector Volume (K) Forecast, by Application 2020 & 2033
- Table 43: Italy Commercial DLP Projector Revenue (billion) Forecast, by Application 2020 & 2033
- Table 44: Italy Commercial DLP Projector Volume (K) Forecast, by Application 2020 & 2033
- Table 45: Spain Commercial DLP Projector Revenue (billion) Forecast, by Application 2020 & 2033
- Table 46: Spain Commercial DLP Projector Volume (K) Forecast, by Application 2020 & 2033
- Table 47: Russia Commercial DLP Projector Revenue (billion) Forecast, by Application 2020 & 2033
- Table 48: Russia Commercial DLP Projector Volume (K) Forecast, by Application 2020 & 2033
- Table 49: Benelux Commercial DLP Projector Revenue (billion) Forecast, by Application 2020 & 2033
- Table 50: Benelux Commercial DLP Projector Volume (K) Forecast, by Application 2020 & 2033
- Table 51: Nordics Commercial DLP Projector Revenue (billion) Forecast, by Application 2020 & 2033
- Table 52: Nordics Commercial DLP Projector Volume (K) Forecast, by Application 2020 & 2033
- Table 53: Rest of Europe Commercial DLP Projector Revenue (billion) Forecast, by Application 2020 & 2033
- Table 54: Rest of Europe Commercial DLP Projector Volume (K) Forecast, by Application 2020 & 2033
- Table 55: Global Commercial DLP Projector Revenue billion Forecast, by Application 2020 & 2033
- Table 56: Global Commercial DLP Projector Volume K Forecast, by Application 2020 & 2033
- Table 57: Global Commercial DLP Projector Revenue billion Forecast, by Types 2020 & 2033
- Table 58: Global Commercial DLP Projector Volume K Forecast, by Types 2020 & 2033
- Table 59: Global Commercial DLP Projector Revenue billion Forecast, by Country 2020 & 2033
- Table 60: Global Commercial DLP Projector Volume K Forecast, by Country 2020 & 2033
- Table 61: Turkey Commercial DLP Projector Revenue (billion) Forecast, by Application 2020 & 2033
- Table 62: Turkey Commercial DLP Projector Volume (K) Forecast, by Application 2020 & 2033
- Table 63: Israel Commercial DLP Projector Revenue (billion) Forecast, by Application 2020 & 2033
- Table 64: Israel Commercial DLP Projector Volume (K) Forecast, by Application 2020 & 2033
- Table 65: GCC Commercial DLP Projector Revenue (billion) Forecast, by Application 2020 & 2033
- Table 66: GCC Commercial DLP Projector Volume (K) Forecast, by Application 2020 & 2033
- Table 67: North Africa Commercial DLP Projector Revenue (billion) Forecast, by Application 2020 & 2033
- Table 68: North Africa Commercial DLP Projector Volume (K) Forecast, by Application 2020 & 2033
- Table 69: South Africa Commercial DLP Projector Revenue (billion) Forecast, by Application 2020 & 2033
- Table 70: South Africa Commercial DLP Projector Volume (K) Forecast, by Application 2020 & 2033
- Table 71: Rest of Middle East & Africa Commercial DLP Projector Revenue (billion) Forecast, by Application 2020 & 2033
- Table 72: Rest of Middle East & Africa Commercial DLP Projector Volume (K) Forecast, by Application 2020 & 2033
- Table 73: Global Commercial DLP Projector Revenue billion Forecast, by Application 2020 & 2033
- Table 74: Global Commercial DLP Projector Volume K Forecast, by Application 2020 & 2033
- Table 75: Global Commercial DLP Projector Revenue billion Forecast, by Types 2020 & 2033
- Table 76: Global Commercial DLP Projector Volume K Forecast, by Types 2020 & 2033
- Table 77: Global Commercial DLP Projector Revenue billion Forecast, by Country 2020 & 2033
- Table 78: Global Commercial DLP Projector Volume K Forecast, by Country 2020 & 2033
- Table 79: China Commercial DLP Projector Revenue (billion) Forecast, by Application 2020 & 2033
- Table 80: China Commercial DLP Projector Volume (K) Forecast, by Application 2020 & 2033
- Table 81: India Commercial DLP Projector Revenue (billion) Forecast, by Application 2020 & 2033
- Table 82: India Commercial DLP Projector Volume (K) Forecast, by Application 2020 & 2033
- Table 83: Japan Commercial DLP Projector Revenue (billion) Forecast, by Application 2020 & 2033
- Table 84: Japan Commercial DLP Projector Volume (K) Forecast, by Application 2020 & 2033
- Table 85: South Korea Commercial DLP Projector Revenue (billion) Forecast, by Application 2020 & 2033
- Table 86: South Korea Commercial DLP Projector Volume (K) Forecast, by Application 2020 & 2033
- Table 87: ASEAN Commercial DLP Projector Revenue (billion) Forecast, by Application 2020 & 2033
- Table 88: ASEAN Commercial DLP Projector Volume (K) Forecast, by Application 2020 & 2033
- Table 89: Oceania Commercial DLP Projector Revenue (billion) Forecast, by Application 2020 & 2033
- Table 90: Oceania Commercial DLP Projector Volume (K) Forecast, by Application 2020 & 2033
- Table 91: Rest of Asia Pacific Commercial DLP Projector Revenue (billion) Forecast, by Application 2020 & 2033
- Table 92: Rest of Asia Pacific Commercial DLP Projector Volume (K) Forecast, by Application 2020 & 2033
Frequently Asked Questions
1. What is the projected Compound Annual Growth Rate (CAGR) of the Commercial DLP Projector?
The projected CAGR is approximately 13.19%.
2. Which companies are prominent players in the Commercial DLP Projector?
Key companies in the market include XMIGI, Optoma, BenQ, Sharp, JmGO, Acer, BARCO, Appotronics Corporation, Vivitek, ViewSonic, LG, Dangbei, Panasonic, JVC, Mitsubishi Electric, Honghe Tech, Canon, MI, Christie, INFocus, Digital Projection, ASUS, Acto, Boxlight, Eiki Industrial.
3. What are the main segments of the Commercial DLP Projector?
The market segments include Application, Types.
4. Can you provide details about the market size?
The market size is estimated to be USD 10.71 billion as of 2022.
5. What are some drivers contributing to market growth?
N/A
6. What are the notable trends driving market growth?
N/A
7. Are there any restraints impacting market growth?
N/A
8. Can you provide examples of recent developments in the market?
N/A
9. What pricing options are available for accessing the report?
Pricing options include single-user, multi-user, and enterprise licenses priced at USD 3950.00, USD 5925.00, and USD 7900.00 respectively.
10. Is the market size provided in terms of value or volume?
The market size is provided in terms of value, measured in billion and volume, measured in K.
11. Are there any specific market keywords associated with the report?
Yes, the market keyword associated with the report is "Commercial DLP Projector," which aids in identifying and referencing the specific market segment covered.
12. How do I determine which pricing option suits my needs best?
The pricing options vary based on user requirements and access needs. Individual users may opt for single-user licenses, while businesses requiring broader access may choose multi-user or enterprise licenses for cost-effective access to the report.
13. Are there any additional resources or data provided in the Commercial DLP Projector report?
While the report offers comprehensive insights, it's advisable to review the specific contents or supplementary materials provided to ascertain if additional resources or data are available.
14. How can I stay updated on further developments or reports in the Commercial DLP Projector?
To stay informed about further developments, trends, and reports in the Commercial DLP Projector, consider subscribing to industry newsletters, following relevant companies and organizations, or regularly checking reputable industry news sources and publications.
Methodology
Step 1 - Identification of Relevant Samples Size from Population Database


Step 2 - Approaches for Defining Global Market Size (Value, Volume* & Price*)

Note*: In applicable scenarios
Step 3 - Data Sources
Primary Research
- Web Analytics
- Survey Reports
- Research Institute
- Latest Research Reports
- Opinion Leaders
Secondary Research
- Annual Reports
- White Paper
- Latest Press Release
- Industry Association
- Paid Database
- Investor Presentations

Step 4 - Data Triangulation
Involves using different sources of information in order to increase the validity of a study
These sources are likely to be stakeholders in a program - participants, other researchers, program staff, other community members, and so on.
Then we put all data in single framework & apply various statistical tools to find out the dynamic on the market.
During the analysis stage, feedback from the stakeholder groups would be compared to determine areas of agreement as well as areas of divergence