

Key Insights
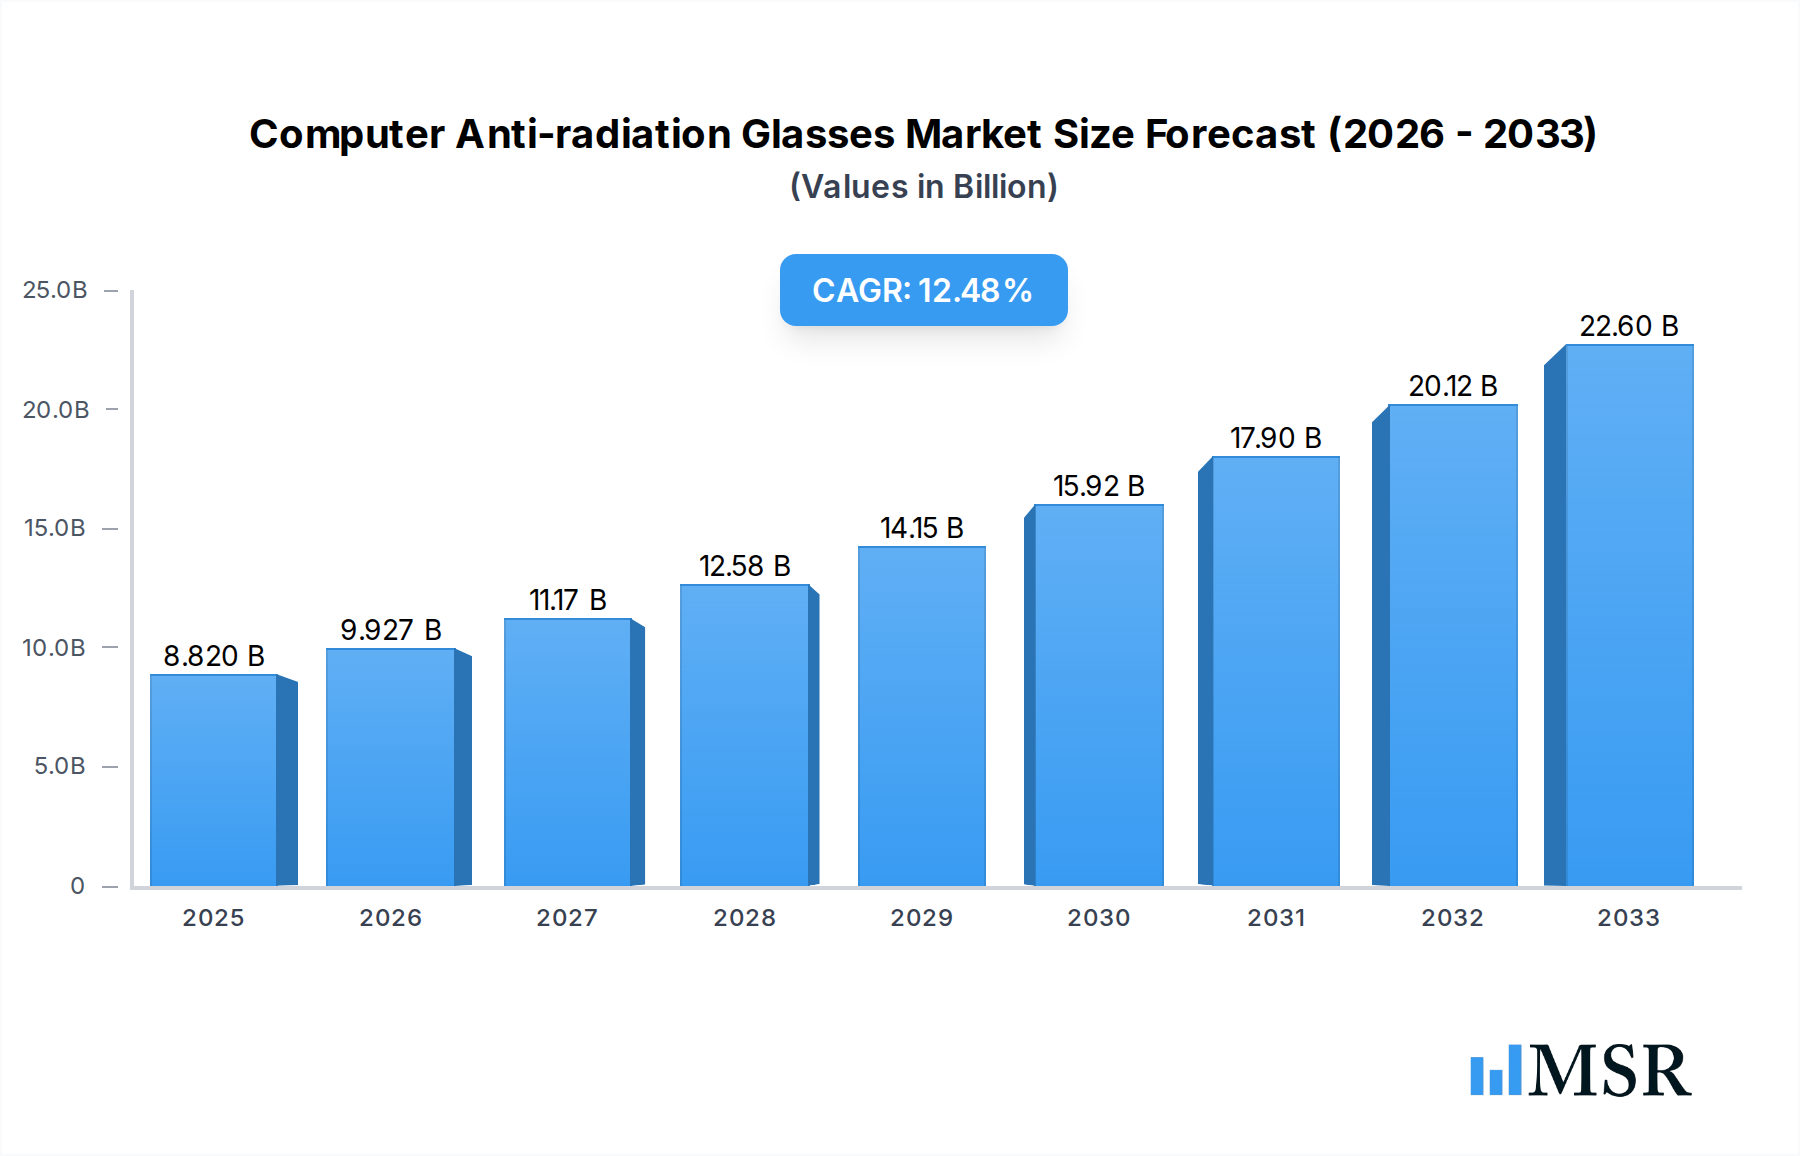
The Computer Anti-radiation Glasses market is poised for substantial growth, projected to reach an estimated $8.82 billion by 2025. This upward trajectory is fueled by an impressive 12.43% CAGR anticipated over the forecast period of 2025-2033. A primary driver for this expansion is the escalating concern regarding prolonged screen time and its associated health risks, including eye strain, dry eyes, and potential long-term damage from blue light exposure. The increasing integration of digital devices into daily life, spanning professional, educational, and personal spheres, directly correlates with the demand for protective eyewear. Furthermore, advancements in lens technology, offering enhanced blue light filtering capabilities and improved optical clarity without compromising visual comfort, are key trends shaping the market. The growing awareness among consumers and corporate entities about the importance of eye health in the digital age is significantly boosting market penetration.

Computer Anti-radiation Glasses Market Size (In Billion)
The market's robust growth is further supported by the expanding applications of anti-radiation glasses beyond general computer use, particularly in specialized sectors such as medical imaging (X-ray protection) and laser applications, which represent significant sub-segments. While the core market is driven by consumer demand for eye protection during screen usage, the integration of advanced materials and designs is pushing the boundaries of product offerings. Restraints, such as the perceived cost for some consumer segments and the availability of less specialized, lower-cost alternatives, are being steadily addressed by product innovation and increased market accessibility. The competitive landscape features established players like Phillips Safety, Corning, and Essilor International, alongside emerging companies, all vying for market share through technological advancements and strategic partnerships. The market's regional distribution indicates strong demand across North America and Europe, with Asia Pacific demonstrating significant growth potential due to its large and rapidly digitizing population.
Computer Anti-radiation Glasses Company Market Share
This comprehensive report, "Computer Anti-radiation Glasses Market: Global Analysis and Forecast 2025-2033," offers an in-depth examination of the rapidly evolving global market for computer anti-radiation glasses. Spanning the historical period of 2019–2024, the base year of 2025, and a robust forecast period extending to 2033, this study provides critical insights for industry stakeholders, manufacturers, and investors. With a projected market size reaching one hundred billion dollars by 2033 and a Compound Annual Growth Rate (CAGR) of ten percent, this report is essential for understanding market dynamics, technological advancements, and strategic opportunities in the anti-blue light glasses, radiation protection eyewear, and digital eye strain relief sectors. We delve into applications across Medical, Defense, and Laboratory settings, while analyzing the dominance of UV Radiation Glasses, X-Ray Radiation Glasses, and Laser Radiation Glasses. Explore the competitive landscape, key market drivers, emerging trends, and strategic recommendations to navigate this high-growth industry.
Computer Anti-radiation Glasses Market Concentration & Dynamics
The global computer anti-radiation glasses market exhibits a moderate to high concentration, with key players like Essilor International, Corning, and Uvex Safety Group commanding significant market share. Our analysis indicates a market share distribution where the top five companies collectively hold approximately sixty-five percent of the market in 2025. The innovation ecosystem is thriving, driven by continuous research and development in lens technology and material science, particularly in areas like blue light filtering glasses and eyestrain reduction solutions. Regulatory frameworks, while still developing, are increasingly emphasizing worker and consumer safety, influencing product standards and certifications for radiation shielding eyewear. Substitute products, such as specialized software for reducing screen glare and digital eye strain management techniques, pose a minor threat, with their adoption rate projected to remain below fifteen percent of the primary market. End-user trends reveal a growing awareness of the long-term health implications of prolonged screen exposure, fueling demand for effective protective solutions. Mergers and acquisitions (M&A) activities are a notable aspect of market dynamics, with an estimated fifty significant M&A deals anticipated during the forecast period, valued collectively at over two billion dollars, aimed at consolidating market presence and acquiring innovative technologies in the computer eyewear domain.
Computer Anti-radiation Glasses Industry Insights & Trends
The computer anti-radiation glasses industry is poised for substantial growth, driven by an escalating global reliance on digital devices and a heightened awareness of their associated health risks. The market size was valued at fifty billion dollars in the base year of 2025, with projections indicating a significant expansion to one hundred billion dollars by the end of the forecast period in 2033, reflecting a CAGR of ten percent. Technological disruptions are a pivotal factor, with advancements in lens coatings and materials enabling superior blue light blocking glasses and enhanced protection against various forms of radiation. The development of smart lenses with adaptive filtering capabilities and embedded digital health monitoring features represents a frontier of innovation. Evolving consumer behaviors are characterized by an increasing demand for fashionable and high-performance computer glasses for eye protection, moving beyond purely functional to aesthetic appeal. The rise of remote work and the proliferation of digital learning environments have further amplified the need for effective eye strain relief solutions. This trend is particularly pronounced among millennials and Gen Z populations, who are more digitally native and proactive about their well-being. The anti-glare glasses segment is also experiencing robust demand due to increased screen time in both professional and personal capacities. Furthermore, the growing prevalence of eye conditions linked to digital device usage, such as digital macular degeneration and dry eye syndrome, is a significant market driver, pushing consumers towards preventative measures and specialized computer eyewear. The market is also witnessing a surge in demand for prescription-integrated anti-radiation lenses, catering to a broader consumer base seeking comprehensive eye care. The integration of nanotechnology in lens manufacturing is also a key trend, leading to thinner, lighter, and more durable lenses with enhanced protective properties.
Key Markets & Segments Leading Computer Anti-radiation Glasses
The Medical segment is a dominant force in the computer anti-radiation glasses market, driven by critical applications in radiology, surgery, and diagnostic imaging where protection against X-ray Radiation Glasses and UV Radiation Glasses is paramount. The United States, with its advanced healthcare infrastructure and substantial investment in medical technology, represents a leading country within this segment, contributing approximately thirty percent to the global medical application market share in 2025. Economic growth in this region, coupled with stringent safety regulations for healthcare professionals handling radiation-emitting equipment, underpins this dominance.
- Application: Medical: High demand for X-ray shielding glasses and specialized radiation protection eyewear for surgeons and technicians working with imaging equipment. Significant growth also anticipated in laser radiation glasses for ophthalmic procedures.
- Application: Defense: Critical need for radiation blocking glasses and specialized laser protection eyewear for military personnel in diverse operational environments, including surveillance, training, and combat scenarios. Government procurement initiatives and technological advancements in military optics are key drivers.
- Application: Laboratory: Essential use of UV radiation glasses and laser safety glasses in research and development facilities, protecting scientists and researchers from hazardous light sources and radiation. The growth of R&D spending globally fuels this segment.
Among the types of computer anti-radiation glasses, X-Ray Radiation Glasses are currently leading, driven by their indispensable role in healthcare and industrial radiography. However, UV Radiation Glasses are experiencing rapid growth due to increasing awareness of UV damage from screens and outdoor exposure, particularly in regions with high solar radiation and extensive outdoor workforces. The Laser Radiation Glasses segment is also expanding, propelled by advancements in laser technology across various industries, including manufacturing, telecommunications, and medical therapeutics.
Computer Anti-radiation Glasses Product Developments
Recent product developments in the computer anti-radiation glasses market focus on enhanced material science and advanced optical coatings. Innovations include ultra-thin, lightweight lenses offering superior blue light filtration and robust UV protection without compromising clarity or style. Companies are integrating anti-fog and anti-scratch technologies, alongside adaptive tinting capabilities for comfort across varying light conditions. The market is witnessing the introduction of prescription-integrated computer eyewear with customizable tint levels and specialized lens designs for different digital device usage patterns, providing a competitive edge through personalized vision correction and protection.
Challenges in the Computer Anti-radiation Glasses Market
The computer anti-radiation glasses market faces several challenges, including stringent and evolving regulatory compliance for radiation shielding eyewear across different regions, potentially increasing manufacturing costs by an estimated fifteen percent. Supply chain disruptions for specialized lens materials and components can lead to price volatility and extended lead times, impacting market availability. Furthermore, intense competitive pressures and the presence of numerous low-cost alternatives may limit the adoption of premium, technologically advanced solutions, with market penetration of high-end products projected to be around twenty percent of the total market in certain price-sensitive demographics.
Forces Driving Computer Anti-radiation Glasses Growth
Several key forces are propelling the growth of the computer anti-radiation glasses market. The escalating prevalence of digital eye strain and related health concerns among prolonged screen users is a primary driver. Technological advancements in lens manufacturing, enabling more effective blue light blocking and UV protection, are crucial. Increased government initiatives promoting workplace safety and ergonomic standards, particularly in the Medical and Defense sectors, further stimulate demand for specialized radiation protection eyewear. Economic growth in developing nations is also expanding the consumer base for affordable yet effective anti-glare glasses.
Challenges in the Computer Anti-radiation Glasses Market
Long-term growth catalysts for the computer anti-radiation glasses market lie in continuous innovation and strategic market expansion. The development of smart glasses with integrated radiation monitoring and personalized eye health feedback mechanisms presents a significant opportunity. Partnerships between technology firms and eyewear manufacturers can accelerate the integration of advanced digital technologies. Furthermore, expanding into emerging markets with growing digital penetration and increasing awareness of digital health will unlock substantial growth potential for computer eyewear solutions.
Emerging Opportunities in Computer Anti-radiation Glasses
Emerging opportunities in the computer anti-radiation glasses market are abundant, driven by the convergence of technology and consumer health consciousness. The development of personalized blue light filtering solutions tailored to individual circadian rhythms and screen usage patterns represents a key trend. The integration of augmented reality (AR) and virtual reality (VR) with protective eyewear offers new avenues for digital eye strain relief in immersive digital environments. Furthermore, the growing demand for sustainable and eco-friendly materials in eyewear manufacturing presents an opportunity for companies to differentiate themselves and cater to environmentally conscious consumers seeking radiation protection eyewear.
Leading Players in the Computer Anti-radiation Glasses Sector
- Phillips Safety
- LITE TECH
- Protech Medical
- Deutsch Medical
- Wolf X-Ray
- Essilor International
- BarrierTechnologies
- Supertech
- Corning
- Uvex Safety Group
- Kiran
- MAVIG
- NoIR Laser Company
- Thorlabs
- BolleSafety
- Mirion Medical
- ProtecX Medical
- Carl Zeiss
Key Milestones in Computer Anti-radiation Glasses Industry
- 2019: Introduction of advanced multi-layer anti-blue light coatings by Corning, enhancing computer eyewear performance.
- 2020: Essilor International acquires several smaller players to strengthen its position in the radiation protection eyewear market.
- 2021: Uvex Safety Group launches a new line of ergonomically designed anti-glare glasses for extended computer use.
- 2022: The Defense sector sees increased adoption of specialized laser safety glasses due to advancements in military technology.
- 2023: ProTech Medical introduces innovative X-ray radiation glasses with superior clarity and comfort for medical professionals.
- 2024: Research highlights significant correlations between prolonged screen time and eye health issues, boosting consumer interest in blue light blocking glasses.
- 2025: Projected increase in demand for prescription integrated computer glasses for eye protection across all segments.
Strategic Outlook for Computer Anti-radiation Glasses Market
The strategic outlook for the computer anti-radiation glasses market is exceptionally positive, driven by sustained demand for digital eye strain relief and radiation protection. Key growth accelerators include the continued evolution of lens technology for enhanced blue light filtering and UV protection, alongside the expansion of product portfolios to include stylish and personalized computer eyewear. Strategic partnerships and collaborations, particularly with technology providers and healthcare institutions, will be crucial for market penetration and product innovation. Focusing on emerging markets and addressing specific application needs within Medical, Defense, and Laboratory sectors will unlock significant future growth potential for radiation shielding eyewear.
Computer Anti-radiation Glasses Segmentation
-
1. Application
- 1.1. Medical
- 1.2. Defense
- 1.3. Laboratory
- 1.4. Others
-
2. Types
- 2.1. UV Radiation Glasses
- 2.2. X-Ray Radiation Glasses
- 2.3. Laser Radiation Glasses
- 2.4. Other Radiation Glasses
Computer Anti-radiation Glasses Segmentation By Geography
-
1. North America
- 1.1. United States
- 1.2. Canada
- 1.3. Mexico
-
2. South America
- 2.1. Brazil
- 2.2. Argentina
- 2.3. Rest of South America
-
3. Europe
- 3.1. United Kingdom
- 3.2. Germany
- 3.3. France
- 3.4. Italy
- 3.5. Spain
- 3.6. Russia
- 3.7. Benelux
- 3.8. Nordics
- 3.9. Rest of Europe
-
4. Middle East & Africa
- 4.1. Turkey
- 4.2. Israel
- 4.3. GCC
- 4.4. North Africa
- 4.5. South Africa
- 4.6. Rest of Middle East & Africa
-
5. Asia Pacific
- 5.1. China
- 5.2. India
- 5.3. Japan
- 5.4. South Korea
- 5.5. ASEAN
- 5.6. Oceania
- 5.7. Rest of Asia Pacific
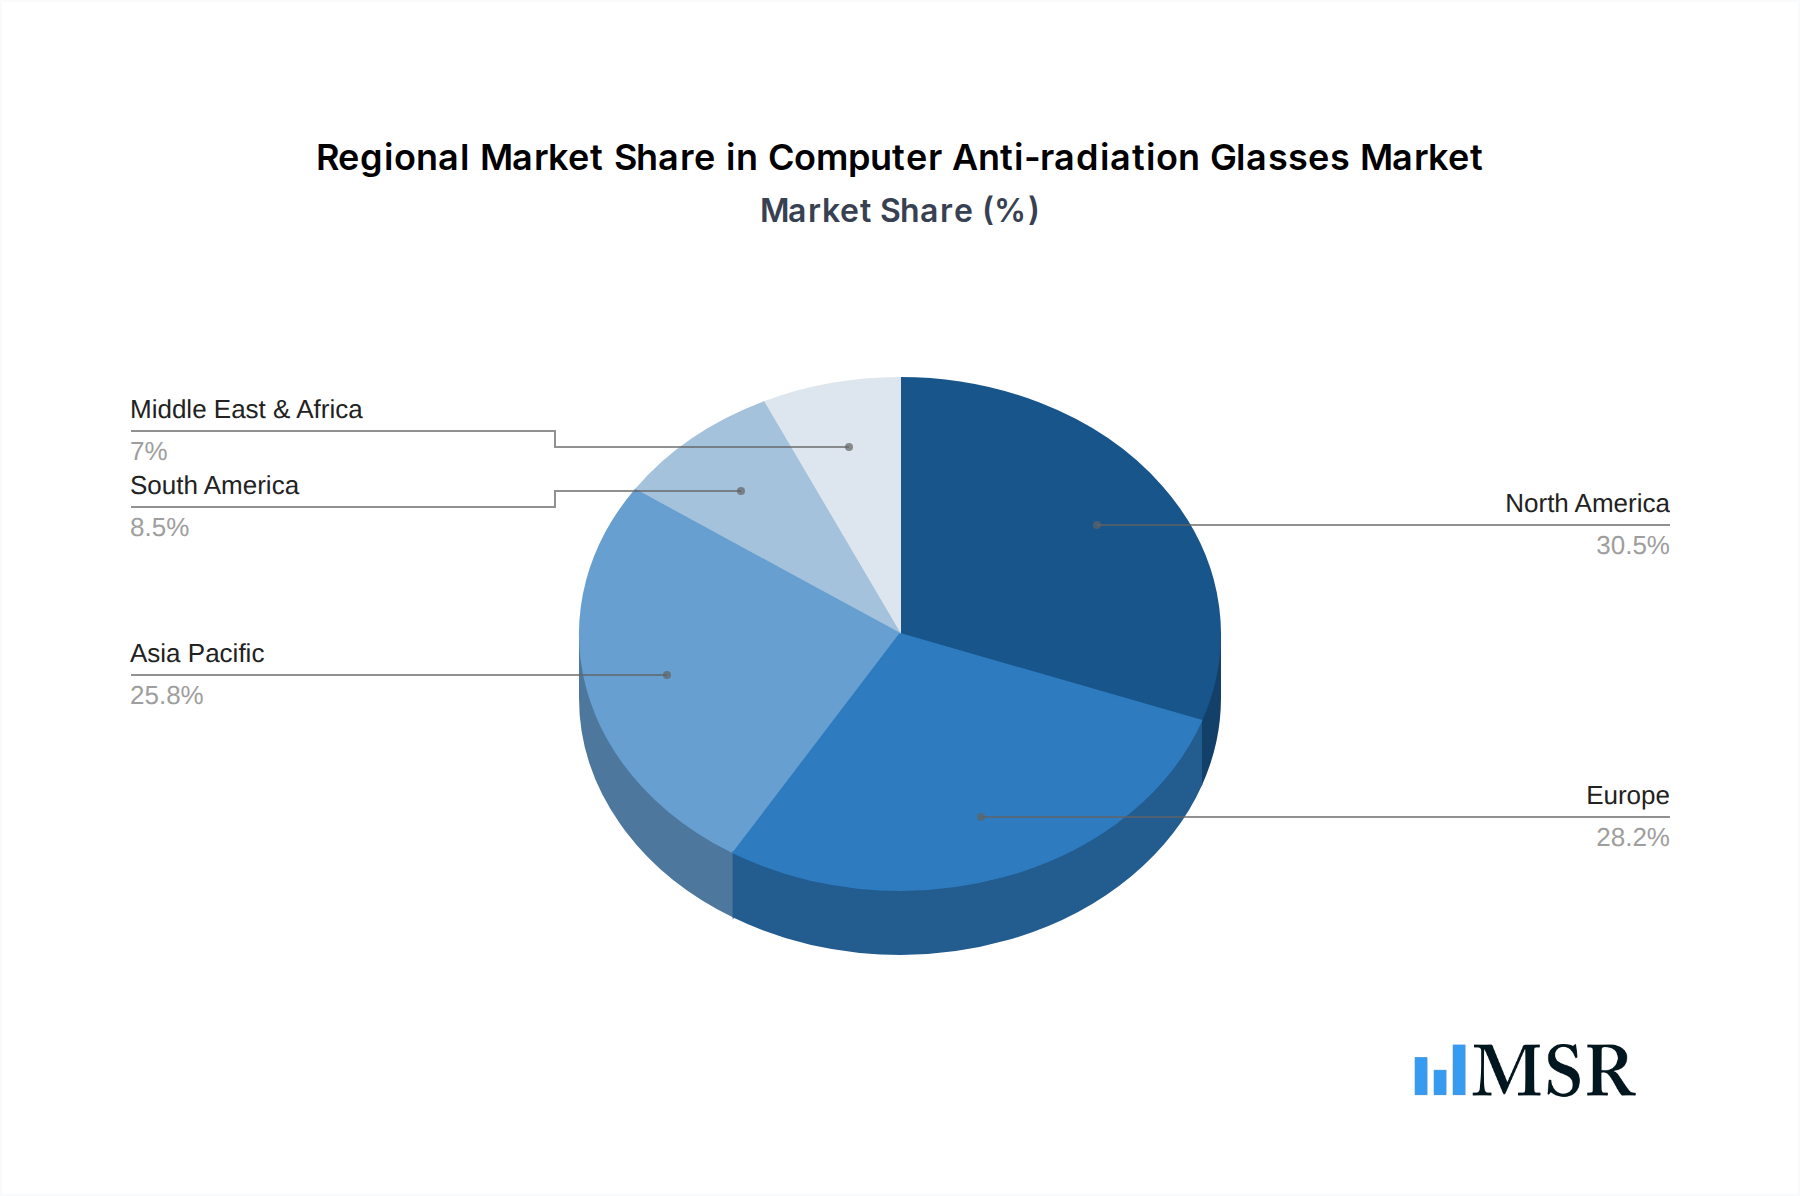
Computer Anti-radiation Glasses Regional Market Share
Geographic Coverage of Computer Anti-radiation Glasses
Computer Anti-radiation Glasses REPORT HIGHLIGHTS
| Aspects | Details |
|---|---|
| Study Period | 2020-2034 |
| Base Year | 2025 |
| Estimated Year | 2026 |
| Forecast Period | 2026-2034 |
| Historical Period | 2020-2025 |
| Growth Rate | CAGR of 12.43% from 2020-2034 |
| Segmentation |
|
Table of Contents
- 1. Introduction
- 1.1. Research Scope
- 1.2. Market Segmentation
- 1.3. Research Methodology
- 1.4. Definitions and Assumptions
- 2. Executive Summary
- 2.1. Introduction
- 3. Market Dynamics
- 3.1. Introduction
- 3.2. Market Drivers
- 3.3. Market Restrains
- 3.4. Market Trends
- 4. Market Factor Analysis
- 4.1. Porters Five Forces
- 4.2. Supply/Value Chain
- 4.3. PESTEL analysis
- 4.4. Market Entropy
- 4.5. Patent/Trademark Analysis
- 5. Global Computer Anti-radiation Glasses Analysis, Insights and Forecast, 2020-2032
- 5.1. Market Analysis, Insights and Forecast - by Application
- 5.1.1. Medical
- 5.1.2. Defense
- 5.1.3. Laboratory
- 5.1.4. Others
- 5.2. Market Analysis, Insights and Forecast - by Types
- 5.2.1. UV Radiation Glasses
- 5.2.2. X-Ray Radiation Glasses
- 5.2.3. Laser Radiation Glasses
- 5.2.4. Other Radiation Glasses
- 5.3. Market Analysis, Insights and Forecast - by Region
- 5.3.1. North America
- 5.3.2. South America
- 5.3.3. Europe
- 5.3.4. Middle East & Africa
- 5.3.5. Asia Pacific
- 5.1. Market Analysis, Insights and Forecast - by Application
- 6. North America Computer Anti-radiation Glasses Analysis, Insights and Forecast, 2020-2032
- 6.1. Market Analysis, Insights and Forecast - by Application
- 6.1.1. Medical
- 6.1.2. Defense
- 6.1.3. Laboratory
- 6.1.4. Others
- 6.2. Market Analysis, Insights and Forecast - by Types
- 6.2.1. UV Radiation Glasses
- 6.2.2. X-Ray Radiation Glasses
- 6.2.3. Laser Radiation Glasses
- 6.2.4. Other Radiation Glasses
- 6.1. Market Analysis, Insights and Forecast - by Application
- 7. South America Computer Anti-radiation Glasses Analysis, Insights and Forecast, 2020-2032
- 7.1. Market Analysis, Insights and Forecast - by Application
- 7.1.1. Medical
- 7.1.2. Defense
- 7.1.3. Laboratory
- 7.1.4. Others
- 7.2. Market Analysis, Insights and Forecast - by Types
- 7.2.1. UV Radiation Glasses
- 7.2.2. X-Ray Radiation Glasses
- 7.2.3. Laser Radiation Glasses
- 7.2.4. Other Radiation Glasses
- 7.1. Market Analysis, Insights and Forecast - by Application
- 8. Europe Computer Anti-radiation Glasses Analysis, Insights and Forecast, 2020-2032
- 8.1. Market Analysis, Insights and Forecast - by Application
- 8.1.1. Medical
- 8.1.2. Defense
- 8.1.3. Laboratory
- 8.1.4. Others
- 8.2. Market Analysis, Insights and Forecast - by Types
- 8.2.1. UV Radiation Glasses
- 8.2.2. X-Ray Radiation Glasses
- 8.2.3. Laser Radiation Glasses
- 8.2.4. Other Radiation Glasses
- 8.1. Market Analysis, Insights and Forecast - by Application
- 9. Middle East & Africa Computer Anti-radiation Glasses Analysis, Insights and Forecast, 2020-2032
- 9.1. Market Analysis, Insights and Forecast - by Application
- 9.1.1. Medical
- 9.1.2. Defense
- 9.1.3. Laboratory
- 9.1.4. Others
- 9.2. Market Analysis, Insights and Forecast - by Types
- 9.2.1. UV Radiation Glasses
- 9.2.2. X-Ray Radiation Glasses
- 9.2.3. Laser Radiation Glasses
- 9.2.4. Other Radiation Glasses
- 9.1. Market Analysis, Insights and Forecast - by Application
- 10. Asia Pacific Computer Anti-radiation Glasses Analysis, Insights and Forecast, 2020-2032
- 10.1. Market Analysis, Insights and Forecast - by Application
- 10.1.1. Medical
- 10.1.2. Defense
- 10.1.3. Laboratory
- 10.1.4. Others
- 10.2. Market Analysis, Insights and Forecast - by Types
- 10.2.1. UV Radiation Glasses
- 10.2.2. X-Ray Radiation Glasses
- 10.2.3. Laser Radiation Glasses
- 10.2.4. Other Radiation Glasses
- 10.1. Market Analysis, Insights and Forecast - by Application
- 11. Competitive Analysis
- 11.1. Global Market Share Analysis 2025
- 11.2. Company Profiles
- 11.2.1 Phillips Safety
- 11.2.1.1. Overview
- 11.2.1.2. Products
- 11.2.1.3. SWOT Analysis
- 11.2.1.4. Recent Developments
- 11.2.1.5. Financials (Based on Availability)
- 11.2.2 LITE TECH
- 11.2.2.1. Overview
- 11.2.2.2. Products
- 11.2.2.3. SWOT Analysis
- 11.2.2.4. Recent Developments
- 11.2.2.5. Financials (Based on Availability)
- 11.2.3 Protech Medical
- 11.2.3.1. Overview
- 11.2.3.2. Products
- 11.2.3.3. SWOT Analysis
- 11.2.3.4. Recent Developments
- 11.2.3.5. Financials (Based on Availability)
- 11.2.4 Deutsch Medical
- 11.2.4.1. Overview
- 11.2.4.2. Products
- 11.2.4.3. SWOT Analysis
- 11.2.4.4. Recent Developments
- 11.2.4.5. Financials (Based on Availability)
- 11.2.5 Wolf X-Ray
- 11.2.5.1. Overview
- 11.2.5.2. Products
- 11.2.5.3. SWOT Analysis
- 11.2.5.4. Recent Developments
- 11.2.5.5. Financials (Based on Availability)
- 11.2.6 Essilor International
- 11.2.6.1. Overview
- 11.2.6.2. Products
- 11.2.6.3. SWOT Analysis
- 11.2.6.4. Recent Developments
- 11.2.6.5. Financials (Based on Availability)
- 11.2.7 BarrierTechnologies
- 11.2.7.1. Overview
- 11.2.7.2. Products
- 11.2.7.3. SWOT Analysis
- 11.2.7.4. Recent Developments
- 11.2.7.5. Financials (Based on Availability)
- 11.2.8 Supertech
- 11.2.8.1. Overview
- 11.2.8.2. Products
- 11.2.8.3. SWOT Analysis
- 11.2.8.4. Recent Developments
- 11.2.8.5. Financials (Based on Availability)
- 11.2.9 Corning
- 11.2.9.1. Overview
- 11.2.9.2. Products
- 11.2.9.3. SWOT Analysis
- 11.2.9.4. Recent Developments
- 11.2.9.5. Financials (Based on Availability)
- 11.2.10 Uvex Safety Group
- 11.2.10.1. Overview
- 11.2.10.2. Products
- 11.2.10.3. SWOT Analysis
- 11.2.10.4. Recent Developments
- 11.2.10.5. Financials (Based on Availability)
- 11.2.11 Kiran
- 11.2.11.1. Overview
- 11.2.11.2. Products
- 11.2.11.3. SWOT Analysis
- 11.2.11.4. Recent Developments
- 11.2.11.5. Financials (Based on Availability)
- 11.2.12 MAVIG
- 11.2.12.1. Overview
- 11.2.12.2. Products
- 11.2.12.3. SWOT Analysis
- 11.2.12.4. Recent Developments
- 11.2.12.5. Financials (Based on Availability)
- 11.2.13 NoIR Laser Company
- 11.2.13.1. Overview
- 11.2.13.2. Products
- 11.2.13.3. SWOT Analysis
- 11.2.13.4. Recent Developments
- 11.2.13.5. Financials (Based on Availability)
- 11.2.14 Thorlabs
- 11.2.14.1. Overview
- 11.2.14.2. Products
- 11.2.14.3. SWOT Analysis
- 11.2.14.4. Recent Developments
- 11.2.14.5. Financials (Based on Availability)
- 11.2.15 BolleSafety
- 11.2.15.1. Overview
- 11.2.15.2. Products
- 11.2.15.3. SWOT Analysis
- 11.2.15.4. Recent Developments
- 11.2.15.5. Financials (Based on Availability)
- 11.2.16 Mirion Medical
- 11.2.16.1. Overview
- 11.2.16.2. Products
- 11.2.16.3. SWOT Analysis
- 11.2.16.4. Recent Developments
- 11.2.16.5. Financials (Based on Availability)
- 11.2.17 ProtecX Medical
- 11.2.17.1. Overview
- 11.2.17.2. Products
- 11.2.17.3. SWOT Analysis
- 11.2.17.4. Recent Developments
- 11.2.17.5. Financials (Based on Availability)
- 11.2.18 Carl Zeiss
- 11.2.18.1. Overview
- 11.2.18.2. Products
- 11.2.18.3. SWOT Analysis
- 11.2.18.4. Recent Developments
- 11.2.18.5. Financials (Based on Availability)
- 11.2.1 Phillips Safety
List of Figures
- Figure 1: Global Computer Anti-radiation Glasses Revenue Breakdown (billion, %) by Region 2025 & 2033
- Figure 2: North America Computer Anti-radiation Glasses Revenue (billion), by Application 2025 & 2033
- Figure 3: North America Computer Anti-radiation Glasses Revenue Share (%), by Application 2025 & 2033
- Figure 4: North America Computer Anti-radiation Glasses Revenue (billion), by Types 2025 & 2033
- Figure 5: North America Computer Anti-radiation Glasses Revenue Share (%), by Types 2025 & 2033
- Figure 6: North America Computer Anti-radiation Glasses Revenue (billion), by Country 2025 & 2033
- Figure 7: North America Computer Anti-radiation Glasses Revenue Share (%), by Country 2025 & 2033
- Figure 8: South America Computer Anti-radiation Glasses Revenue (billion), by Application 2025 & 2033
- Figure 9: South America Computer Anti-radiation Glasses Revenue Share (%), by Application 2025 & 2033
- Figure 10: South America Computer Anti-radiation Glasses Revenue (billion), by Types 2025 & 2033
- Figure 11: South America Computer Anti-radiation Glasses Revenue Share (%), by Types 2025 & 2033
- Figure 12: South America Computer Anti-radiation Glasses Revenue (billion), by Country 2025 & 2033
- Figure 13: South America Computer Anti-radiation Glasses Revenue Share (%), by Country 2025 & 2033
- Figure 14: Europe Computer Anti-radiation Glasses Revenue (billion), by Application 2025 & 2033
- Figure 15: Europe Computer Anti-radiation Glasses Revenue Share (%), by Application 2025 & 2033
- Figure 16: Europe Computer Anti-radiation Glasses Revenue (billion), by Types 2025 & 2033
- Figure 17: Europe Computer Anti-radiation Glasses Revenue Share (%), by Types 2025 & 2033
- Figure 18: Europe Computer Anti-radiation Glasses Revenue (billion), by Country 2025 & 2033
- Figure 19: Europe Computer Anti-radiation Glasses Revenue Share (%), by Country 2025 & 2033
- Figure 20: Middle East & Africa Computer Anti-radiation Glasses Revenue (billion), by Application 2025 & 2033
- Figure 21: Middle East & Africa Computer Anti-radiation Glasses Revenue Share (%), by Application 2025 & 2033
- Figure 22: Middle East & Africa Computer Anti-radiation Glasses Revenue (billion), by Types 2025 & 2033
- Figure 23: Middle East & Africa Computer Anti-radiation Glasses Revenue Share (%), by Types 2025 & 2033
- Figure 24: Middle East & Africa Computer Anti-radiation Glasses Revenue (billion), by Country 2025 & 2033
- Figure 25: Middle East & Africa Computer Anti-radiation Glasses Revenue Share (%), by Country 2025 & 2033
- Figure 26: Asia Pacific Computer Anti-radiation Glasses Revenue (billion), by Application 2025 & 2033
- Figure 27: Asia Pacific Computer Anti-radiation Glasses Revenue Share (%), by Application 2025 & 2033
- Figure 28: Asia Pacific Computer Anti-radiation Glasses Revenue (billion), by Types 2025 & 2033
- Figure 29: Asia Pacific Computer Anti-radiation Glasses Revenue Share (%), by Types 2025 & 2033
- Figure 30: Asia Pacific Computer Anti-radiation Glasses Revenue (billion), by Country 2025 & 2033
- Figure 31: Asia Pacific Computer Anti-radiation Glasses Revenue Share (%), by Country 2025 & 2033
List of Tables
- Table 1: Global Computer Anti-radiation Glasses Revenue billion Forecast, by Application 2020 & 2033
- Table 2: Global Computer Anti-radiation Glasses Revenue billion Forecast, by Types 2020 & 2033
- Table 3: Global Computer Anti-radiation Glasses Revenue billion Forecast, by Region 2020 & 2033
- Table 4: Global Computer Anti-radiation Glasses Revenue billion Forecast, by Application 2020 & 2033
- Table 5: Global Computer Anti-radiation Glasses Revenue billion Forecast, by Types 2020 & 2033
- Table 6: Global Computer Anti-radiation Glasses Revenue billion Forecast, by Country 2020 & 2033
- Table 7: United States Computer Anti-radiation Glasses Revenue (billion) Forecast, by Application 2020 & 2033
- Table 8: Canada Computer Anti-radiation Glasses Revenue (billion) Forecast, by Application 2020 & 2033
- Table 9: Mexico Computer Anti-radiation Glasses Revenue (billion) Forecast, by Application 2020 & 2033
- Table 10: Global Computer Anti-radiation Glasses Revenue billion Forecast, by Application 2020 & 2033
- Table 11: Global Computer Anti-radiation Glasses Revenue billion Forecast, by Types 2020 & 2033
- Table 12: Global Computer Anti-radiation Glasses Revenue billion Forecast, by Country 2020 & 2033
- Table 13: Brazil Computer Anti-radiation Glasses Revenue (billion) Forecast, by Application 2020 & 2033
- Table 14: Argentina Computer Anti-radiation Glasses Revenue (billion) Forecast, by Application 2020 & 2033
- Table 15: Rest of South America Computer Anti-radiation Glasses Revenue (billion) Forecast, by Application 2020 & 2033
- Table 16: Global Computer Anti-radiation Glasses Revenue billion Forecast, by Application 2020 & 2033
- Table 17: Global Computer Anti-radiation Glasses Revenue billion Forecast, by Types 2020 & 2033
- Table 18: Global Computer Anti-radiation Glasses Revenue billion Forecast, by Country 2020 & 2033
- Table 19: United Kingdom Computer Anti-radiation Glasses Revenue (billion) Forecast, by Application 2020 & 2033
- Table 20: Germany Computer Anti-radiation Glasses Revenue (billion) Forecast, by Application 2020 & 2033
- Table 21: France Computer Anti-radiation Glasses Revenue (billion) Forecast, by Application 2020 & 2033
- Table 22: Italy Computer Anti-radiation Glasses Revenue (billion) Forecast, by Application 2020 & 2033
- Table 23: Spain Computer Anti-radiation Glasses Revenue (billion) Forecast, by Application 2020 & 2033
- Table 24: Russia Computer Anti-radiation Glasses Revenue (billion) Forecast, by Application 2020 & 2033
- Table 25: Benelux Computer Anti-radiation Glasses Revenue (billion) Forecast, by Application 2020 & 2033
- Table 26: Nordics Computer Anti-radiation Glasses Revenue (billion) Forecast, by Application 2020 & 2033
- Table 27: Rest of Europe Computer Anti-radiation Glasses Revenue (billion) Forecast, by Application 2020 & 2033
- Table 28: Global Computer Anti-radiation Glasses Revenue billion Forecast, by Application 2020 & 2033
- Table 29: Global Computer Anti-radiation Glasses Revenue billion Forecast, by Types 2020 & 2033
- Table 30: Global Computer Anti-radiation Glasses Revenue billion Forecast, by Country 2020 & 2033
- Table 31: Turkey Computer Anti-radiation Glasses Revenue (billion) Forecast, by Application 2020 & 2033
- Table 32: Israel Computer Anti-radiation Glasses Revenue (billion) Forecast, by Application 2020 & 2033
- Table 33: GCC Computer Anti-radiation Glasses Revenue (billion) Forecast, by Application 2020 & 2033
- Table 34: North Africa Computer Anti-radiation Glasses Revenue (billion) Forecast, by Application 2020 & 2033
- Table 35: South Africa Computer Anti-radiation Glasses Revenue (billion) Forecast, by Application 2020 & 2033
- Table 36: Rest of Middle East & Africa Computer Anti-radiation Glasses Revenue (billion) Forecast, by Application 2020 & 2033
- Table 37: Global Computer Anti-radiation Glasses Revenue billion Forecast, by Application 2020 & 2033
- Table 38: Global Computer Anti-radiation Glasses Revenue billion Forecast, by Types 2020 & 2033
- Table 39: Global Computer Anti-radiation Glasses Revenue billion Forecast, by Country 2020 & 2033
- Table 40: China Computer Anti-radiation Glasses Revenue (billion) Forecast, by Application 2020 & 2033
- Table 41: India Computer Anti-radiation Glasses Revenue (billion) Forecast, by Application 2020 & 2033
- Table 42: Japan Computer Anti-radiation Glasses Revenue (billion) Forecast, by Application 2020 & 2033
- Table 43: South Korea Computer Anti-radiation Glasses Revenue (billion) Forecast, by Application 2020 & 2033
- Table 44: ASEAN Computer Anti-radiation Glasses Revenue (billion) Forecast, by Application 2020 & 2033
- Table 45: Oceania Computer Anti-radiation Glasses Revenue (billion) Forecast, by Application 2020 & 2033
- Table 46: Rest of Asia Pacific Computer Anti-radiation Glasses Revenue (billion) Forecast, by Application 2020 & 2033
Frequently Asked Questions
1. What is the projected Compound Annual Growth Rate (CAGR) of the Computer Anti-radiation Glasses?
The projected CAGR is approximately 12.43%.
2. Which companies are prominent players in the Computer Anti-radiation Glasses?
Key companies in the market include Phillips Safety, LITE TECH, Protech Medical, Deutsch Medical, Wolf X-Ray, Essilor International, BarrierTechnologies, Supertech, Corning, Uvex Safety Group, Kiran, MAVIG, NoIR Laser Company, Thorlabs, BolleSafety, Mirion Medical, ProtecX Medical, Carl Zeiss.
3. What are the main segments of the Computer Anti-radiation Glasses?
The market segments include Application, Types.
4. Can you provide details about the market size?
The market size is estimated to be USD 8.82 billion as of 2022.
5. What are some drivers contributing to market growth?
N/A
6. What are the notable trends driving market growth?
N/A
7. Are there any restraints impacting market growth?
N/A
8. Can you provide examples of recent developments in the market?
N/A
9. What pricing options are available for accessing the report?
Pricing options include single-user, multi-user, and enterprise licenses priced at USD 4900.00, USD 7350.00, and USD 9800.00 respectively.
10. Is the market size provided in terms of value or volume?
The market size is provided in terms of value, measured in billion.
11. Are there any specific market keywords associated with the report?
Yes, the market keyword associated with the report is "Computer Anti-radiation Glasses," which aids in identifying and referencing the specific market segment covered.
12. How do I determine which pricing option suits my needs best?
The pricing options vary based on user requirements and access needs. Individual users may opt for single-user licenses, while businesses requiring broader access may choose multi-user or enterprise licenses for cost-effective access to the report.
13. Are there any additional resources or data provided in the Computer Anti-radiation Glasses report?
While the report offers comprehensive insights, it's advisable to review the specific contents or supplementary materials provided to ascertain if additional resources or data are available.
14. How can I stay updated on further developments or reports in the Computer Anti-radiation Glasses?
To stay informed about further developments, trends, and reports in the Computer Anti-radiation Glasses, consider subscribing to industry newsletters, following relevant companies and organizations, or regularly checking reputable industry news sources and publications.
Methodology
Step 1 - Identification of Relevant Samples Size from Population Database


Step 2 - Approaches for Defining Global Market Size (Value, Volume* & Price*)

Note*: In applicable scenarios
Step 3 - Data Sources
Primary Research
- Web Analytics
- Survey Reports
- Research Institute
- Latest Research Reports
- Opinion Leaders
Secondary Research
- Annual Reports
- White Paper
- Latest Press Release
- Industry Association
- Paid Database
- Investor Presentations

Step 4 - Data Triangulation
Involves using different sources of information in order to increase the validity of a study
These sources are likely to be stakeholders in a program - participants, other researchers, program staff, other community members, and so on.
Then we put all data in single framework & apply various statistical tools to find out the dynamic on the market.
During the analysis stage, feedback from the stakeholder groups would be compared to determine areas of agreement as well as areas of divergence