

Key Insights
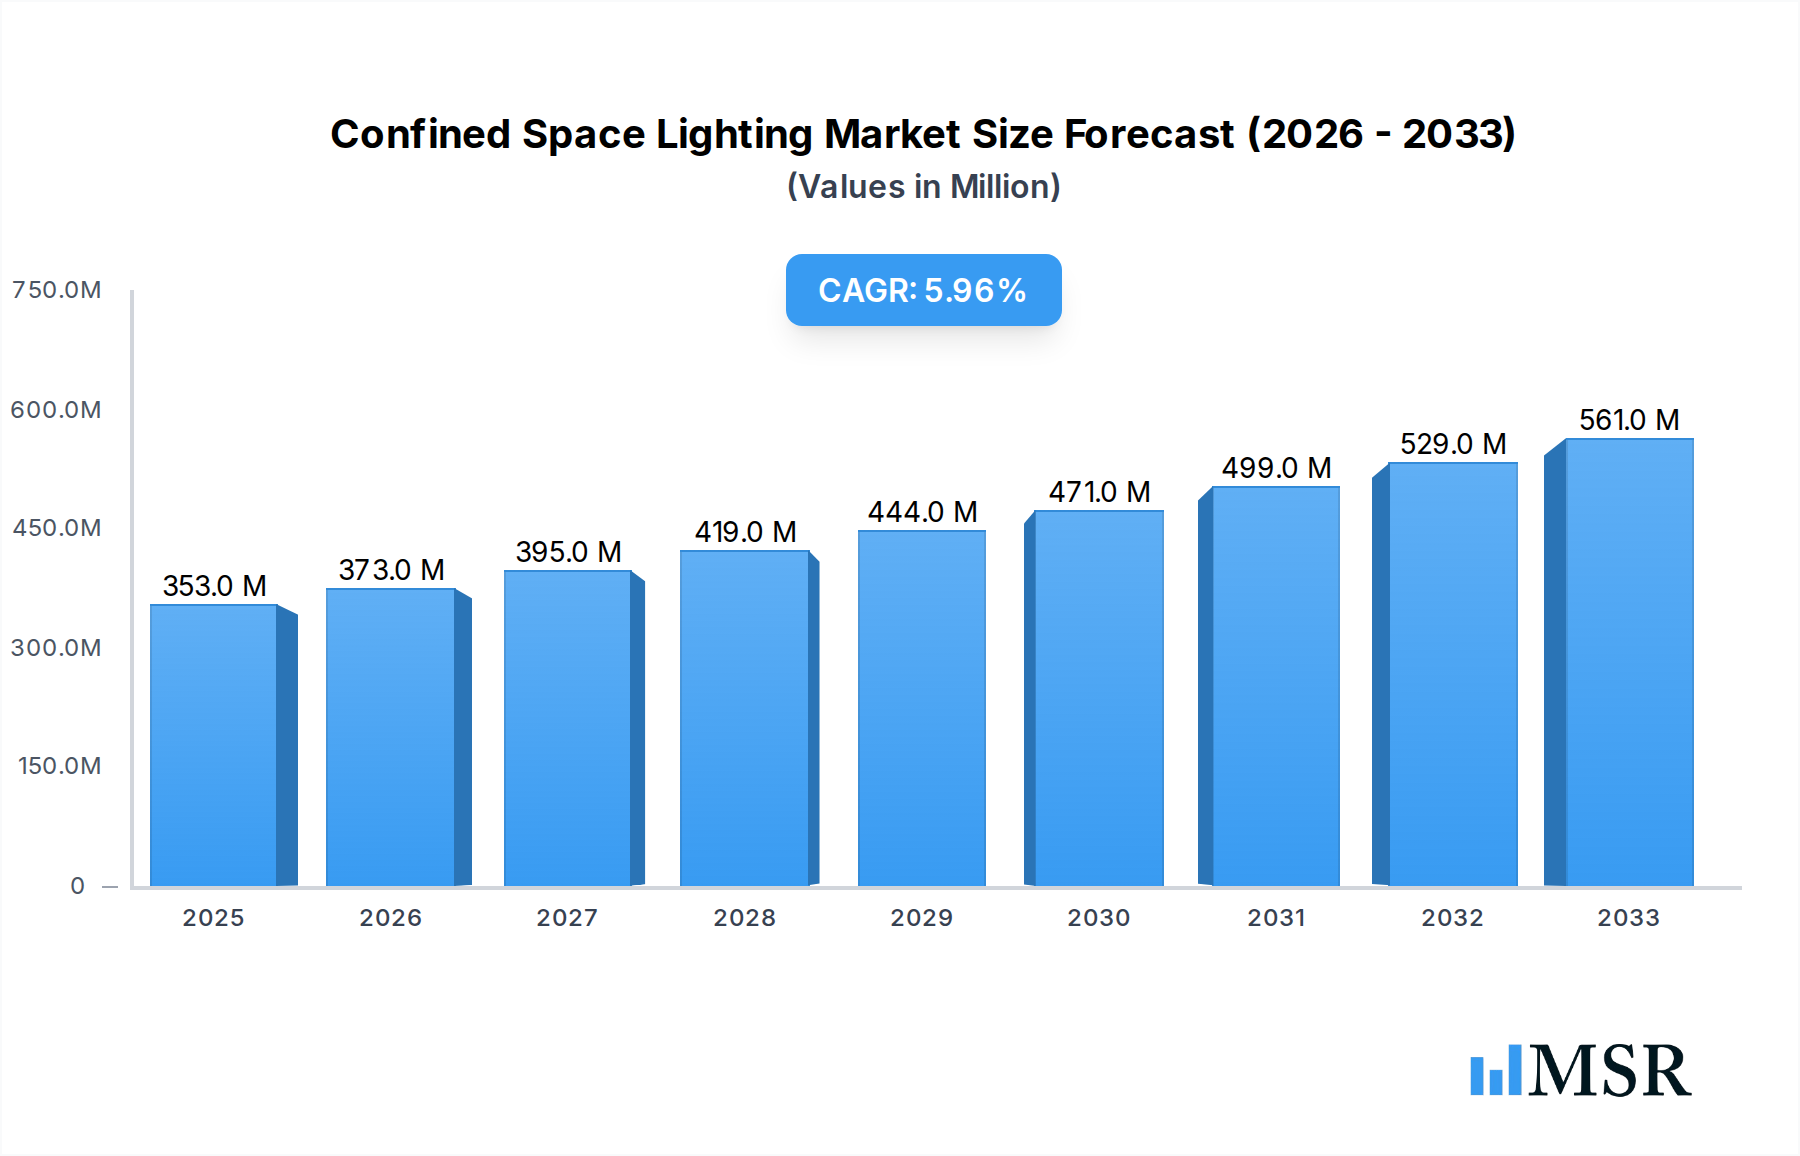
The Confined Space Lighting market is poised for significant expansion, with a projected market size of USD 353 million and a robust CAGR of 5.6% expected to drive growth throughout the forecast period. This upward trajectory is primarily fueled by increasing industrialization and stringent safety regulations mandating the use of specialized lighting solutions for hazardous and enclosed environments. Key sectors like mining and storage tank operations are witnessing a surge in demand for reliable and durable confined space lighting systems, as companies prioritize worker safety and operational efficiency. Advancements in LED technology, offering enhanced energy efficiency, longer lifespan, and superior illumination, are further propelling market adoption. The growing emphasis on preventing accidents and improving visibility in subterranean structures like tunnels and culverts also presents a substantial growth avenue.

Confined Space Lighting Market Size (In Million)
The market is characterized by a strong focus on innovation, with manufacturers investing in developing explosion-proof, intrinsically safe, and portable lighting solutions tailored to specific confined space challenges. While the adoption of energy-efficient LED lights is a dominant trend, the market also sees continued demand for specialized fluorescent and halogen lamps in certain applications. Geographically, Asia Pacific, led by China and India, is emerging as a key growth engine due to rapid industrial development and infrastructure projects. North America and Europe remain significant markets, driven by mature industries and strict safety compliance. However, challenges such as the initial high cost of advanced lighting systems and the availability of cheaper, less compliant alternatives in some regions may pose moderate restraints to the market's full potential. The competitive landscape features established players and emerging innovators, all striving to capture market share through product differentiation and strategic partnerships.
Confined Space Lighting Company Market Share
This comprehensive report delves into the global Confined Space Lighting market, offering an in-depth analysis of its current landscape, future projections, and strategic imperatives. Covering the historical period from 2019 to 2024, a base year of 2025, and a forecast period extending to 2033, this study provides actionable insights for manufacturers, suppliers, investors, and industry stakeholders. We examine key market dynamics, technological advancements, application-specific demands, and emerging opportunities within this critical sector.
Confined Space Lighting Market Concentration & Dynamics
The confined space lighting market exhibits a moderately concentrated landscape, with a blend of established global players and specialized regional manufacturers vying for market share. Key companies such as Western Technology, GE Lighting, Emerson Electric, Eaton, Hubbell Incorporated, Acuity Brands, AZZ, Kenall Manufacturing, Nemalux, LDPI, Cree, ABB, Phoenix Products, Larson Electronics, Saurya Safety, and Atexor are actively contributing to market innovation and supply. The innovation ecosystem is characterized by a steady stream of new product development, particularly in the adoption of energy-efficient and intrinsically safe lighting solutions. Regulatory frameworks, primarily focused on worker safety and explosion prevention, play a significant role in shaping product design and adoption rates. While direct substitute products are limited for specialized confined space applications, the overall efficiency and longevity of lighting solutions present a form of competitive pressure. End-user trends are increasingly favoring solutions that offer enhanced durability, portability, and integrated safety features. Mergers and acquisitions (M&A) activities, though not as frequent as in broader lighting sectors, are strategically aimed at consolidating market position and acquiring specific technological capabilities. An estimated XX M&A deals have occurred within the historical period, indicating strategic consolidation. Market share distribution is dynamic, with leading players often holding substantial portions in niche segments.
Confined Space Lighting Industry Insights & Trends
The global confined space lighting market is projected for robust growth, driven by increasing industrial activity, stringent safety regulations, and a growing emphasis on worker well-being. The market size is estimated at approximately $1,000 million in the base year of 2025, with a projected Compound Annual Growth Rate (CAGR) of XX% during the forecast period of 2025–2033. This growth is fueled by a fundamental need for reliable and safe illumination in environments where traditional lighting is impractical or hazardous, such as mines, storage tanks, and tunnels. Technological advancements are at the forefront of industry evolution. The widespread adoption of LED confined space lights has been a significant disruptive force, offering superior energy efficiency, longer lifespan, reduced heat generation, and greater durability compared to traditional fluorescent and halogen lamps. This transition aligns with global sustainability initiatives and reduces operational costs for end-users.
Evolving consumer behaviors, particularly among industrial sectors, are steering demand towards intelligent lighting solutions. This includes features like remote monitoring, dimming capabilities, and integration with other safety systems. The emphasis on preventing accidents and ensuring compliance with ATEX-certified lighting and explosion-proof lighting standards further amplifies the demand for specialized and certified products. The increasing complexity of industrial operations and infrastructure development, especially in emerging economies, creates new application areas and drives the need for advanced confined space lighting systems. Furthermore, the growing awareness of the long-term health implications of poor lighting on workers is prompting companies to invest in higher quality, safer lighting solutions, contributing to the market's upward trajectory. The overall trend is towards smarter, safer, and more sustainable lighting for challenging environments.
Key Markets & Segments Leading Confined Space Lighting
The confined space lighting market is experiencing significant growth across various applications and types, with distinct regions and segments demonstrating particular strength.
Dominant Regions and Countries:
- North America: This region, particularly the United States and Canada, is a major driver of the confined space lighting market.
- Drivers: Robust oil and gas exploration and production, extensive mining operations, and aging infrastructure requiring maintenance and upgrades in tunnels and culverts are key economic growth factors. Stringent OSHA regulations mandating safe working conditions in confined spaces further propel demand. High investment in industrial safety technologies and a mature manufacturing base contribute to market dominance.
- Europe: Countries like Germany, the United Kingdom, and France are significant contributors, driven by a strong industrial base and rigorous safety standards.
- Drivers: The presence of numerous industrial facilities, chemical plants, and extensive underground infrastructure, coupled with strict EU safety directives (e.g., ATEX), create a consistent demand for compliant lighting solutions. Investments in renewable energy infrastructure, such as wind farms and associated maintenance, also contribute to market growth.
Dominant Applications:
- Mine Lighting: The mining sector remains a critical application for confined space lighting.
- Drivers: Continuous exploration and extraction activities, the need for safe illumination in deep shafts and tunnels, and the inherent risks associated with flammable gases (e.g., methane) necessitate explosion-proof and intrinsically safe lighting. Modernization efforts in mining operations are also driving the adoption of advanced lighting systems. The market for mine lighting is estimated to be around $XXX million in 2025.
- Storage Tank Lighting: Essential for maintenance, inspection, and cleaning of tanks in industries like petrochemicals, food and beverage, and pharmaceuticals.
- Drivers: The ongoing need for inspection and maintenance of a vast number of storage tanks globally, coupled with the requirement for non-sparking and corrosion-resistant lighting to prevent ignition of volatile substances. Compliance with industry-specific safety regulations is paramount. This segment is valued at approximately $YYY million in 2025.
- Tunnels and Culverts: Infrastructure development and maintenance projects worldwide demand reliable lighting solutions.
- Drivers: Ongoing urban development, expansion of transportation networks, and the need for regular maintenance of existing tunnels and culverts. These projects often involve working in dark, potentially hazardous environments where specialized lighting is crucial for worker safety and project efficiency. The market size for tunnel lighting is estimated at $ZZZ million in 2025.
Dominant Types:
- LED Light: This type dominates the confined space lighting market and is expected to continue its ascendancy.
- Drivers: Superior energy efficiency (reducing operational costs), exceptional lifespan (minimizing replacement frequency and downtime), enhanced durability and shock resistance, and cooler operating temperatures compared to older technologies. The ability to produce specific light spectrums for improved visibility and the development of compact, portable LED units are significant advantages. The LED segment is estimated to capture over XX% of the market share in 2025, valued at around $XXX million.
- Fluorescent Lamp: While declining, still present in some legacy applications.
- Drivers: Historically cost-effective for larger areas, but increasingly being phased out due to lower energy efficiency and shorter lifespan compared to LEDs.
- Halogen Lamp: Primarily used in niche, short-term applications requiring intense light.
- Drivers: High initial brightness, but inefficient and generate significant heat, posing potential safety risks in confined spaces.
The synergistic growth across these regions, applications, and types, particularly the dominance of LED technology and the persistent demand from mining and storage tank sectors, indicates a dynamic and expanding confined space lighting market.
Confined Space Lighting Product Developments
Recent product developments in the confined space lighting sector are heavily focused on enhancing safety, portability, and efficiency. Manufacturers are innovating with advanced LED technologies, offering higher lumen outputs with reduced power consumption. This includes the development of ruggedized, impact-resistant fixtures compliant with stringent explosion-proof lighting and ATEX-certified lighting standards. Innovations in battery technology are leading to more powerful and longer-lasting portable lighting solutions, ideal for remote or temporary site needs. Furthermore, the integration of smart features, such as remote control and diagnostics, is emerging, allowing for better operational management and proactive maintenance, offering a significant competitive edge in the market.
Challenges in the Confined Space Lighting Market
The confined space lighting market faces several significant challenges that temper its growth trajectory. Regulatory compliance remains a primary hurdle, with evolving standards for explosion-proof and intrinsically safe lighting requiring continuous product re-certification and adaptation, adding to development costs. Supply chain disruptions, exacerbated by global events, can impact the availability of critical components and raw materials, leading to production delays and increased prices. The high initial investment cost for advanced, compliant lighting solutions can be a barrier for smaller enterprises or those with limited capital expenditure budgets, especially when compared to the perceived lower upfront cost of less specialized lighting. Intense competition among manufacturers, particularly in price-sensitive segments, can also exert pressure on profit margins.
Forces Driving Confined Space Lighting Growth
Several key forces are propelling the growth of the confined space lighting market. The paramount driver is the unwavering commitment to worker safety, mandated by stringent government regulations and industry best practices worldwide. The increasing frequency and severity of industrial accidents necessitate the adoption of reliable and certified safety equipment, including specialized lighting. Technological advancements, particularly the evolution of energy-efficient and durable LED lighting, offer cost-effective and superior performance solutions. Growing global industrialization and infrastructure development, especially in emerging economies, expands the need for lighting in previously underserved or hazardous environments. Finally, the rising awareness of the long-term economic benefits of investing in high-quality, long-lasting safety equipment, such as reduced downtime and maintenance costs, is encouraging more widespread adoption.
Challenges in the Confined Space Lighting Market
Long-term growth catalysts for the confined space lighting market are deeply rooted in continued innovation and strategic market expansion. The ongoing pursuit of smarter lighting solutions, integrating IoT capabilities for remote monitoring, predictive maintenance, and enhanced operational efficiency, presents a significant growth avenue. Partnerships and collaborations between lighting manufacturers, safety equipment providers, and end-users can foster the development of tailored solutions and accelerate market penetration. Exploring new application areas beyond traditional industrial sectors, such as specialized utility maintenance or disaster response scenarios, can unlock new demand. Furthermore, continuous improvements in battery technology for portable lighting and advancements in materials science for enhanced durability and environmental resistance will fuel sustained market development.
Emerging Opportunities in Confined Space Lighting
Emerging opportunities within the confined space lighting market are abundant and diverse. The increasing global focus on renewable energy infrastructure, particularly wind farms and solar power plants, requires specialized lighting for maintenance and operation within towers and substations. The expansion of underground infrastructure, including subway systems and utility networks, in urbanized areas presents a growing demand for tunnel and culvert lighting solutions. Advancements in sensor technology could lead to the integration of lighting with gas detection or environmental monitoring systems, offering multi-functional safety solutions. Furthermore, the development of customized lighting solutions for specific niche industries, such as marine salvage or emergency response, holds significant untapped potential. The push for smart city initiatives may also indirectly drive demand for robust, connected lighting in underground city infrastructure.
Leading Players in the Confined Space Lighting Sector
- Western Technology
- GE Lighting
- Emerson Electric
- Eaton
- Hubbell Incorporated
- Acuity Brands
- AZZ
- Kenall Manufacturing
- Nemalux
- LDPI
- Cree
- ABB
- Phoenix Products
- Larson Electronics
- Saurya Safety
- Atexor
Key Milestones in Confined Space Lighting Industry
- 2019: Increased adoption of intrinsically safe LED lighting in the oil and gas sector due to stricter safety regulations.
- 2020: Introduction of more compact and powerful portable explosion-proof lighting solutions by several key manufacturers.
- 2021: Significant investments in R&D for ATEX-certified lighting to meet evolving European standards.
- 2022: Growing demand for smart lighting features in industrial confined spaces, including remote monitoring capabilities.
- 2023: Emergence of specialized lighting solutions for renewable energy infrastructure maintenance.
- 2024: Increased focus on supply chain resilience and sustainable manufacturing practices within the industry.
- 2025 (Estimated): Further integration of IoT and AI for predictive maintenance and enhanced safety analytics in lighting systems.
Strategic Outlook for Confined Space Lighting Market
The strategic outlook for the confined space lighting market remains highly positive, driven by a confluence of safety imperatives, technological advancements, and growing industrial needs. Growth accelerators will focus on the continued innovation in LED confined space lights, emphasizing higher efficiency, longer lifespans, and enhanced durability. The development of intelligent, connected lighting systems that offer remote monitoring, diagnostics, and integration with other safety protocols will be a key differentiator. Strategic opportunities lie in expanding market reach into developing economies with growing industrial sectors and in catering to the specific demands of emerging applications like renewable energy infrastructure. Companies that can offer certified, reliable, and cost-effective solutions, while also embracing sustainability and smart technology, will be well-positioned for significant growth in the coming years.
Confined Space Lighting Segmentation
-
1. Application
- 1.1. Mine
- 1.2. Storage Tank
- 1.3. Tunnels and Culverts
- 1.4. Others
-
2. Types
- 2.1. LED Light
- 2.2. Fluorescent Lamp
- 2.3. Halogen Lamp
- 2.4. Others
Confined Space Lighting Segmentation By Geography
-
1. North America
- 1.1. United States
- 1.2. Canada
- 1.3. Mexico
-
2. South America
- 2.1. Brazil
- 2.2. Argentina
- 2.3. Rest of South America
-
3. Europe
- 3.1. United Kingdom
- 3.2. Germany
- 3.3. France
- 3.4. Italy
- 3.5. Spain
- 3.6. Russia
- 3.7. Benelux
- 3.8. Nordics
- 3.9. Rest of Europe
-
4. Middle East & Africa
- 4.1. Turkey
- 4.2. Israel
- 4.3. GCC
- 4.4. North Africa
- 4.5. South Africa
- 4.6. Rest of Middle East & Africa
-
5. Asia Pacific
- 5.1. China
- 5.2. India
- 5.3. Japan
- 5.4. South Korea
- 5.5. ASEAN
- 5.6. Oceania
- 5.7. Rest of Asia Pacific
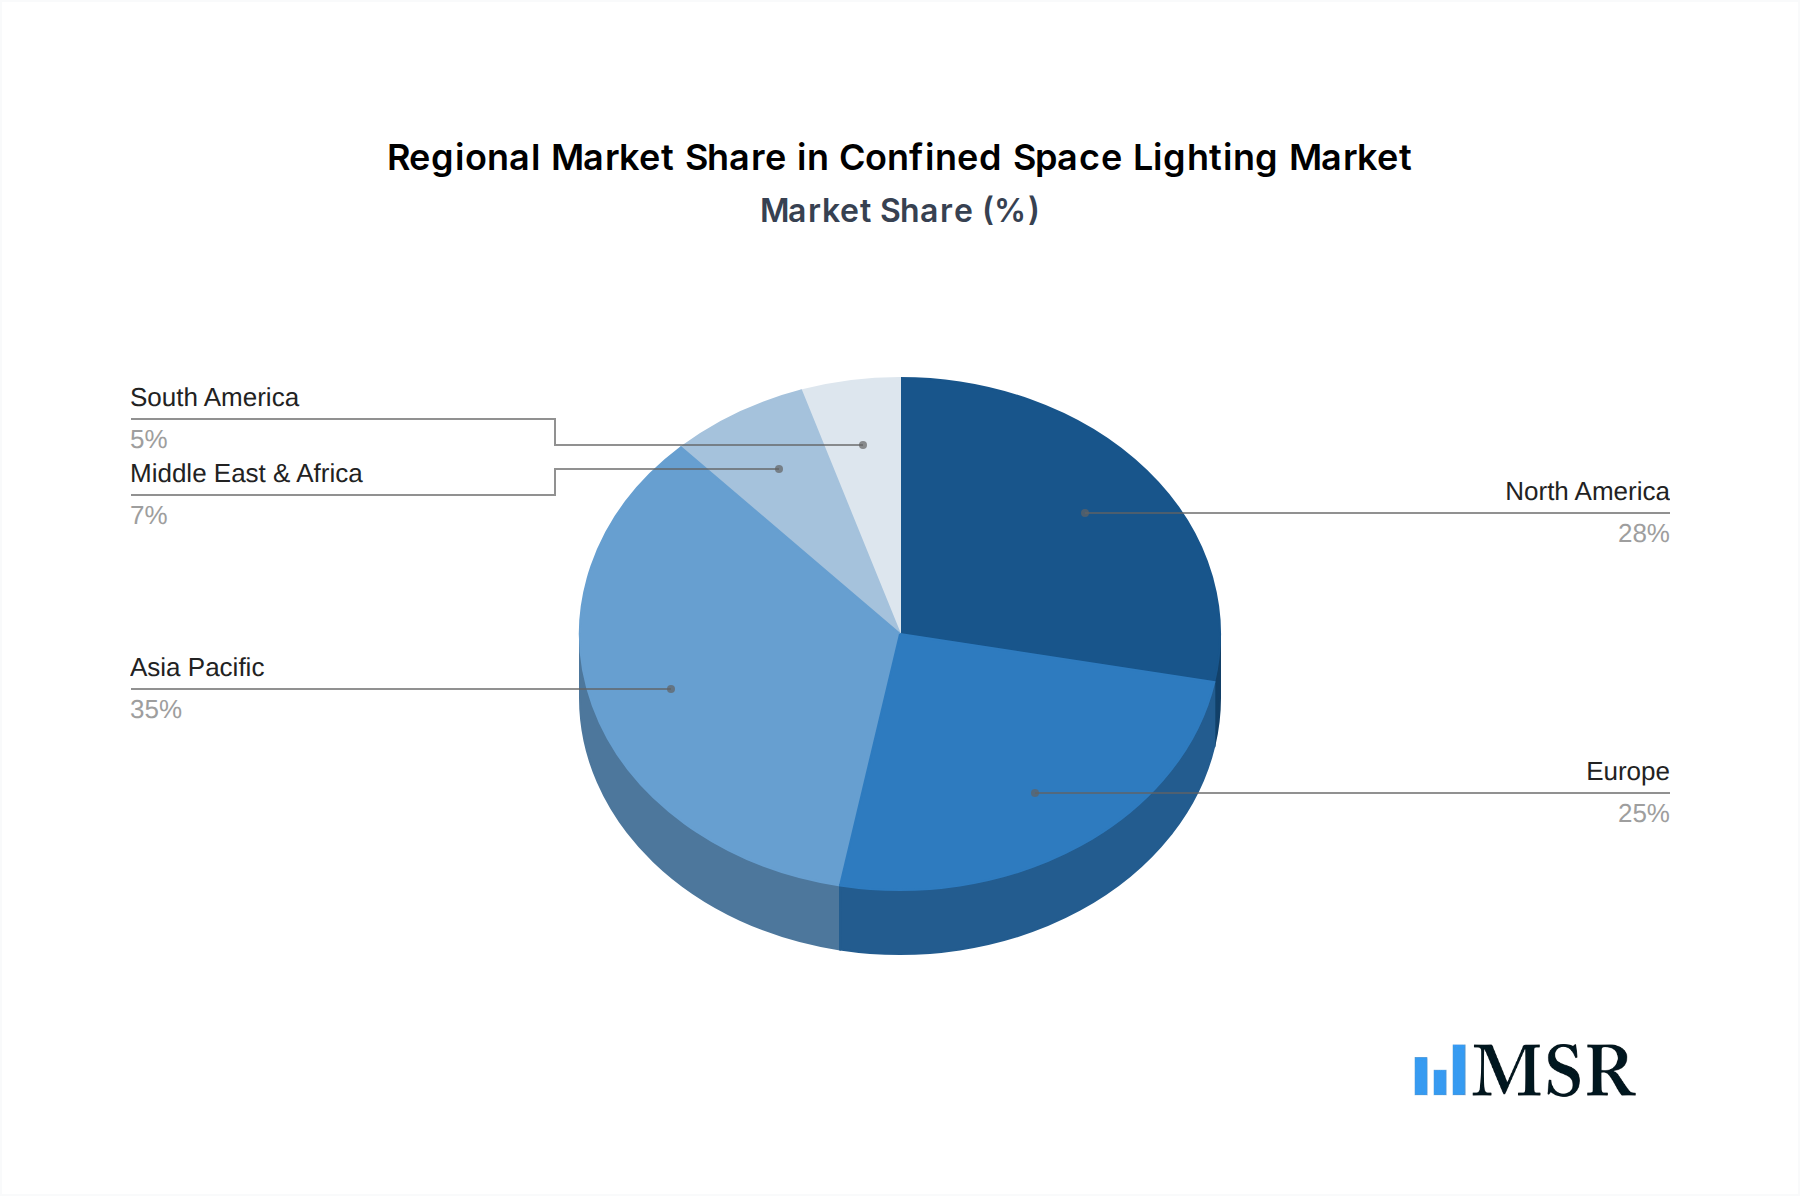
Confined Space Lighting Regional Market Share
Geographic Coverage of Confined Space Lighting
Confined Space Lighting REPORT HIGHLIGHTS
| Aspects | Details |
|---|---|
| Study Period | 2020-2034 |
| Base Year | 2025 |
| Estimated Year | 2026 |
| Forecast Period | 2026-2034 |
| Historical Period | 2020-2025 |
| Growth Rate | CAGR of 5.6% from 2020-2034 |
| Segmentation |
|
Table of Contents
- 1. Introduction
- 1.1. Research Scope
- 1.2. Market Segmentation
- 1.3. Research Methodology
- 1.4. Definitions and Assumptions
- 2. Executive Summary
- 2.1. Introduction
- 3. Market Dynamics
- 3.1. Introduction
- 3.2. Market Drivers
- 3.3. Market Restrains
- 3.4. Market Trends
- 4. Market Factor Analysis
- 4.1. Porters Five Forces
- 4.2. Supply/Value Chain
- 4.3. PESTEL analysis
- 4.4. Market Entropy
- 4.5. Patent/Trademark Analysis
- 5. Global Confined Space Lighting Analysis, Insights and Forecast, 2020-2032
- 5.1. Market Analysis, Insights and Forecast - by Application
- 5.1.1. Mine
- 5.1.2. Storage Tank
- 5.1.3. Tunnels and Culverts
- 5.1.4. Others
- 5.2. Market Analysis, Insights and Forecast - by Types
- 5.2.1. LED Light
- 5.2.2. Fluorescent Lamp
- 5.2.3. Halogen Lamp
- 5.2.4. Others
- 5.3. Market Analysis, Insights and Forecast - by Region
- 5.3.1. North America
- 5.3.2. South America
- 5.3.3. Europe
- 5.3.4. Middle East & Africa
- 5.3.5. Asia Pacific
- 5.1. Market Analysis, Insights and Forecast - by Application
- 6. North America Confined Space Lighting Analysis, Insights and Forecast, 2020-2032
- 6.1. Market Analysis, Insights and Forecast - by Application
- 6.1.1. Mine
- 6.1.2. Storage Tank
- 6.1.3. Tunnels and Culverts
- 6.1.4. Others
- 6.2. Market Analysis, Insights and Forecast - by Types
- 6.2.1. LED Light
- 6.2.2. Fluorescent Lamp
- 6.2.3. Halogen Lamp
- 6.2.4. Others
- 6.1. Market Analysis, Insights and Forecast - by Application
- 7. South America Confined Space Lighting Analysis, Insights and Forecast, 2020-2032
- 7.1. Market Analysis, Insights and Forecast - by Application
- 7.1.1. Mine
- 7.1.2. Storage Tank
- 7.1.3. Tunnels and Culverts
- 7.1.4. Others
- 7.2. Market Analysis, Insights and Forecast - by Types
- 7.2.1. LED Light
- 7.2.2. Fluorescent Lamp
- 7.2.3. Halogen Lamp
- 7.2.4. Others
- 7.1. Market Analysis, Insights and Forecast - by Application
- 8. Europe Confined Space Lighting Analysis, Insights and Forecast, 2020-2032
- 8.1. Market Analysis, Insights and Forecast - by Application
- 8.1.1. Mine
- 8.1.2. Storage Tank
- 8.1.3. Tunnels and Culverts
- 8.1.4. Others
- 8.2. Market Analysis, Insights and Forecast - by Types
- 8.2.1. LED Light
- 8.2.2. Fluorescent Lamp
- 8.2.3. Halogen Lamp
- 8.2.4. Others
- 8.1. Market Analysis, Insights and Forecast - by Application
- 9. Middle East & Africa Confined Space Lighting Analysis, Insights and Forecast, 2020-2032
- 9.1. Market Analysis, Insights and Forecast - by Application
- 9.1.1. Mine
- 9.1.2. Storage Tank
- 9.1.3. Tunnels and Culverts
- 9.1.4. Others
- 9.2. Market Analysis, Insights and Forecast - by Types
- 9.2.1. LED Light
- 9.2.2. Fluorescent Lamp
- 9.2.3. Halogen Lamp
- 9.2.4. Others
- 9.1. Market Analysis, Insights and Forecast - by Application
- 10. Asia Pacific Confined Space Lighting Analysis, Insights and Forecast, 2020-2032
- 10.1. Market Analysis, Insights and Forecast - by Application
- 10.1.1. Mine
- 10.1.2. Storage Tank
- 10.1.3. Tunnels and Culverts
- 10.1.4. Others
- 10.2. Market Analysis, Insights and Forecast - by Types
- 10.2.1. LED Light
- 10.2.2. Fluorescent Lamp
- 10.2.3. Halogen Lamp
- 10.2.4. Others
- 10.1. Market Analysis, Insights and Forecast - by Application
- 11. Competitive Analysis
- 11.1. Global Market Share Analysis 2025
- 11.2. Company Profiles
- 11.2.1 Western Technology
- 11.2.1.1. Overview
- 11.2.1.2. Products
- 11.2.1.3. SWOT Analysis
- 11.2.1.4. Recent Developments
- 11.2.1.5. Financials (Based on Availability)
- 11.2.2 GE Lighting
- 11.2.2.1. Overview
- 11.2.2.2. Products
- 11.2.2.3. SWOT Analysis
- 11.2.2.4. Recent Developments
- 11.2.2.5. Financials (Based on Availability)
- 11.2.3 Emerson Electric
- 11.2.3.1. Overview
- 11.2.3.2. Products
- 11.2.3.3. SWOT Analysis
- 11.2.3.4. Recent Developments
- 11.2.3.5. Financials (Based on Availability)
- 11.2.4 Eaton
- 11.2.4.1. Overview
- 11.2.4.2. Products
- 11.2.4.3. SWOT Analysis
- 11.2.4.4. Recent Developments
- 11.2.4.5. Financials (Based on Availability)
- 11.2.5 Hubbell Incorporated
- 11.2.5.1. Overview
- 11.2.5.2. Products
- 11.2.5.3. SWOT Analysis
- 11.2.5.4. Recent Developments
- 11.2.5.5. Financials (Based on Availability)
- 11.2.6 Acuity Brands
- 11.2.6.1. Overview
- 11.2.6.2. Products
- 11.2.6.3. SWOT Analysis
- 11.2.6.4. Recent Developments
- 11.2.6.5. Financials (Based on Availability)
- 11.2.7 AZZ
- 11.2.7.1. Overview
- 11.2.7.2. Products
- 11.2.7.3. SWOT Analysis
- 11.2.7.4. Recent Developments
- 11.2.7.5. Financials (Based on Availability)
- 11.2.8 Kenall Manufacturing
- 11.2.8.1. Overview
- 11.2.8.2. Products
- 11.2.8.3. SWOT Analysis
- 11.2.8.4. Recent Developments
- 11.2.8.5. Financials (Based on Availability)
- 11.2.9 Nemalux
- 11.2.9.1. Overview
- 11.2.9.2. Products
- 11.2.9.3. SWOT Analysis
- 11.2.9.4. Recent Developments
- 11.2.9.5. Financials (Based on Availability)
- 11.2.10 LDPI
- 11.2.10.1. Overview
- 11.2.10.2. Products
- 11.2.10.3. SWOT Analysis
- 11.2.10.4. Recent Developments
- 11.2.10.5. Financials (Based on Availability)
- 11.2.11 Cree
- 11.2.11.1. Overview
- 11.2.11.2. Products
- 11.2.11.3. SWOT Analysis
- 11.2.11.4. Recent Developments
- 11.2.11.5. Financials (Based on Availability)
- 11.2.12 ABB
- 11.2.12.1. Overview
- 11.2.12.2. Products
- 11.2.12.3. SWOT Analysis
- 11.2.12.4. Recent Developments
- 11.2.12.5. Financials (Based on Availability)
- 11.2.13 Phoenix Products
- 11.2.13.1. Overview
- 11.2.13.2. Products
- 11.2.13.3. SWOT Analysis
- 11.2.13.4. Recent Developments
- 11.2.13.5. Financials (Based on Availability)
- 11.2.14 Larson Electronics
- 11.2.14.1. Overview
- 11.2.14.2. Products
- 11.2.14.3. SWOT Analysis
- 11.2.14.4. Recent Developments
- 11.2.14.5. Financials (Based on Availability)
- 11.2.15 Saurya Safety
- 11.2.15.1. Overview
- 11.2.15.2. Products
- 11.2.15.3. SWOT Analysis
- 11.2.15.4. Recent Developments
- 11.2.15.5. Financials (Based on Availability)
- 11.2.16 Atexor
- 11.2.16.1. Overview
- 11.2.16.2. Products
- 11.2.16.3. SWOT Analysis
- 11.2.16.4. Recent Developments
- 11.2.16.5. Financials (Based on Availability)
- 11.2.1 Western Technology
List of Figures
- Figure 1: Global Confined Space Lighting Revenue Breakdown (million, %) by Region 2025 & 2033
- Figure 2: North America Confined Space Lighting Revenue (million), by Application 2025 & 2033
- Figure 3: North America Confined Space Lighting Revenue Share (%), by Application 2025 & 2033
- Figure 4: North America Confined Space Lighting Revenue (million), by Types 2025 & 2033
- Figure 5: North America Confined Space Lighting Revenue Share (%), by Types 2025 & 2033
- Figure 6: North America Confined Space Lighting Revenue (million), by Country 2025 & 2033
- Figure 7: North America Confined Space Lighting Revenue Share (%), by Country 2025 & 2033
- Figure 8: South America Confined Space Lighting Revenue (million), by Application 2025 & 2033
- Figure 9: South America Confined Space Lighting Revenue Share (%), by Application 2025 & 2033
- Figure 10: South America Confined Space Lighting Revenue (million), by Types 2025 & 2033
- Figure 11: South America Confined Space Lighting Revenue Share (%), by Types 2025 & 2033
- Figure 12: South America Confined Space Lighting Revenue (million), by Country 2025 & 2033
- Figure 13: South America Confined Space Lighting Revenue Share (%), by Country 2025 & 2033
- Figure 14: Europe Confined Space Lighting Revenue (million), by Application 2025 & 2033
- Figure 15: Europe Confined Space Lighting Revenue Share (%), by Application 2025 & 2033
- Figure 16: Europe Confined Space Lighting Revenue (million), by Types 2025 & 2033
- Figure 17: Europe Confined Space Lighting Revenue Share (%), by Types 2025 & 2033
- Figure 18: Europe Confined Space Lighting Revenue (million), by Country 2025 & 2033
- Figure 19: Europe Confined Space Lighting Revenue Share (%), by Country 2025 & 2033
- Figure 20: Middle East & Africa Confined Space Lighting Revenue (million), by Application 2025 & 2033
- Figure 21: Middle East & Africa Confined Space Lighting Revenue Share (%), by Application 2025 & 2033
- Figure 22: Middle East & Africa Confined Space Lighting Revenue (million), by Types 2025 & 2033
- Figure 23: Middle East & Africa Confined Space Lighting Revenue Share (%), by Types 2025 & 2033
- Figure 24: Middle East & Africa Confined Space Lighting Revenue (million), by Country 2025 & 2033
- Figure 25: Middle East & Africa Confined Space Lighting Revenue Share (%), by Country 2025 & 2033
- Figure 26: Asia Pacific Confined Space Lighting Revenue (million), by Application 2025 & 2033
- Figure 27: Asia Pacific Confined Space Lighting Revenue Share (%), by Application 2025 & 2033
- Figure 28: Asia Pacific Confined Space Lighting Revenue (million), by Types 2025 & 2033
- Figure 29: Asia Pacific Confined Space Lighting Revenue Share (%), by Types 2025 & 2033
- Figure 30: Asia Pacific Confined Space Lighting Revenue (million), by Country 2025 & 2033
- Figure 31: Asia Pacific Confined Space Lighting Revenue Share (%), by Country 2025 & 2033
List of Tables
- Table 1: Global Confined Space Lighting Revenue million Forecast, by Application 2020 & 2033
- Table 2: Global Confined Space Lighting Revenue million Forecast, by Types 2020 & 2033
- Table 3: Global Confined Space Lighting Revenue million Forecast, by Region 2020 & 2033
- Table 4: Global Confined Space Lighting Revenue million Forecast, by Application 2020 & 2033
- Table 5: Global Confined Space Lighting Revenue million Forecast, by Types 2020 & 2033
- Table 6: Global Confined Space Lighting Revenue million Forecast, by Country 2020 & 2033
- Table 7: United States Confined Space Lighting Revenue (million) Forecast, by Application 2020 & 2033
- Table 8: Canada Confined Space Lighting Revenue (million) Forecast, by Application 2020 & 2033
- Table 9: Mexico Confined Space Lighting Revenue (million) Forecast, by Application 2020 & 2033
- Table 10: Global Confined Space Lighting Revenue million Forecast, by Application 2020 & 2033
- Table 11: Global Confined Space Lighting Revenue million Forecast, by Types 2020 & 2033
- Table 12: Global Confined Space Lighting Revenue million Forecast, by Country 2020 & 2033
- Table 13: Brazil Confined Space Lighting Revenue (million) Forecast, by Application 2020 & 2033
- Table 14: Argentina Confined Space Lighting Revenue (million) Forecast, by Application 2020 & 2033
- Table 15: Rest of South America Confined Space Lighting Revenue (million) Forecast, by Application 2020 & 2033
- Table 16: Global Confined Space Lighting Revenue million Forecast, by Application 2020 & 2033
- Table 17: Global Confined Space Lighting Revenue million Forecast, by Types 2020 & 2033
- Table 18: Global Confined Space Lighting Revenue million Forecast, by Country 2020 & 2033
- Table 19: United Kingdom Confined Space Lighting Revenue (million) Forecast, by Application 2020 & 2033
- Table 20: Germany Confined Space Lighting Revenue (million) Forecast, by Application 2020 & 2033
- Table 21: France Confined Space Lighting Revenue (million) Forecast, by Application 2020 & 2033
- Table 22: Italy Confined Space Lighting Revenue (million) Forecast, by Application 2020 & 2033
- Table 23: Spain Confined Space Lighting Revenue (million) Forecast, by Application 2020 & 2033
- Table 24: Russia Confined Space Lighting Revenue (million) Forecast, by Application 2020 & 2033
- Table 25: Benelux Confined Space Lighting Revenue (million) Forecast, by Application 2020 & 2033
- Table 26: Nordics Confined Space Lighting Revenue (million) Forecast, by Application 2020 & 2033
- Table 27: Rest of Europe Confined Space Lighting Revenue (million) Forecast, by Application 2020 & 2033
- Table 28: Global Confined Space Lighting Revenue million Forecast, by Application 2020 & 2033
- Table 29: Global Confined Space Lighting Revenue million Forecast, by Types 2020 & 2033
- Table 30: Global Confined Space Lighting Revenue million Forecast, by Country 2020 & 2033
- Table 31: Turkey Confined Space Lighting Revenue (million) Forecast, by Application 2020 & 2033
- Table 32: Israel Confined Space Lighting Revenue (million) Forecast, by Application 2020 & 2033
- Table 33: GCC Confined Space Lighting Revenue (million) Forecast, by Application 2020 & 2033
- Table 34: North Africa Confined Space Lighting Revenue (million) Forecast, by Application 2020 & 2033
- Table 35: South Africa Confined Space Lighting Revenue (million) Forecast, by Application 2020 & 2033
- Table 36: Rest of Middle East & Africa Confined Space Lighting Revenue (million) Forecast, by Application 2020 & 2033
- Table 37: Global Confined Space Lighting Revenue million Forecast, by Application 2020 & 2033
- Table 38: Global Confined Space Lighting Revenue million Forecast, by Types 2020 & 2033
- Table 39: Global Confined Space Lighting Revenue million Forecast, by Country 2020 & 2033
- Table 40: China Confined Space Lighting Revenue (million) Forecast, by Application 2020 & 2033
- Table 41: India Confined Space Lighting Revenue (million) Forecast, by Application 2020 & 2033
- Table 42: Japan Confined Space Lighting Revenue (million) Forecast, by Application 2020 & 2033
- Table 43: South Korea Confined Space Lighting Revenue (million) Forecast, by Application 2020 & 2033
- Table 44: ASEAN Confined Space Lighting Revenue (million) Forecast, by Application 2020 & 2033
- Table 45: Oceania Confined Space Lighting Revenue (million) Forecast, by Application 2020 & 2033
- Table 46: Rest of Asia Pacific Confined Space Lighting Revenue (million) Forecast, by Application 2020 & 2033
Frequently Asked Questions
1. What is the projected Compound Annual Growth Rate (CAGR) of the Confined Space Lighting?
The projected CAGR is approximately 5.6%.
2. Which companies are prominent players in the Confined Space Lighting?
Key companies in the market include Western Technology, GE Lighting, Emerson Electric, Eaton, Hubbell Incorporated, Acuity Brands, AZZ, Kenall Manufacturing, Nemalux, LDPI, Cree, ABB, Phoenix Products, Larson Electronics, Saurya Safety, Atexor.
3. What are the main segments of the Confined Space Lighting?
The market segments include Application, Types.
4. Can you provide details about the market size?
The market size is estimated to be USD 353 million as of 2022.
5. What are some drivers contributing to market growth?
N/A
6. What are the notable trends driving market growth?
N/A
7. Are there any restraints impacting market growth?
N/A
8. Can you provide examples of recent developments in the market?
N/A
9. What pricing options are available for accessing the report?
Pricing options include single-user, multi-user, and enterprise licenses priced at USD 2900.00, USD 4350.00, and USD 5800.00 respectively.
10. Is the market size provided in terms of value or volume?
The market size is provided in terms of value, measured in million.
11. Are there any specific market keywords associated with the report?
Yes, the market keyword associated with the report is "Confined Space Lighting," which aids in identifying and referencing the specific market segment covered.
12. How do I determine which pricing option suits my needs best?
The pricing options vary based on user requirements and access needs. Individual users may opt for single-user licenses, while businesses requiring broader access may choose multi-user or enterprise licenses for cost-effective access to the report.
13. Are there any additional resources or data provided in the Confined Space Lighting report?
While the report offers comprehensive insights, it's advisable to review the specific contents or supplementary materials provided to ascertain if additional resources or data are available.
14. How can I stay updated on further developments or reports in the Confined Space Lighting?
To stay informed about further developments, trends, and reports in the Confined Space Lighting, consider subscribing to industry newsletters, following relevant companies and organizations, or regularly checking reputable industry news sources and publications.
Methodology
Step 1 - Identification of Relevant Samples Size from Population Database


Step 2 - Approaches for Defining Global Market Size (Value, Volume* & Price*)

Note*: In applicable scenarios
Step 3 - Data Sources
Primary Research
- Web Analytics
- Survey Reports
- Research Institute
- Latest Research Reports
- Opinion Leaders
Secondary Research
- Annual Reports
- White Paper
- Latest Press Release
- Industry Association
- Paid Database
- Investor Presentations

Step 4 - Data Triangulation
Involves using different sources of information in order to increase the validity of a study
These sources are likely to be stakeholders in a program - participants, other researchers, program staff, other community members, and so on.
Then we put all data in single framework & apply various statistical tools to find out the dynamic on the market.
During the analysis stage, feedback from the stakeholder groups would be compared to determine areas of agreement as well as areas of divergence