

Key Insights
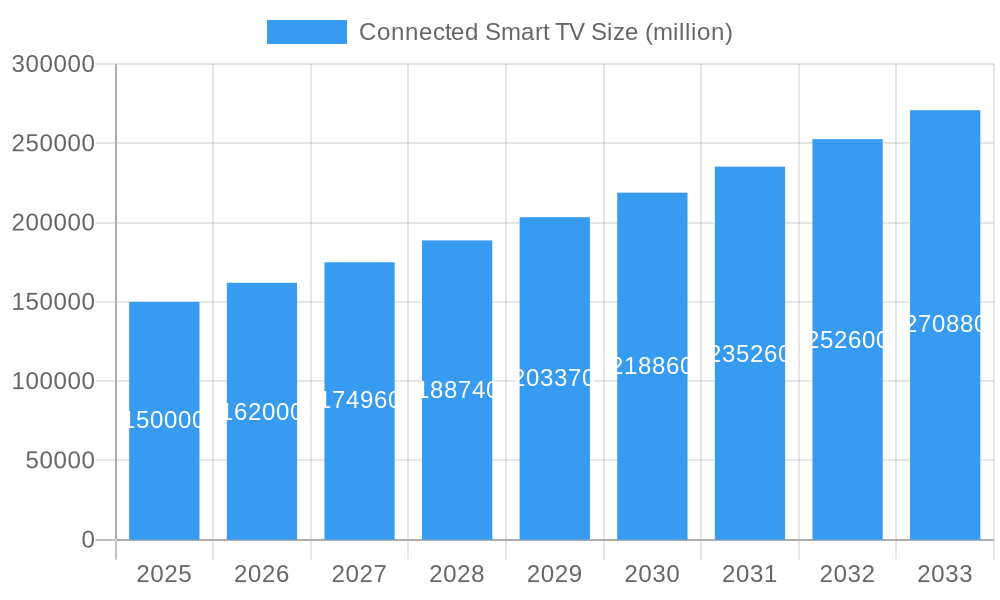
The global connected smart TV market is experiencing robust growth, driven by increasing internet penetration, the affordability of smart TVs, and a rising demand for high-quality streaming content. The market, estimated at $150 billion in 2025, is projected to maintain a healthy Compound Annual Growth Rate (CAGR) of 8% from 2025 to 2033, reaching approximately $280 billion by 2033. Key drivers include advancements in display technology (like OLED and QLED), the integration of voice assistants and smart home ecosystems, and the proliferation of over-the-top (OTT) streaming platforms like Netflix, Disney+, and Hulu. The rising adoption of 4K and 8K resolution displays further fuels market expansion. Leading brands such as Samsung, LG, TCL, and Hisense are intensely competing, leveraging innovative features and aggressive pricing strategies to capture market share. Emerging trends include the growing demand for larger screen sizes, improved gaming capabilities, and integration with other smart home devices. However, factors such as supply chain disruptions, economic fluctuations, and increasing competition from budget-friendly brands could pose restraints to market growth. Market segmentation is driven by screen size, resolution, operating system, and pricing tiers, catering to diverse consumer preferences.
Connected Smart TV Market Size (In Billion)
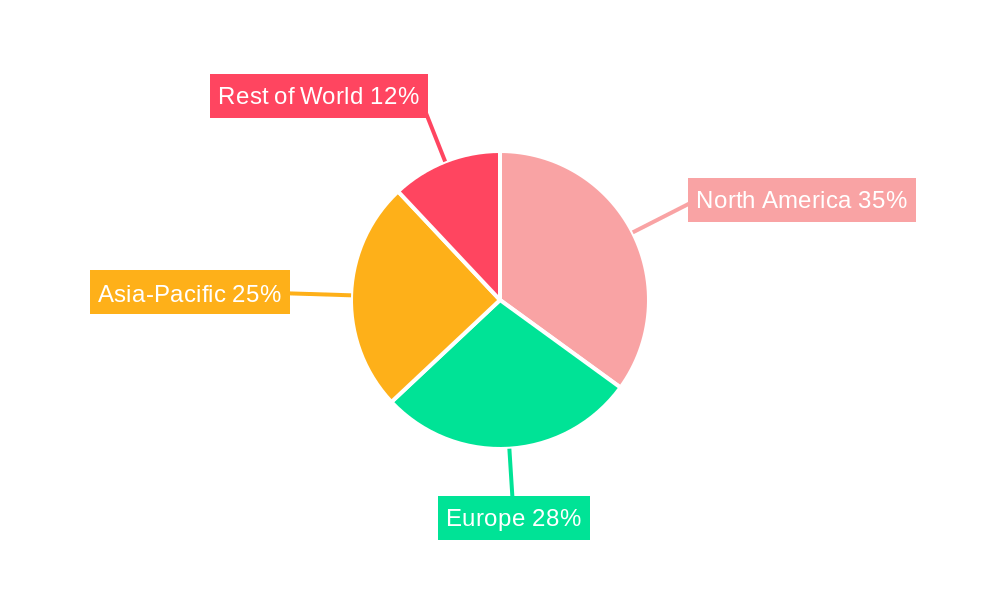
Geographic distribution is significant, with North America and Europe currently leading in market share due to high adoption rates. However, the Asia-Pacific region shows substantial growth potential driven by increasing disposable income and a young, tech-savvy population. The competitive landscape is dominated by established players, but the emergence of Chinese brands like Xiaomi and Hisense is reshaping market dynamics, offering cost-effective alternatives and challenging the dominance of traditional players. The future of the connected smart TV market hinges on continuous technological advancements, providing consumers with an ever-improving viewing experience and seamless integration with their digital lifestyles. Companies are focusing on enhancing user experience, improving energy efficiency, and integrating advanced features such as AI-powered personalization and enhanced gaming functionality to remain competitive.
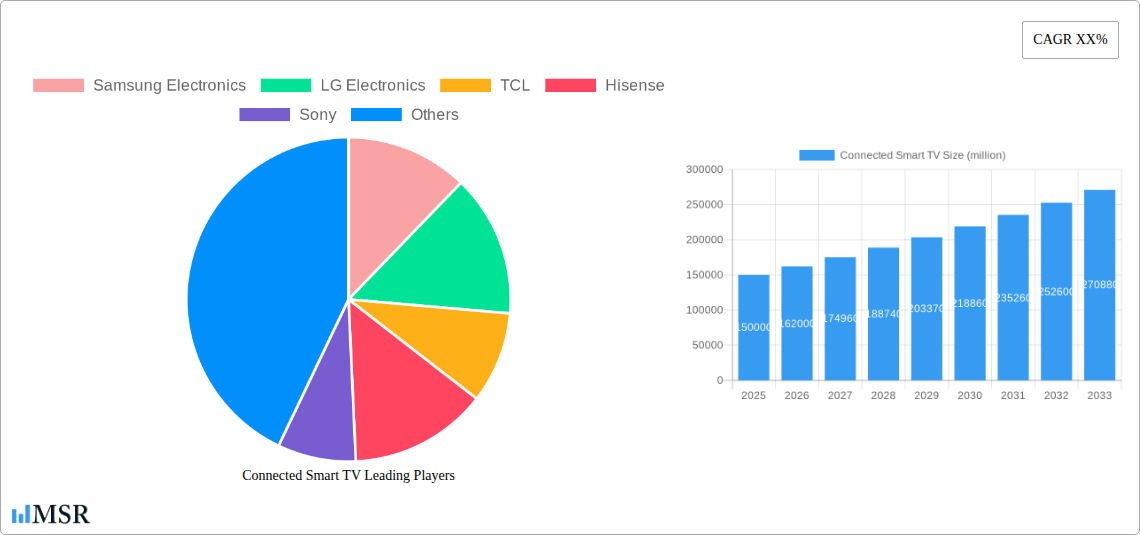
Connected Smart TV Company Market Share
Connected Smart TV Market Report: A Comprehensive Analysis (2019-2033)
This in-depth report provides a comprehensive analysis of the global Connected Smart TV market, offering invaluable insights for industry stakeholders, investors, and strategic decision-makers. The report covers the period from 2019 to 2033, with a focus on the estimated year 2025 and a forecast period spanning 2025-2033. The market is analyzed across key segments and regions, detailing market concentration, technological advancements, consumer trends, and the competitive landscape. The total market value exceeded $xx million in 2024 and is projected to reach $xx million by 2033, exhibiting a CAGR of xx%.
Connected Smart TV Market Concentration & Dynamics
The global Connected Smart TV market is moderately concentrated, with several key players holding significant market share. Samsung Electronics, LG Electronics, TCL, and Hisense are among the leading brands, collectively controlling an estimated 60% of the global market in 2024. The market exhibits a dynamic competitive landscape characterized by ongoing innovation, strategic mergers and acquisitions (M&A), and evolving regulatory frameworks.
- Market Share (2024 Estimate): Samsung (20%), LG Electronics (15%), TCL (10%), Hisense (8%), others (47%).
- M&A Activity (2019-2024): Over xx M&A deals were recorded, primarily focusing on technology integration and market expansion. These deals primarily involved smaller companies being acquired by larger players to enhance their technological capabilities and broaden their product portfolios.
- Innovation Ecosystems: The market is fueled by collaborations between manufacturers, software developers, and content providers, creating a robust ecosystem of innovation. This is driving the integration of new features such as AI, enhanced streaming capabilities and improved user interfaces.
- Regulatory Frameworks: Varying global regulations regarding data privacy and content accessibility significantly influence market dynamics. These regulations are shaping the development of features focused on user privacy and security.
- Substitute Products: While Connected Smart TVs dominate the home entertainment market, increasing penetration of other screen sizes and streaming devices presents a challenge to the growth of this market sector.
- End-User Trends: The increasing demand for high-resolution displays, enhanced streaming capabilities, and smart home integration is driving market growth. Consumers are also showing a preference for larger screen sizes and personalized content experiences.
Connected Smart TV Industry Insights & Trends
The Connected Smart TV market is experiencing significant growth, driven by a confluence of factors including rising disposable incomes, increasing internet penetration, the proliferation of streaming services, and technological advancements. The global market size exceeded $xx million in 2024 and is projected to reach $xx million by 2033. This growth is further fueled by technological disruptions like the integration of artificial intelligence (AI), 8K resolution displays, and advanced voice control features, enhancing user experience and creating new opportunities. Consumer behavior is also evolving, with a growing preference for large-screen TVs with immersive viewing experiences.
Key Markets & Segments Leading Connected Smart TV
North America and Asia-Pacific currently dominate the Connected Smart TV market, driven by strong economic growth, high internet penetration, and a large consumer base with high disposable incomes. Specific countries like the USA, China, and India are key contributors to the overall market size.
- North America: High disposable incomes, strong demand for premium features, and early adoption of new technologies drive market growth.
- Asia-Pacific: Rapid economic growth, expanding middle class, and increasing urbanization are key contributors to the market expansion.
- Europe: The European market is witnessing steady growth driven by increasing disposable income and a significant increase in the adoption of streaming platforms and other OTT content.
Drivers for Dominant Regions:
- High Disposable Incomes: Affordability of smart TVs is a primary driver in regions with high disposable income.
- Increased Internet Penetration: The expansion of broadband infrastructure and wireless connectivity are significantly driving the growth in this sector.
- Government Initiatives: Government initiatives to promote digitalization and infrastructure development further increase market growth.
- Technological Advancements: Continuous innovation in display technology, smart features, and operating systems attracts consumers and drives market growth.
Connected Smart TV Product Developments
Recent product developments in the Connected Smart TV market focus on enhanced user experience through improved features such as AI-powered voice assistants, 8K resolution displays, and seamless integration with other smart home devices. The integration of HDR (High Dynamic Range) technology has significantly improved picture quality, while advancements in processing power allow for smoother and more responsive interfaces. Competition is driving innovations in areas such as OLED technology, Mini-LED backlighting, and improved gaming capabilities.
Challenges in the Connected Smart TV Market
The Connected Smart TV market faces several challenges, including stringent regulations regarding data privacy, supply chain disruptions affecting component availability, and intense competition from established and emerging players. These factors can lead to increased production costs and hinder market expansion. Furthermore, concerns about the environmental impact of e-waste generated from the rapid technological upgrades also presents a challenge. The increasing cost of raw materials also contributes to the challenges.
Forces Driving Connected Smart TV Growth
Several factors are driving the growth of the Connected Smart TV market. Technological advancements such as the development of 8K resolution displays and AI-powered features are enhancing the user experience and creating new demand. Government initiatives promoting digital infrastructure development and economic growth in developing countries are also boosting the market. Furthermore, increased adoption of streaming services and online gaming are driving this expansion further.
Long-Term Growth Catalysts in Connected Smart TV
Long-term growth in the Connected Smart TV market will be fueled by continuous innovation in display technologies, the expansion of smart home ecosystems, and the integration of advanced features like AI and augmented reality (AR). Strategic partnerships between manufacturers and content providers will also play a crucial role in driving market expansion. The increasing penetration of 5G technology will further fuel the growth of this sector.
Emerging Opportunities in Connected Smart TV
Emerging opportunities include the growth of the gaming market on Connected Smart TVs, the expansion of AR/VR integration in smart TV's, and the increasing adoption of smart TVs in developing economies. The demand for personalized content and interactive experiences will create new opportunities for innovation and market expansion. The integration of smart TVs with other connected devices within the smart home ecosystem provides a strong opportunity for significant market growth.
Leading Players in the Connected Smart TV Sector
- Samsung Electronics
- LG Electronics
- TCL
- Hisense
- Sony
- Skyworth
- Foxconn (Sharp)
- Xiaomi
- Vizio
- Haier
- Panasonic
- Changhong
- Konka
Key Milestones in Connected Smart TV Industry
- 2019: Widespread adoption of 4K resolution TVs.
- 2020: Increased integration of voice assistants and smart home capabilities.
- 2021: Significant growth in streaming services driving demand for smart TVs.
- 2022: Early adoption of 8K resolution and Mini-LED backlighting technologies.
- 2023: Expansion of gaming capabilities and integration with cloud gaming services.
- 2024: Growing adoption of AI-powered features and personalized content recommendations.
Strategic Outlook for Connected Smart TV Market
The future of the Connected Smart TV market is bright, driven by continuous technological innovation, expanding consumer demand, and the growth of the streaming market. Strategic partnerships, aggressive R&D investments, and expansion into emerging markets will be key to success for manufacturers. The integration of advanced features and improved user experiences will remain central to achieving sustained growth and securing a leading market position.
Connected Smart TV Segmentation
-
1. Application
- 1.1. Family
- 1.2. Public
-
2. Types
- 2.1. 32 inch
- 2.2. 40 inch
- 2.3. 42 inch
- 2.4. 55 inch
- 2.5. Above 60 inch
Connected Smart TV Segmentation By Geography
-
1. North America
- 1.1. United States
- 1.2. Canada
- 1.3. Mexico
-
2. South America
- 2.1. Brazil
- 2.2. Argentina
- 2.3. Rest of South America
-
3. Europe
- 3.1. United Kingdom
- 3.2. Germany
- 3.3. France
- 3.4. Italy
- 3.5. Spain
- 3.6. Russia
- 3.7. Benelux
- 3.8. Nordics
- 3.9. Rest of Europe
-
4. Middle East & Africa
- 4.1. Turkey
- 4.2. Israel
- 4.3. GCC
- 4.4. North Africa
- 4.5. South Africa
- 4.6. Rest of Middle East & Africa
-
5. Asia Pacific
- 5.1. China
- 5.2. India
- 5.3. Japan
- 5.4. South Korea
- 5.5. ASEAN
- 5.6. Oceania
- 5.7. Rest of Asia Pacific
Connected Smart TV Regional Market Share
Geographic Coverage of Connected Smart TV
Connected Smart TV REPORT HIGHLIGHTS
| Aspects | Details |
|---|---|
| Study Period | 2020-2034 |
| Base Year | 2025 |
| Estimated Year | 2026 |
| Forecast Period | 2026-2034 |
| Historical Period | 2020-2025 |
| Growth Rate | CAGR of XX% from 2020-2034 |
| Segmentation |
|
Table of Contents
- 1. Introduction
- 1.1. Research Scope
- 1.2. Market Segmentation
- 1.3. Research Objective
- 1.4. Definitions and Assumptions
- 2. Executive Summary
- 2.1. Market Snapshot
- 3. Market Dynamics
- 3.1. Market Drivers
- 3.2. Market Restrains
- 3.3. Market Trends
- 3.4. Market Opportunities
- 4. Market Factor Analysis
- 4.1. Porters Five Forces
- 4.1.1. Bargaining Power of Suppliers
- 4.1.2. Bargaining Power of Buyers
- 4.1.3. Threat of New Entrants
- 4.1.4. Threat of Substitutes
- 4.1.5. Competitive Rivalry
- 4.2. PESTEL analysis
- 4.3. BCG Analysis
- 4.3.1. Stars (High Growth, High Market Share)
- 4.3.2. Cash Cows (Low Growth, High Market Share)
- 4.3.3. Question Mark (High Growth, Low Market Share)
- 4.3.4. Dogs (Low Growth, Low Market Share)
- 4.4. Ansoff Matrix Analysis
- 4.5. Supply Chain Analysis
- 4.6. Regulatory Landscape
- 4.7. Current Market Potential and Opportunity Assessment (TAM–SAM–SOM Framework)
- 4.8. MSR Analyst Note
- 4.1. Porters Five Forces
- 5. Market Analysis, Insights and Forecast 2021-2033
- 5.1. Market Analysis, Insights and Forecast - by Application
- 5.1.1. Family
- 5.1.2. Public
- 5.2. Market Analysis, Insights and Forecast - by Types
- 5.2.1. 32 inch
- 5.2.2. 40 inch
- 5.2.3. 42 inch
- 5.2.4. 55 inch
- 5.2.5. Above 60 inch
- 5.3. Market Analysis, Insights and Forecast - by Region
- 5.3.1. North America
- 5.3.2. South America
- 5.3.3. Europe
- 5.3.4. Middle East & Africa
- 5.3.5. Asia Pacific
- 5.1. Market Analysis, Insights and Forecast - by Application
- 6. Global Connected Smart TV Analysis, Insights and Forecast, 2021-2033
- 6.1. Market Analysis, Insights and Forecast - by Application
- 6.1.1. Family
- 6.1.2. Public
- 6.2. Market Analysis, Insights and Forecast - by Types
- 6.2.1. 32 inch
- 6.2.2. 40 inch
- 6.2.3. 42 inch
- 6.2.4. 55 inch
- 6.2.5. Above 60 inch
- 6.1. Market Analysis, Insights and Forecast - by Application
- 7. North America Connected Smart TV Analysis, Insights and Forecast, 2020-2032
- 7.1. Market Analysis, Insights and Forecast - by Application
- 7.1.1. Family
- 7.1.2. Public
- 7.2. Market Analysis, Insights and Forecast - by Types
- 7.2.1. 32 inch
- 7.2.2. 40 inch
- 7.2.3. 42 inch
- 7.2.4. 55 inch
- 7.2.5. Above 60 inch
- 7.1. Market Analysis, Insights and Forecast - by Application
- 8. South America Connected Smart TV Analysis, Insights and Forecast, 2020-2032
- 8.1. Market Analysis, Insights and Forecast - by Application
- 8.1.1. Family
- 8.1.2. Public
- 8.2. Market Analysis, Insights and Forecast - by Types
- 8.2.1. 32 inch
- 8.2.2. 40 inch
- 8.2.3. 42 inch
- 8.2.4. 55 inch
- 8.2.5. Above 60 inch
- 8.1. Market Analysis, Insights and Forecast - by Application
- 9. Europe Connected Smart TV Analysis, Insights and Forecast, 2020-2032
- 9.1. Market Analysis, Insights and Forecast - by Application
- 9.1.1. Family
- 9.1.2. Public
- 9.2. Market Analysis, Insights and Forecast - by Types
- 9.2.1. 32 inch
- 9.2.2. 40 inch
- 9.2.3. 42 inch
- 9.2.4. 55 inch
- 9.2.5. Above 60 inch
- 9.1. Market Analysis, Insights and Forecast - by Application
- 10. Middle East & Africa Connected Smart TV Analysis, Insights and Forecast, 2020-2032
- 10.1. Market Analysis, Insights and Forecast - by Application
- 10.1.1. Family
- 10.1.2. Public
- 10.2. Market Analysis, Insights and Forecast - by Types
- 10.2.1. 32 inch
- 10.2.2. 40 inch
- 10.2.3. 42 inch
- 10.2.4. 55 inch
- 10.2.5. Above 60 inch
- 10.1. Market Analysis, Insights and Forecast - by Application
- 11. Asia Pacific Connected Smart TV Analysis, Insights and Forecast, 2020-2032
- 11.1. Market Analysis, Insights and Forecast - by Application
- 11.1.1. Family
- 11.1.2. Public
- 11.2. Market Analysis, Insights and Forecast - by Types
- 11.2.1. 32 inch
- 11.2.2. 40 inch
- 11.2.3. 42 inch
- 11.2.4. 55 inch
- 11.2.5. Above 60 inch
- 11.1. Market Analysis, Insights and Forecast - by Application
- 12. Competitive Analysis
- 12.1. Company Profiles
- 12.1.1 Samsung Electronics
- 12.1.1.1. Company Overview
- 12.1.1.2. Products
- 12.1.1.3. Company Financials
- 12.1.1.4. SWOT Analysis
- 12.1.2 LG Electronics
- 12.1.2.1. Company Overview
- 12.1.2.2. Products
- 12.1.2.3. Company Financials
- 12.1.2.4. SWOT Analysis
- 12.1.3 TCL
- 12.1.3.1. Company Overview
- 12.1.3.2. Products
- 12.1.3.3. Company Financials
- 12.1.3.4. SWOT Analysis
- 12.1.4 Hisense
- 12.1.4.1. Company Overview
- 12.1.4.2. Products
- 12.1.4.3. Company Financials
- 12.1.4.4. SWOT Analysis
- 12.1.5 Sony
- 12.1.5.1. Company Overview
- 12.1.5.2. Products
- 12.1.5.3. Company Financials
- 12.1.5.4. SWOT Analysis
- 12.1.6 Skyworth
- 12.1.6.1. Company Overview
- 12.1.6.2. Products
- 12.1.6.3. Company Financials
- 12.1.6.4. SWOT Analysis
- 12.1.7 Foxconn (Sharp)
- 12.1.7.1. Company Overview
- 12.1.7.2. Products
- 12.1.7.3. Company Financials
- 12.1.7.4. SWOT Analysis
- 12.1.8 Xiaomi
- 12.1.8.1. Company Overview
- 12.1.8.2. Products
- 12.1.8.3. Company Financials
- 12.1.8.4. SWOT Analysis
- 12.1.9 Vizio
- 12.1.9.1. Company Overview
- 12.1.9.2. Products
- 12.1.9.3. Company Financials
- 12.1.9.4. SWOT Analysis
- 12.1.10 Haier
- 12.1.10.1. Company Overview
- 12.1.10.2. Products
- 12.1.10.3. Company Financials
- 12.1.10.4. SWOT Analysis
- 12.1.11 Panasonic
- 12.1.11.1. Company Overview
- 12.1.11.2. Products
- 12.1.11.3. Company Financials
- 12.1.11.4. SWOT Analysis
- 12.1.12 Changhong
- 12.1.12.1. Company Overview
- 12.1.12.2. Products
- 12.1.12.3. Company Financials
- 12.1.12.4. SWOT Analysis
- 12.1.13 Konka
- 12.1.13.1. Company Overview
- 12.1.13.2. Products
- 12.1.13.3. Company Financials
- 12.1.13.4. SWOT Analysis
- 12.1.1 Samsung Electronics
- 12.2. Market Entropy
- 12.2.1 Company's Key Areas Served
- 12.2.2 Recent Developments
- 12.3. Company Market Share Analysis 2025
- 12.3.1 Top 5 Companies Market Share Analysis
- 12.3.2 Top 3 Companies Market Share Analysis
- 12.4. List of Potential Customers
- 13. Research Methodology
List of Figures
- Figure 1: Global Connected Smart TV Revenue Breakdown (million, %) by Region 2025 & 2033
- Figure 2: North America Connected Smart TV Revenue (million), by Application 2025 & 2033
- Figure 3: North America Connected Smart TV Revenue Share (%), by Application 2025 & 2033
- Figure 4: North America Connected Smart TV Revenue (million), by Types 2025 & 2033
- Figure 5: North America Connected Smart TV Revenue Share (%), by Types 2025 & 2033
- Figure 6: North America Connected Smart TV Revenue (million), by Country 2025 & 2033
- Figure 7: North America Connected Smart TV Revenue Share (%), by Country 2025 & 2033
- Figure 8: South America Connected Smart TV Revenue (million), by Application 2025 & 2033
- Figure 9: South America Connected Smart TV Revenue Share (%), by Application 2025 & 2033
- Figure 10: South America Connected Smart TV Revenue (million), by Types 2025 & 2033
- Figure 11: South America Connected Smart TV Revenue Share (%), by Types 2025 & 2033
- Figure 12: South America Connected Smart TV Revenue (million), by Country 2025 & 2033
- Figure 13: South America Connected Smart TV Revenue Share (%), by Country 2025 & 2033
- Figure 14: Europe Connected Smart TV Revenue (million), by Application 2025 & 2033
- Figure 15: Europe Connected Smart TV Revenue Share (%), by Application 2025 & 2033
- Figure 16: Europe Connected Smart TV Revenue (million), by Types 2025 & 2033
- Figure 17: Europe Connected Smart TV Revenue Share (%), by Types 2025 & 2033
- Figure 18: Europe Connected Smart TV Revenue (million), by Country 2025 & 2033
- Figure 19: Europe Connected Smart TV Revenue Share (%), by Country 2025 & 2033
- Figure 20: Middle East & Africa Connected Smart TV Revenue (million), by Application 2025 & 2033
- Figure 21: Middle East & Africa Connected Smart TV Revenue Share (%), by Application 2025 & 2033
- Figure 22: Middle East & Africa Connected Smart TV Revenue (million), by Types 2025 & 2033
- Figure 23: Middle East & Africa Connected Smart TV Revenue Share (%), by Types 2025 & 2033
- Figure 24: Middle East & Africa Connected Smart TV Revenue (million), by Country 2025 & 2033
- Figure 25: Middle East & Africa Connected Smart TV Revenue Share (%), by Country 2025 & 2033
- Figure 26: Asia Pacific Connected Smart TV Revenue (million), by Application 2025 & 2033
- Figure 27: Asia Pacific Connected Smart TV Revenue Share (%), by Application 2025 & 2033
- Figure 28: Asia Pacific Connected Smart TV Revenue (million), by Types 2025 & 2033
- Figure 29: Asia Pacific Connected Smart TV Revenue Share (%), by Types 2025 & 2033
- Figure 30: Asia Pacific Connected Smart TV Revenue (million), by Country 2025 & 2033
- Figure 31: Asia Pacific Connected Smart TV Revenue Share (%), by Country 2025 & 2033
List of Tables
- Table 1: Global Connected Smart TV Revenue million Forecast, by Application 2020 & 2033
- Table 2: Global Connected Smart TV Revenue million Forecast, by Types 2020 & 2033
- Table 3: Global Connected Smart TV Revenue million Forecast, by Region 2020 & 2033
- Table 4: Global Connected Smart TV Revenue million Forecast, by Application 2020 & 2033
- Table 5: Global Connected Smart TV Revenue million Forecast, by Types 2020 & 2033
- Table 6: Global Connected Smart TV Revenue million Forecast, by Country 2020 & 2033
- Table 7: United States Connected Smart TV Revenue (million) Forecast, by Application 2020 & 2033
- Table 8: Canada Connected Smart TV Revenue (million) Forecast, by Application 2020 & 2033
- Table 9: Mexico Connected Smart TV Revenue (million) Forecast, by Application 2020 & 2033
- Table 10: Global Connected Smart TV Revenue million Forecast, by Application 2020 & 2033
- Table 11: Global Connected Smart TV Revenue million Forecast, by Types 2020 & 2033
- Table 12: Global Connected Smart TV Revenue million Forecast, by Country 2020 & 2033
- Table 13: Brazil Connected Smart TV Revenue (million) Forecast, by Application 2020 & 2033
- Table 14: Argentina Connected Smart TV Revenue (million) Forecast, by Application 2020 & 2033
- Table 15: Rest of South America Connected Smart TV Revenue (million) Forecast, by Application 2020 & 2033
- Table 16: Global Connected Smart TV Revenue million Forecast, by Application 2020 & 2033
- Table 17: Global Connected Smart TV Revenue million Forecast, by Types 2020 & 2033
- Table 18: Global Connected Smart TV Revenue million Forecast, by Country 2020 & 2033
- Table 19: United Kingdom Connected Smart TV Revenue (million) Forecast, by Application 2020 & 2033
- Table 20: Germany Connected Smart TV Revenue (million) Forecast, by Application 2020 & 2033
- Table 21: France Connected Smart TV Revenue (million) Forecast, by Application 2020 & 2033
- Table 22: Italy Connected Smart TV Revenue (million) Forecast, by Application 2020 & 2033
- Table 23: Spain Connected Smart TV Revenue (million) Forecast, by Application 2020 & 2033
- Table 24: Russia Connected Smart TV Revenue (million) Forecast, by Application 2020 & 2033
- Table 25: Benelux Connected Smart TV Revenue (million) Forecast, by Application 2020 & 2033
- Table 26: Nordics Connected Smart TV Revenue (million) Forecast, by Application 2020 & 2033
- Table 27: Rest of Europe Connected Smart TV Revenue (million) Forecast, by Application 2020 & 2033
- Table 28: Global Connected Smart TV Revenue million Forecast, by Application 2020 & 2033
- Table 29: Global Connected Smart TV Revenue million Forecast, by Types 2020 & 2033
- Table 30: Global Connected Smart TV Revenue million Forecast, by Country 2020 & 2033
- Table 31: Turkey Connected Smart TV Revenue (million) Forecast, by Application 2020 & 2033
- Table 32: Israel Connected Smart TV Revenue (million) Forecast, by Application 2020 & 2033
- Table 33: GCC Connected Smart TV Revenue (million) Forecast, by Application 2020 & 2033
- Table 34: North Africa Connected Smart TV Revenue (million) Forecast, by Application 2020 & 2033
- Table 35: South Africa Connected Smart TV Revenue (million) Forecast, by Application 2020 & 2033
- Table 36: Rest of Middle East & Africa Connected Smart TV Revenue (million) Forecast, by Application 2020 & 2033
- Table 37: Global Connected Smart TV Revenue million Forecast, by Application 2020 & 2033
- Table 38: Global Connected Smart TV Revenue million Forecast, by Types 2020 & 2033
- Table 39: Global Connected Smart TV Revenue million Forecast, by Country 2020 & 2033
- Table 40: China Connected Smart TV Revenue (million) Forecast, by Application 2020 & 2033
- Table 41: India Connected Smart TV Revenue (million) Forecast, by Application 2020 & 2033
- Table 42: Japan Connected Smart TV Revenue (million) Forecast, by Application 2020 & 2033
- Table 43: South Korea Connected Smart TV Revenue (million) Forecast, by Application 2020 & 2033
- Table 44: ASEAN Connected Smart TV Revenue (million) Forecast, by Application 2020 & 2033
- Table 45: Oceania Connected Smart TV Revenue (million) Forecast, by Application 2020 & 2033
- Table 46: Rest of Asia Pacific Connected Smart TV Revenue (million) Forecast, by Application 2020 & 2033
Frequently Asked Questions
1. What is the projected Compound Annual Growth Rate (CAGR) of the Connected Smart TV?
The projected CAGR is approximately XX%.
2. Which companies are prominent players in the Connected Smart TV?
Key companies in the market include Samsung Electronics, LG Electronics, TCL, Hisense, Sony, Skyworth, Foxconn (Sharp), Xiaomi, Vizio, Haier, Panasonic, Changhong, Konka.
3. What are the main segments of the Connected Smart TV?
The market segments include Application, Types.
4. Can you provide details about the market size?
The market size is estimated to be USD XXX million as of 2022.
5. What are some drivers contributing to market growth?
N/A
6. What are the notable trends driving market growth?
N/A
7. Are there any restraints impacting market growth?
N/A
8. Can you provide examples of recent developments in the market?
N/A
9. What pricing options are available for accessing the report?
Pricing options include single-user, multi-user, and enterprise licenses priced at USD 2900.00, USD 4350.00, and USD 5800.00 respectively.
10. Is the market size provided in terms of value or volume?
The market size is provided in terms of value, measured in million.
11. Are there any specific market keywords associated with the report?
Yes, the market keyword associated with the report is "Connected Smart TV," which aids in identifying and referencing the specific market segment covered.
12. How do I determine which pricing option suits my needs best?
The pricing options vary based on user requirements and access needs. Individual users may opt for single-user licenses, while businesses requiring broader access may choose multi-user or enterprise licenses for cost-effective access to the report.
13. Are there any additional resources or data provided in the Connected Smart TV report?
While the report offers comprehensive insights, it's advisable to review the specific contents or supplementary materials provided to ascertain if additional resources or data are available.
14. How can I stay updated on further developments or reports in the Connected Smart TV?
To stay informed about further developments, trends, and reports in the Connected Smart TV, consider subscribing to industry newsletters, following relevant companies and organizations, or regularly checking reputable industry news sources and publications.
Methodology
Step 1 - Identification of Relevant Samples Size from Population Database


Step 2 - Approaches for Defining Global Market Size (Value, Volume* & Price*)

Note*: In applicable scenarios
Step 3 - Data Sources
Primary Research
- Web Analytics
- Survey Reports
- Research Institute
- Latest Research Reports
- Opinion Leaders
Secondary Research
- Annual Reports
- White Paper
- Latest Press Release
- Industry Association
- Paid Database
- Investor Presentations

Step 4 - Data Triangulation
Involves using different sources of information in order to increase the validity of a study
These sources are likely to be stakeholders in a program - participants, other researchers, program staff, other community members, and so on.
Then we put all data in single framework & apply various statistical tools to find out the dynamic on the market.
During the analysis stage, feedback from the stakeholder groups would be compared to determine areas of agreement as well as areas of divergence