

Key Insights
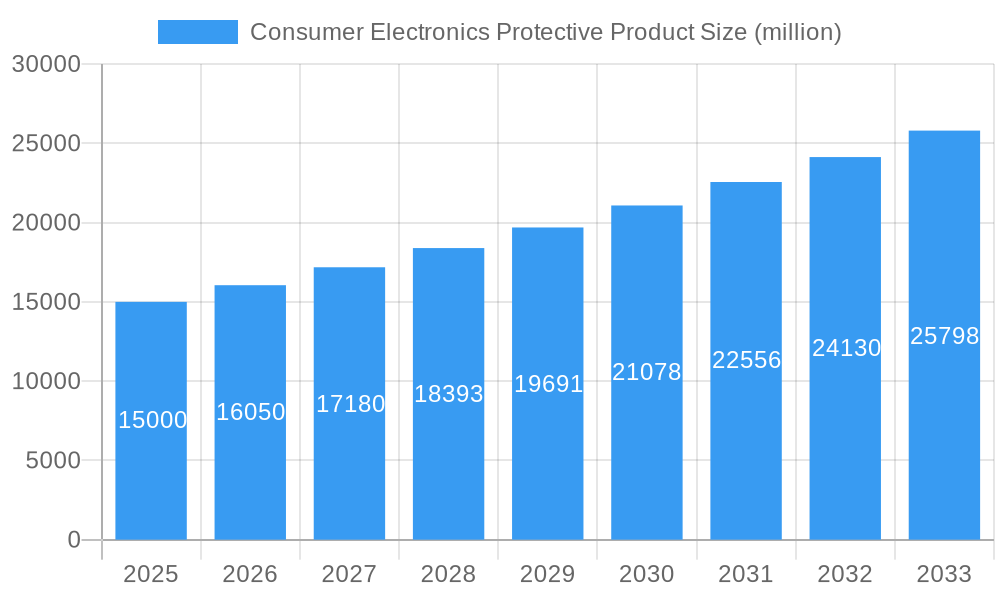
The global consumer electronics protective products market is poised for significant expansion, driven by the escalating adoption of smartphones, tablets, and other portable devices. Projected to reach $10.47 billion by 2025, the market is anticipated to grow at a Compound Annual Growth Rate (CAGR) of 12.14% from 2025 to 2033. Key growth drivers include the increasing prevalence of premium electronics, heightened consumer awareness of device protection needs against accidental damage, and ongoing innovation in product design and materials. Consumers are demonstrating a growing willingness to invest in high-quality cases, screen protectors, and accessories to preserve device lifespan, functionality, and aesthetic appeal. The burgeoning e-commerce landscape further facilitates market growth by offering convenient access to a diverse product range.
Consumer Electronics Protective Product Market Size (In Billion)
Primary market segments encompass protective cases (for phones, tablets, and laptops), screen protectors (including tempered glass and film), and complementary accessories such as straps, stands, and cleaning kits. Leading market participants like OtterBox, Spigen, Tech21, Belkin, Case-Mate, Incipio, ZAGG, and BodyGuardz are actively shaping the market through product innovation, brand establishment, and strategic distribution. Despite substantial growth prospects, the market faces challenges such as rising raw material costs, intense competition from emerging brands, and the inherent cyclicality of consumer electronics adoption. Nonetheless, the sustained expansion of the consumer electronics sector and the increasing demand for robust device protection are expected to offset these challenges, fostering continued growth and innovation within the consumer electronics protective products industry throughout the forecast period.
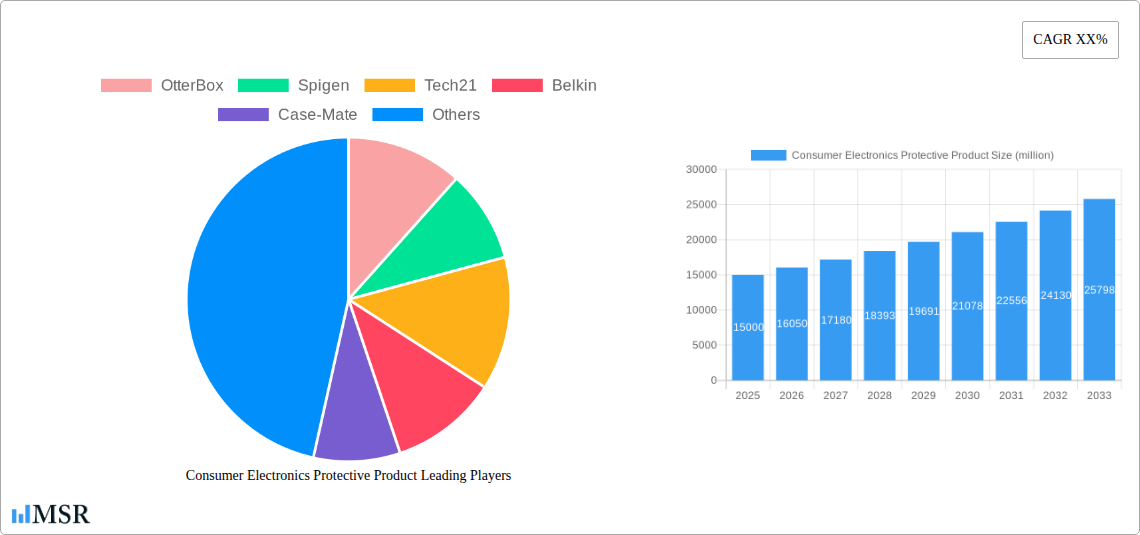
Consumer Electronics Protective Product Company Market Share
Consumer Electronics Protective Product Market Report: 2019-2033
This comprehensive report provides an in-depth analysis of the global consumer electronics protective product market, offering valuable insights for industry stakeholders, investors, and businesses seeking to navigate this dynamic landscape. The study covers the period 2019-2033, with a focus on the 2025-2033 forecast period. The report highlights key market trends, competitive dynamics, and emerging opportunities, leveraging extensive data analysis and expert insights. The market value is expected to reach xx million by 2033, exhibiting a CAGR of xx% during the forecast period. Leading players such as OtterBox, Spigen, Tech21, Belkin, Case-Mate, Incipio, ZAGG, and BodyGuardz are analyzed in detail.
Consumer Electronics Protective Product Market Concentration & Dynamics
The consumer electronics protective product market exhibits a moderately concentrated landscape, with key players holding significant market share. OtterBox, Spigen, and ZAGG command a considerable portion, while other players like Belkin, Incipio, and Tech21 compete aggressively for market share. The market is characterized by a dynamic innovation ecosystem, driven by continuous advancements in materials science and manufacturing techniques. Regulatory frameworks, particularly those concerning material safety and environmental compliance, significantly influence product development and market entry. Substitute products, such as self-healing films and screen protectors with enhanced durability, present ongoing competitive pressure. Evolving consumer preferences, particularly towards sustainable and aesthetically pleasing designs, are shaping product innovation. The historical period (2019-2024) witnessed xx M&A deals, indicating consolidation within the industry. Market share data for 2025 reveals:
- OtterBox: xx%
- Spigen: xx%
- ZAGG: xx%
- Others: xx%
Consumer Electronics Protective Product Industry Insights & Trends
The global consumer electronics protective product market is experiencing robust growth, driven by several factors. The increasing adoption of smartphones, tablets, and other smart devices fuels demand for protective accessories. Technological disruptions, such as the introduction of flexible and foldable devices, have created new opportunities for specialized protective solutions. Consumers' growing awareness of device fragility and the high cost of repairs are further bolstering market growth. Evolving consumer preferences towards aesthetically pleasing and functional protective cases are influencing product designs. The market size reached xx million in 2025 and is projected to reach xx million by 2033, showcasing a substantial growth trajectory. Key growth drivers include:
- Rising Smartphone Penetration
- Increasing Awareness of Device Damage
- Technological Advancements in Protective Materials
- Growing Demand for Stylish & Functional Cases
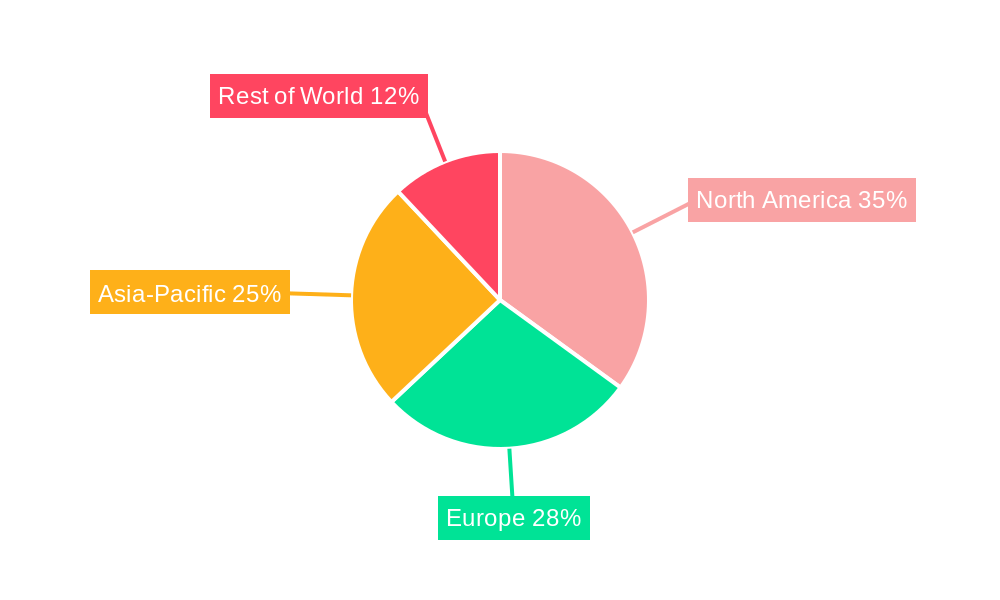
Key Markets & Segments Leading Consumer Electronics Protective Product
The North American market currently dominates the consumer electronics protective product sector, driven by high smartphone penetration, a strong consumer electronics market, and high disposable income. This dominance is further fueled by robust e-commerce infrastructure and a culture of early adoption of new technologies. Other regions, including Europe and Asia Pacific, show significant growth potential, although they are currently behind North America in terms of market size.
- Drivers for North American Dominance:
- High Smartphone Penetration Rates
- Strong Consumer Spending Power
- Developed E-commerce Infrastructure
- Early Adoption of New Technologies
- Other Key Regions: The Asia-Pacific region presents a considerable growth opportunity due to rapid economic growth and an increasing young population with high smartphone adoption. Europe shows steady growth due to consistent consumer electronics demand.
Consumer Electronics Protective Product Product Developments
Recent product innovations focus on enhanced durability, improved shock absorption, antimicrobial properties, and seamless integration with wireless charging technology. The integration of advanced materials, such as aramid fiber and military-grade polymers, provides superior protection against drops and impacts. Many products incorporate innovative designs that enhance grip and prevent accidental slips. These advancements not only improve protection but also cater to evolving consumer preferences for style and functionality.
Challenges in the Consumer Electronics Protective Product Market
The consumer electronics protective product market faces several challenges. Supply chain disruptions, particularly concerning raw material sourcing, can impact production and pricing. Intense competition among numerous players necessitates continuous innovation and aggressive marketing to maintain market share. Fluctuations in raw material costs (e.g., plastics, polymers) can impact product pricing and profitability. Furthermore, stringent environmental regulations regarding material composition and disposal can add to the cost of production.
Forces Driving Consumer Electronics Protective Product Growth
Several factors contribute to the ongoing growth of this market. Technological advancements in materials science continuously improve the durability and functionality of protective products. The increasing affordability of smartphones and other smart devices in emerging markets expands the potential customer base. Furthermore, favorable government policies promoting the electronics industry in certain regions stimulate market expansion.
Long-Term Growth Catalysts in Consumer Electronics Protective Product
Long-term growth will be driven by continuous innovation in materials and design. Strategic partnerships between protective case manufacturers and device manufacturers will ensure compatibility and enhance market reach. Expansion into new markets, particularly in developing economies with rising smartphone adoption, will contribute significantly to long-term growth.
Emerging Opportunities in Consumer Electronics Protective Product
Emerging opportunities include developing protective solutions for wearable devices, augmented reality (AR) and virtual reality (VR) headsets, and other emerging technologies. The growing demand for sustainable and eco-friendly materials presents an opportunity for manufacturers to differentiate themselves. Personalized and customizable cases, catering to individual consumer preferences, also represent a significant growth area.
Key Milestones in Consumer Electronics Protective Product Industry
- 2020, Q3: Launch of antimicrobial protective cases by several leading brands.
- 2021, Q1: OtterBox acquires a smaller competitor, expanding its market share.
- 2022, Q4: Introduction of MagSafe-compatible protective cases for iPhones.
- 2023, Q2: Spigen releases a series of sustainable, biodegradable protective cases.
Strategic Outlook for Consumer Electronics Protective Product Market
The consumer electronics protective product market holds immense potential for growth, fueled by technological advancements, increasing smartphone penetration, and evolving consumer preferences. Strategic opportunities include developing innovative products using sustainable materials, expanding into new geographical markets, and forging strategic partnerships to enhance brand visibility and market reach. The market is poised for continued expansion, driven by the ever-growing demand for reliable protection for valuable electronic devices.
Consumer Electronics Protective Product Segmentation
-
1. Application
- 1.1. Smartphones
- 1.2. Tablets
- 1.3. Laptops
- 1.4. Cameras
-
2. Types
- 2.1. Cases and Covers
- 2.2. Screen Protectors
- 2.3. Others
Consumer Electronics Protective Product Segmentation By Geography
-
1. North America
- 1.1. United States
- 1.2. Canada
- 1.3. Mexico
-
2. South America
- 2.1. Brazil
- 2.2. Argentina
- 2.3. Rest of South America
-
3. Europe
- 3.1. United Kingdom
- 3.2. Germany
- 3.3. France
- 3.4. Italy
- 3.5. Spain
- 3.6. Russia
- 3.7. Benelux
- 3.8. Nordics
- 3.9. Rest of Europe
-
4. Middle East & Africa
- 4.1. Turkey
- 4.2. Israel
- 4.3. GCC
- 4.4. North Africa
- 4.5. South Africa
- 4.6. Rest of Middle East & Africa
-
5. Asia Pacific
- 5.1. China
- 5.2. India
- 5.3. Japan
- 5.4. South Korea
- 5.5. ASEAN
- 5.6. Oceania
- 5.7. Rest of Asia Pacific
Consumer Electronics Protective Product Regional Market Share
Geographic Coverage of Consumer Electronics Protective Product
Consumer Electronics Protective Product REPORT HIGHLIGHTS
| Aspects | Details |
|---|---|
| Study Period | 2020-2034 |
| Base Year | 2025 |
| Estimated Year | 2026 |
| Forecast Period | 2026-2034 |
| Historical Period | 2020-2025 |
| Growth Rate | CAGR of 12.14% from 2020-2034 |
| Segmentation |
|
Table of Contents
- 1. Introduction
- 1.1. Research Scope
- 1.2. Market Segmentation
- 1.3. Research Objective
- 1.4. Definitions and Assumptions
- 2. Executive Summary
- 2.1. Market Snapshot
- 3. Market Dynamics
- 3.1. Market Drivers
- 3.2. Market Restrains
- 3.3. Market Trends
- 3.4. Market Opportunities
- 4. Market Factor Analysis
- 4.1. Porters Five Forces
- 4.1.1. Bargaining Power of Suppliers
- 4.1.2. Bargaining Power of Buyers
- 4.1.3. Threat of New Entrants
- 4.1.4. Threat of Substitutes
- 4.1.5. Competitive Rivalry
- 4.2. PESTEL analysis
- 4.3. BCG Analysis
- 4.3.1. Stars (High Growth, High Market Share)
- 4.3.2. Cash Cows (Low Growth, High Market Share)
- 4.3.3. Question Mark (High Growth, Low Market Share)
- 4.3.4. Dogs (Low Growth, Low Market Share)
- 4.4. Ansoff Matrix Analysis
- 4.5. Supply Chain Analysis
- 4.6. Regulatory Landscape
- 4.7. Current Market Potential and Opportunity Assessment (TAM–SAM–SOM Framework)
- 4.8. MSR Analyst Note
- 4.1. Porters Five Forces
- 5. Market Analysis, Insights and Forecast 2021-2033
- 5.1. Market Analysis, Insights and Forecast - by Application
- 5.1.1. Smartphones
- 5.1.2. Tablets
- 5.1.3. Laptops
- 5.1.4. Cameras
- 5.2. Market Analysis, Insights and Forecast - by Types
- 5.2.1. Cases and Covers
- 5.2.2. Screen Protectors
- 5.2.3. Others
- 5.3. Market Analysis, Insights and Forecast - by Region
- 5.3.1. North America
- 5.3.2. South America
- 5.3.3. Europe
- 5.3.4. Middle East & Africa
- 5.3.5. Asia Pacific
- 5.1. Market Analysis, Insights and Forecast - by Application
- 6. Global Consumer Electronics Protective Product Analysis, Insights and Forecast, 2021-2033
- 6.1. Market Analysis, Insights and Forecast - by Application
- 6.1.1. Smartphones
- 6.1.2. Tablets
- 6.1.3. Laptops
- 6.1.4. Cameras
- 6.2. Market Analysis, Insights and Forecast - by Types
- 6.2.1. Cases and Covers
- 6.2.2. Screen Protectors
- 6.2.3. Others
- 6.1. Market Analysis, Insights and Forecast - by Application
- 7. North America Consumer Electronics Protective Product Analysis, Insights and Forecast, 2020-2032
- 7.1. Market Analysis, Insights and Forecast - by Application
- 7.1.1. Smartphones
- 7.1.2. Tablets
- 7.1.3. Laptops
- 7.1.4. Cameras
- 7.2. Market Analysis, Insights and Forecast - by Types
- 7.2.1. Cases and Covers
- 7.2.2. Screen Protectors
- 7.2.3. Others
- 7.1. Market Analysis, Insights and Forecast - by Application
- 8. South America Consumer Electronics Protective Product Analysis, Insights and Forecast, 2020-2032
- 8.1. Market Analysis, Insights and Forecast - by Application
- 8.1.1. Smartphones
- 8.1.2. Tablets
- 8.1.3. Laptops
- 8.1.4. Cameras
- 8.2. Market Analysis, Insights and Forecast - by Types
- 8.2.1. Cases and Covers
- 8.2.2. Screen Protectors
- 8.2.3. Others
- 8.1. Market Analysis, Insights and Forecast - by Application
- 9. Europe Consumer Electronics Protective Product Analysis, Insights and Forecast, 2020-2032
- 9.1. Market Analysis, Insights and Forecast - by Application
- 9.1.1. Smartphones
- 9.1.2. Tablets
- 9.1.3. Laptops
- 9.1.4. Cameras
- 9.2. Market Analysis, Insights and Forecast - by Types
- 9.2.1. Cases and Covers
- 9.2.2. Screen Protectors
- 9.2.3. Others
- 9.1. Market Analysis, Insights and Forecast - by Application
- 10. Middle East & Africa Consumer Electronics Protective Product Analysis, Insights and Forecast, 2020-2032
- 10.1. Market Analysis, Insights and Forecast - by Application
- 10.1.1. Smartphones
- 10.1.2. Tablets
- 10.1.3. Laptops
- 10.1.4. Cameras
- 10.2. Market Analysis, Insights and Forecast - by Types
- 10.2.1. Cases and Covers
- 10.2.2. Screen Protectors
- 10.2.3. Others
- 10.1. Market Analysis, Insights and Forecast - by Application
- 11. Asia Pacific Consumer Electronics Protective Product Analysis, Insights and Forecast, 2020-2032
- 11.1. Market Analysis, Insights and Forecast - by Application
- 11.1.1. Smartphones
- 11.1.2. Tablets
- 11.1.3. Laptops
- 11.1.4. Cameras
- 11.2. Market Analysis, Insights and Forecast - by Types
- 11.2.1. Cases and Covers
- 11.2.2. Screen Protectors
- 11.2.3. Others
- 11.1. Market Analysis, Insights and Forecast - by Application
- 12. Competitive Analysis
- 12.1. Company Profiles
- 12.1.1 OtterBox
- 12.1.1.1. Company Overview
- 12.1.1.2. Products
- 12.1.1.3. Company Financials
- 12.1.1.4. SWOT Analysis
- 12.1.2 Spigen
- 12.1.2.1. Company Overview
- 12.1.2.2. Products
- 12.1.2.3. Company Financials
- 12.1.2.4. SWOT Analysis
- 12.1.3 Tech21
- 12.1.3.1. Company Overview
- 12.1.3.2. Products
- 12.1.3.3. Company Financials
- 12.1.3.4. SWOT Analysis
- 12.1.4 Belkin
- 12.1.4.1. Company Overview
- 12.1.4.2. Products
- 12.1.4.3. Company Financials
- 12.1.4.4. SWOT Analysis
- 12.1.5 Case-Mate
- 12.1.5.1. Company Overview
- 12.1.5.2. Products
- 12.1.5.3. Company Financials
- 12.1.5.4. SWOT Analysis
- 12.1.6 Incipio
- 12.1.6.1. Company Overview
- 12.1.6.2. Products
- 12.1.6.3. Company Financials
- 12.1.6.4. SWOT Analysis
- 12.1.7 ZAGG
- 12.1.7.1. Company Overview
- 12.1.7.2. Products
- 12.1.7.3. Company Financials
- 12.1.7.4. SWOT Analysis
- 12.1.8 BodyGuardz
- 12.1.8.1. Company Overview
- 12.1.8.2. Products
- 12.1.8.3. Company Financials
- 12.1.8.4. SWOT Analysis
- 12.1.1 OtterBox
- 12.2. Market Entropy
- 12.2.1 Company's Key Areas Served
- 12.2.2 Recent Developments
- 12.3. Company Market Share Analysis 2025
- 12.3.1 Top 5 Companies Market Share Analysis
- 12.3.2 Top 3 Companies Market Share Analysis
- 12.4. List of Potential Customers
- 13. Research Methodology
List of Figures
- Figure 1: Global Consumer Electronics Protective Product Revenue Breakdown (billion, %) by Region 2025 & 2033
- Figure 2: Global Consumer Electronics Protective Product Volume Breakdown (K, %) by Region 2025 & 2033
- Figure 3: North America Consumer Electronics Protective Product Revenue (billion), by Application 2025 & 2033
- Figure 4: North America Consumer Electronics Protective Product Volume (K), by Application 2025 & 2033
- Figure 5: North America Consumer Electronics Protective Product Revenue Share (%), by Application 2025 & 2033
- Figure 6: North America Consumer Electronics Protective Product Volume Share (%), by Application 2025 & 2033
- Figure 7: North America Consumer Electronics Protective Product Revenue (billion), by Types 2025 & 2033
- Figure 8: North America Consumer Electronics Protective Product Volume (K), by Types 2025 & 2033
- Figure 9: North America Consumer Electronics Protective Product Revenue Share (%), by Types 2025 & 2033
- Figure 10: North America Consumer Electronics Protective Product Volume Share (%), by Types 2025 & 2033
- Figure 11: North America Consumer Electronics Protective Product Revenue (billion), by Country 2025 & 2033
- Figure 12: North America Consumer Electronics Protective Product Volume (K), by Country 2025 & 2033
- Figure 13: North America Consumer Electronics Protective Product Revenue Share (%), by Country 2025 & 2033
- Figure 14: North America Consumer Electronics Protective Product Volume Share (%), by Country 2025 & 2033
- Figure 15: South America Consumer Electronics Protective Product Revenue (billion), by Application 2025 & 2033
- Figure 16: South America Consumer Electronics Protective Product Volume (K), by Application 2025 & 2033
- Figure 17: South America Consumer Electronics Protective Product Revenue Share (%), by Application 2025 & 2033
- Figure 18: South America Consumer Electronics Protective Product Volume Share (%), by Application 2025 & 2033
- Figure 19: South America Consumer Electronics Protective Product Revenue (billion), by Types 2025 & 2033
- Figure 20: South America Consumer Electronics Protective Product Volume (K), by Types 2025 & 2033
- Figure 21: South America Consumer Electronics Protective Product Revenue Share (%), by Types 2025 & 2033
- Figure 22: South America Consumer Electronics Protective Product Volume Share (%), by Types 2025 & 2033
- Figure 23: South America Consumer Electronics Protective Product Revenue (billion), by Country 2025 & 2033
- Figure 24: South America Consumer Electronics Protective Product Volume (K), by Country 2025 & 2033
- Figure 25: South America Consumer Electronics Protective Product Revenue Share (%), by Country 2025 & 2033
- Figure 26: South America Consumer Electronics Protective Product Volume Share (%), by Country 2025 & 2033
- Figure 27: Europe Consumer Electronics Protective Product Revenue (billion), by Application 2025 & 2033
- Figure 28: Europe Consumer Electronics Protective Product Volume (K), by Application 2025 & 2033
- Figure 29: Europe Consumer Electronics Protective Product Revenue Share (%), by Application 2025 & 2033
- Figure 30: Europe Consumer Electronics Protective Product Volume Share (%), by Application 2025 & 2033
- Figure 31: Europe Consumer Electronics Protective Product Revenue (billion), by Types 2025 & 2033
- Figure 32: Europe Consumer Electronics Protective Product Volume (K), by Types 2025 & 2033
- Figure 33: Europe Consumer Electronics Protective Product Revenue Share (%), by Types 2025 & 2033
- Figure 34: Europe Consumer Electronics Protective Product Volume Share (%), by Types 2025 & 2033
- Figure 35: Europe Consumer Electronics Protective Product Revenue (billion), by Country 2025 & 2033
- Figure 36: Europe Consumer Electronics Protective Product Volume (K), by Country 2025 & 2033
- Figure 37: Europe Consumer Electronics Protective Product Revenue Share (%), by Country 2025 & 2033
- Figure 38: Europe Consumer Electronics Protective Product Volume Share (%), by Country 2025 & 2033
- Figure 39: Middle East & Africa Consumer Electronics Protective Product Revenue (billion), by Application 2025 & 2033
- Figure 40: Middle East & Africa Consumer Electronics Protective Product Volume (K), by Application 2025 & 2033
- Figure 41: Middle East & Africa Consumer Electronics Protective Product Revenue Share (%), by Application 2025 & 2033
- Figure 42: Middle East & Africa Consumer Electronics Protective Product Volume Share (%), by Application 2025 & 2033
- Figure 43: Middle East & Africa Consumer Electronics Protective Product Revenue (billion), by Types 2025 & 2033
- Figure 44: Middle East & Africa Consumer Electronics Protective Product Volume (K), by Types 2025 & 2033
- Figure 45: Middle East & Africa Consumer Electronics Protective Product Revenue Share (%), by Types 2025 & 2033
- Figure 46: Middle East & Africa Consumer Electronics Protective Product Volume Share (%), by Types 2025 & 2033
- Figure 47: Middle East & Africa Consumer Electronics Protective Product Revenue (billion), by Country 2025 & 2033
- Figure 48: Middle East & Africa Consumer Electronics Protective Product Volume (K), by Country 2025 & 2033
- Figure 49: Middle East & Africa Consumer Electronics Protective Product Revenue Share (%), by Country 2025 & 2033
- Figure 50: Middle East & Africa Consumer Electronics Protective Product Volume Share (%), by Country 2025 & 2033
- Figure 51: Asia Pacific Consumer Electronics Protective Product Revenue (billion), by Application 2025 & 2033
- Figure 52: Asia Pacific Consumer Electronics Protective Product Volume (K), by Application 2025 & 2033
- Figure 53: Asia Pacific Consumer Electronics Protective Product Revenue Share (%), by Application 2025 & 2033
- Figure 54: Asia Pacific Consumer Electronics Protective Product Volume Share (%), by Application 2025 & 2033
- Figure 55: Asia Pacific Consumer Electronics Protective Product Revenue (billion), by Types 2025 & 2033
- Figure 56: Asia Pacific Consumer Electronics Protective Product Volume (K), by Types 2025 & 2033
- Figure 57: Asia Pacific Consumer Electronics Protective Product Revenue Share (%), by Types 2025 & 2033
- Figure 58: Asia Pacific Consumer Electronics Protective Product Volume Share (%), by Types 2025 & 2033
- Figure 59: Asia Pacific Consumer Electronics Protective Product Revenue (billion), by Country 2025 & 2033
- Figure 60: Asia Pacific Consumer Electronics Protective Product Volume (K), by Country 2025 & 2033
- Figure 61: Asia Pacific Consumer Electronics Protective Product Revenue Share (%), by Country 2025 & 2033
- Figure 62: Asia Pacific Consumer Electronics Protective Product Volume Share (%), by Country 2025 & 2033
List of Tables
- Table 1: Global Consumer Electronics Protective Product Revenue billion Forecast, by Application 2020 & 2033
- Table 2: Global Consumer Electronics Protective Product Volume K Forecast, by Application 2020 & 2033
- Table 3: Global Consumer Electronics Protective Product Revenue billion Forecast, by Types 2020 & 2033
- Table 4: Global Consumer Electronics Protective Product Volume K Forecast, by Types 2020 & 2033
- Table 5: Global Consumer Electronics Protective Product Revenue billion Forecast, by Region 2020 & 2033
- Table 6: Global Consumer Electronics Protective Product Volume K Forecast, by Region 2020 & 2033
- Table 7: Global Consumer Electronics Protective Product Revenue billion Forecast, by Application 2020 & 2033
- Table 8: Global Consumer Electronics Protective Product Volume K Forecast, by Application 2020 & 2033
- Table 9: Global Consumer Electronics Protective Product Revenue billion Forecast, by Types 2020 & 2033
- Table 10: Global Consumer Electronics Protective Product Volume K Forecast, by Types 2020 & 2033
- Table 11: Global Consumer Electronics Protective Product Revenue billion Forecast, by Country 2020 & 2033
- Table 12: Global Consumer Electronics Protective Product Volume K Forecast, by Country 2020 & 2033
- Table 13: United States Consumer Electronics Protective Product Revenue (billion) Forecast, by Application 2020 & 2033
- Table 14: United States Consumer Electronics Protective Product Volume (K) Forecast, by Application 2020 & 2033
- Table 15: Canada Consumer Electronics Protective Product Revenue (billion) Forecast, by Application 2020 & 2033
- Table 16: Canada Consumer Electronics Protective Product Volume (K) Forecast, by Application 2020 & 2033
- Table 17: Mexico Consumer Electronics Protective Product Revenue (billion) Forecast, by Application 2020 & 2033
- Table 18: Mexico Consumer Electronics Protective Product Volume (K) Forecast, by Application 2020 & 2033
- Table 19: Global Consumer Electronics Protective Product Revenue billion Forecast, by Application 2020 & 2033
- Table 20: Global Consumer Electronics Protective Product Volume K Forecast, by Application 2020 & 2033
- Table 21: Global Consumer Electronics Protective Product Revenue billion Forecast, by Types 2020 & 2033
- Table 22: Global Consumer Electronics Protective Product Volume K Forecast, by Types 2020 & 2033
- Table 23: Global Consumer Electronics Protective Product Revenue billion Forecast, by Country 2020 & 2033
- Table 24: Global Consumer Electronics Protective Product Volume K Forecast, by Country 2020 & 2033
- Table 25: Brazil Consumer Electronics Protective Product Revenue (billion) Forecast, by Application 2020 & 2033
- Table 26: Brazil Consumer Electronics Protective Product Volume (K) Forecast, by Application 2020 & 2033
- Table 27: Argentina Consumer Electronics Protective Product Revenue (billion) Forecast, by Application 2020 & 2033
- Table 28: Argentina Consumer Electronics Protective Product Volume (K) Forecast, by Application 2020 & 2033
- Table 29: Rest of South America Consumer Electronics Protective Product Revenue (billion) Forecast, by Application 2020 & 2033
- Table 30: Rest of South America Consumer Electronics Protective Product Volume (K) Forecast, by Application 2020 & 2033
- Table 31: Global Consumer Electronics Protective Product Revenue billion Forecast, by Application 2020 & 2033
- Table 32: Global Consumer Electronics Protective Product Volume K Forecast, by Application 2020 & 2033
- Table 33: Global Consumer Electronics Protective Product Revenue billion Forecast, by Types 2020 & 2033
- Table 34: Global Consumer Electronics Protective Product Volume K Forecast, by Types 2020 & 2033
- Table 35: Global Consumer Electronics Protective Product Revenue billion Forecast, by Country 2020 & 2033
- Table 36: Global Consumer Electronics Protective Product Volume K Forecast, by Country 2020 & 2033
- Table 37: United Kingdom Consumer Electronics Protective Product Revenue (billion) Forecast, by Application 2020 & 2033
- Table 38: United Kingdom Consumer Electronics Protective Product Volume (K) Forecast, by Application 2020 & 2033
- Table 39: Germany Consumer Electronics Protective Product Revenue (billion) Forecast, by Application 2020 & 2033
- Table 40: Germany Consumer Electronics Protective Product Volume (K) Forecast, by Application 2020 & 2033
- Table 41: France Consumer Electronics Protective Product Revenue (billion) Forecast, by Application 2020 & 2033
- Table 42: France Consumer Electronics Protective Product Volume (K) Forecast, by Application 2020 & 2033
- Table 43: Italy Consumer Electronics Protective Product Revenue (billion) Forecast, by Application 2020 & 2033
- Table 44: Italy Consumer Electronics Protective Product Volume (K) Forecast, by Application 2020 & 2033
- Table 45: Spain Consumer Electronics Protective Product Revenue (billion) Forecast, by Application 2020 & 2033
- Table 46: Spain Consumer Electronics Protective Product Volume (K) Forecast, by Application 2020 & 2033
- Table 47: Russia Consumer Electronics Protective Product Revenue (billion) Forecast, by Application 2020 & 2033
- Table 48: Russia Consumer Electronics Protective Product Volume (K) Forecast, by Application 2020 & 2033
- Table 49: Benelux Consumer Electronics Protective Product Revenue (billion) Forecast, by Application 2020 & 2033
- Table 50: Benelux Consumer Electronics Protective Product Volume (K) Forecast, by Application 2020 & 2033
- Table 51: Nordics Consumer Electronics Protective Product Revenue (billion) Forecast, by Application 2020 & 2033
- Table 52: Nordics Consumer Electronics Protective Product Volume (K) Forecast, by Application 2020 & 2033
- Table 53: Rest of Europe Consumer Electronics Protective Product Revenue (billion) Forecast, by Application 2020 & 2033
- Table 54: Rest of Europe Consumer Electronics Protective Product Volume (K) Forecast, by Application 2020 & 2033
- Table 55: Global Consumer Electronics Protective Product Revenue billion Forecast, by Application 2020 & 2033
- Table 56: Global Consumer Electronics Protective Product Volume K Forecast, by Application 2020 & 2033
- Table 57: Global Consumer Electronics Protective Product Revenue billion Forecast, by Types 2020 & 2033
- Table 58: Global Consumer Electronics Protective Product Volume K Forecast, by Types 2020 & 2033
- Table 59: Global Consumer Electronics Protective Product Revenue billion Forecast, by Country 2020 & 2033
- Table 60: Global Consumer Electronics Protective Product Volume K Forecast, by Country 2020 & 2033
- Table 61: Turkey Consumer Electronics Protective Product Revenue (billion) Forecast, by Application 2020 & 2033
- Table 62: Turkey Consumer Electronics Protective Product Volume (K) Forecast, by Application 2020 & 2033
- Table 63: Israel Consumer Electronics Protective Product Revenue (billion) Forecast, by Application 2020 & 2033
- Table 64: Israel Consumer Electronics Protective Product Volume (K) Forecast, by Application 2020 & 2033
- Table 65: GCC Consumer Electronics Protective Product Revenue (billion) Forecast, by Application 2020 & 2033
- Table 66: GCC Consumer Electronics Protective Product Volume (K) Forecast, by Application 2020 & 2033
- Table 67: North Africa Consumer Electronics Protective Product Revenue (billion) Forecast, by Application 2020 & 2033
- Table 68: North Africa Consumer Electronics Protective Product Volume (K) Forecast, by Application 2020 & 2033
- Table 69: South Africa Consumer Electronics Protective Product Revenue (billion) Forecast, by Application 2020 & 2033
- Table 70: South Africa Consumer Electronics Protective Product Volume (K) Forecast, by Application 2020 & 2033
- Table 71: Rest of Middle East & Africa Consumer Electronics Protective Product Revenue (billion) Forecast, by Application 2020 & 2033
- Table 72: Rest of Middle East & Africa Consumer Electronics Protective Product Volume (K) Forecast, by Application 2020 & 2033
- Table 73: Global Consumer Electronics Protective Product Revenue billion Forecast, by Application 2020 & 2033
- Table 74: Global Consumer Electronics Protective Product Volume K Forecast, by Application 2020 & 2033
- Table 75: Global Consumer Electronics Protective Product Revenue billion Forecast, by Types 2020 & 2033
- Table 76: Global Consumer Electronics Protective Product Volume K Forecast, by Types 2020 & 2033
- Table 77: Global Consumer Electronics Protective Product Revenue billion Forecast, by Country 2020 & 2033
- Table 78: Global Consumer Electronics Protective Product Volume K Forecast, by Country 2020 & 2033
- Table 79: China Consumer Electronics Protective Product Revenue (billion) Forecast, by Application 2020 & 2033
- Table 80: China Consumer Electronics Protective Product Volume (K) Forecast, by Application 2020 & 2033
- Table 81: India Consumer Electronics Protective Product Revenue (billion) Forecast, by Application 2020 & 2033
- Table 82: India Consumer Electronics Protective Product Volume (K) Forecast, by Application 2020 & 2033
- Table 83: Japan Consumer Electronics Protective Product Revenue (billion) Forecast, by Application 2020 & 2033
- Table 84: Japan Consumer Electronics Protective Product Volume (K) Forecast, by Application 2020 & 2033
- Table 85: South Korea Consumer Electronics Protective Product Revenue (billion) Forecast, by Application 2020 & 2033
- Table 86: South Korea Consumer Electronics Protective Product Volume (K) Forecast, by Application 2020 & 2033
- Table 87: ASEAN Consumer Electronics Protective Product Revenue (billion) Forecast, by Application 2020 & 2033
- Table 88: ASEAN Consumer Electronics Protective Product Volume (K) Forecast, by Application 2020 & 2033
- Table 89: Oceania Consumer Electronics Protective Product Revenue (billion) Forecast, by Application 2020 & 2033
- Table 90: Oceania Consumer Electronics Protective Product Volume (K) Forecast, by Application 2020 & 2033
- Table 91: Rest of Asia Pacific Consumer Electronics Protective Product Revenue (billion) Forecast, by Application 2020 & 2033
- Table 92: Rest of Asia Pacific Consumer Electronics Protective Product Volume (K) Forecast, by Application 2020 & 2033
Frequently Asked Questions
1. What is the projected Compound Annual Growth Rate (CAGR) of the Consumer Electronics Protective Product?
The projected CAGR is approximately 12.14%.
2. Which companies are prominent players in the Consumer Electronics Protective Product?
Key companies in the market include OtterBox, Spigen, Tech21, Belkin, Case-Mate, Incipio, ZAGG, BodyGuardz.
3. What are the main segments of the Consumer Electronics Protective Product?
The market segments include Application, Types.
4. Can you provide details about the market size?
The market size is estimated to be USD 10.47 billion as of 2022.
5. What are some drivers contributing to market growth?
N/A
6. What are the notable trends driving market growth?
N/A
7. Are there any restraints impacting market growth?
N/A
8. Can you provide examples of recent developments in the market?
N/A
9. What pricing options are available for accessing the report?
Pricing options include single-user, multi-user, and enterprise licenses priced at USD 3950.00, USD 5925.00, and USD 7900.00 respectively.
10. Is the market size provided in terms of value or volume?
The market size is provided in terms of value, measured in billion and volume, measured in K.
11. Are there any specific market keywords associated with the report?
Yes, the market keyword associated with the report is "Consumer Electronics Protective Product," which aids in identifying and referencing the specific market segment covered.
12. How do I determine which pricing option suits my needs best?
The pricing options vary based on user requirements and access needs. Individual users may opt for single-user licenses, while businesses requiring broader access may choose multi-user or enterprise licenses for cost-effective access to the report.
13. Are there any additional resources or data provided in the Consumer Electronics Protective Product report?
While the report offers comprehensive insights, it's advisable to review the specific contents or supplementary materials provided to ascertain if additional resources or data are available.
14. How can I stay updated on further developments or reports in the Consumer Electronics Protective Product?
To stay informed about further developments, trends, and reports in the Consumer Electronics Protective Product, consider subscribing to industry newsletters, following relevant companies and organizations, or regularly checking reputable industry news sources and publications.
Methodology
Step 1 - Identification of Relevant Samples Size from Population Database


Step 2 - Approaches for Defining Global Market Size (Value, Volume* & Price*)

Note*: In applicable scenarios
Step 3 - Data Sources
Primary Research
- Web Analytics
- Survey Reports
- Research Institute
- Latest Research Reports
- Opinion Leaders
Secondary Research
- Annual Reports
- White Paper
- Latest Press Release
- Industry Association
- Paid Database
- Investor Presentations

Step 4 - Data Triangulation
Involves using different sources of information in order to increase the validity of a study
These sources are likely to be stakeholders in a program - participants, other researchers, program staff, other community members, and so on.
Then we put all data in single framework & apply various statistical tools to find out the dynamic on the market.
During the analysis stage, feedback from the stakeholder groups would be compared to determine areas of agreement as well as areas of divergence