

Key Insights
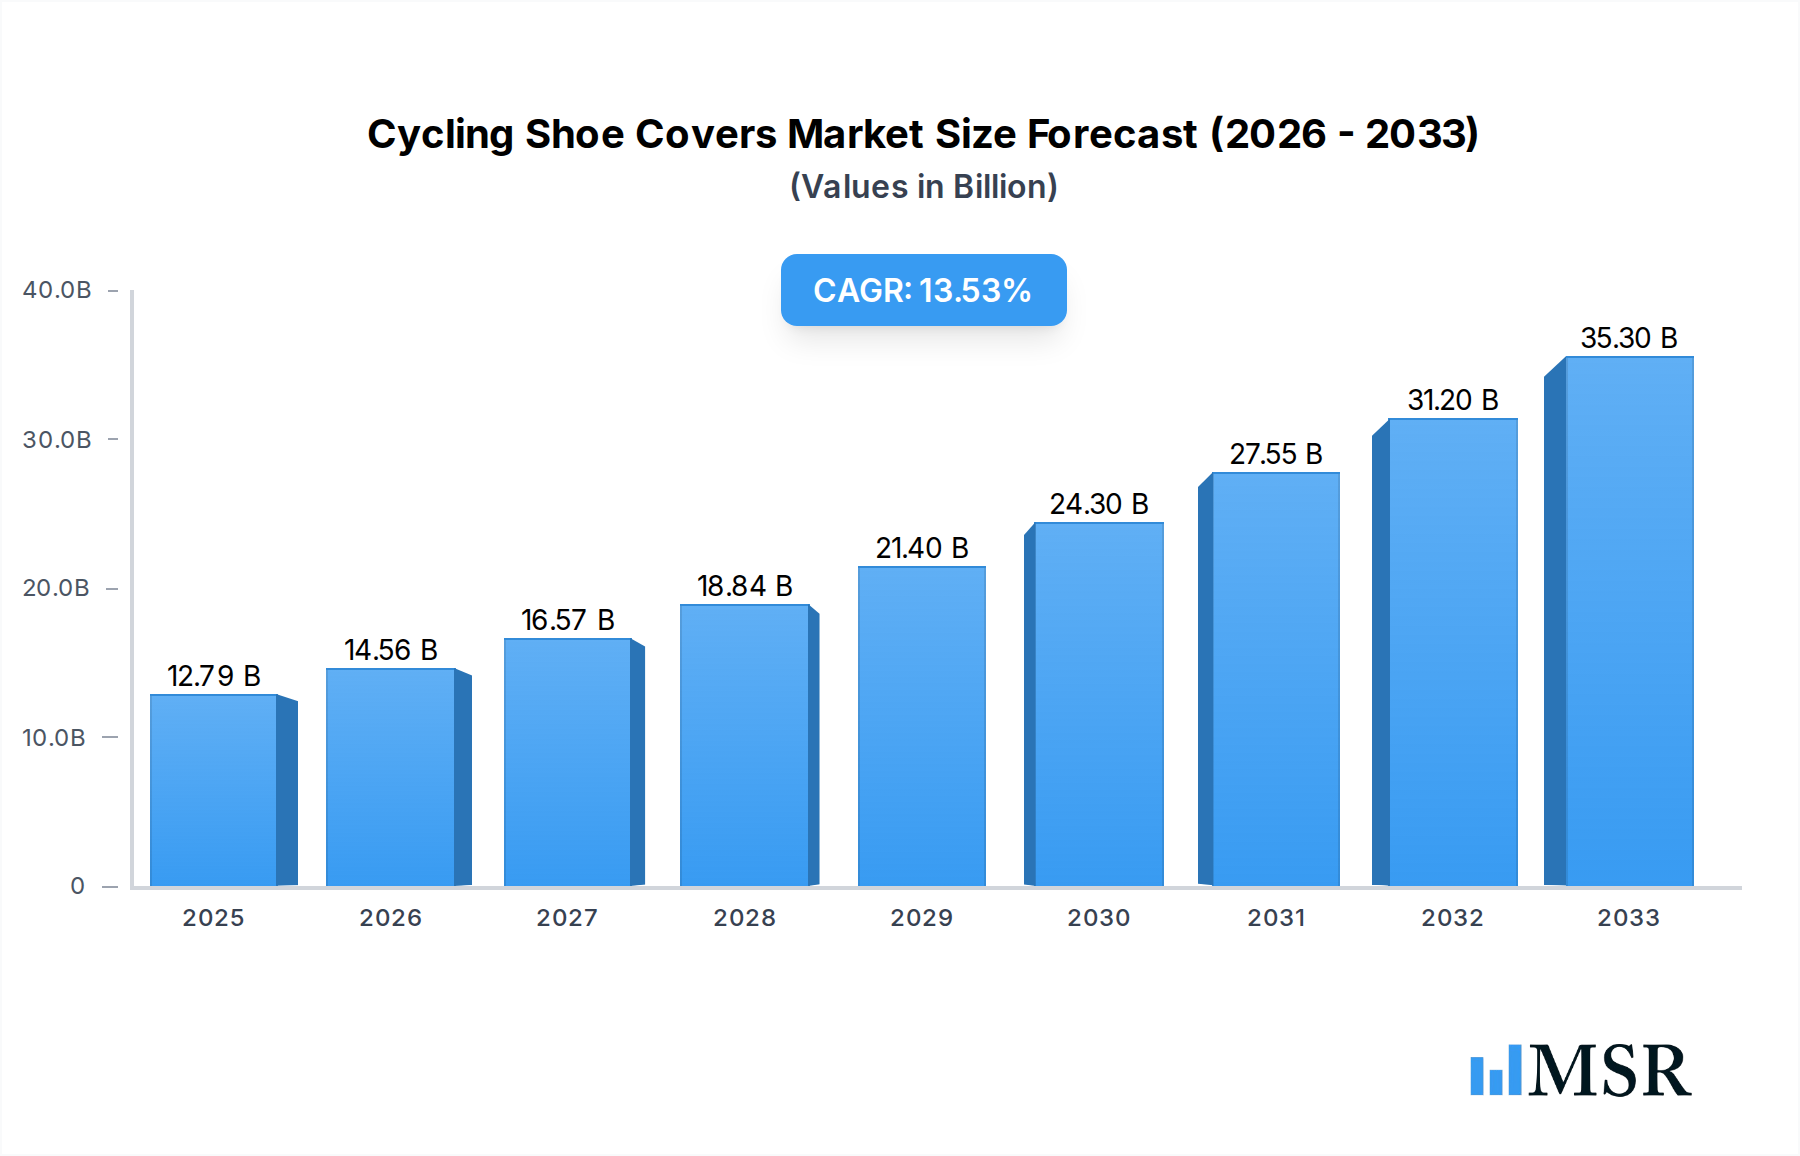
The global cycling shoe cover market is poised for significant expansion, projected to reach an estimated market size of $604 million by 2025, with a robust Compound Annual Growth Rate (CAGR) of 6.2% expected to propel it through 2033. This impressive growth is underpinned by a confluence of favorable factors. The increasing participation in cycling, driven by growing health consciousness, a surge in recreational cycling, and its adoption as a sustainable mode of transportation, is a primary catalyst. Furthermore, advancements in material science and design are leading to the development of more durable, weather-resistant, and performance-enhancing shoe covers, appealing to a broader spectrum of cyclists, from competitive athletes to everyday commuters. The growing e-commerce penetration also plays a crucial role, providing consumers with wider access to a diverse range of cycling shoe cover products.

Cycling Shoe Covers Market Size (In Million)
While the market exhibits strong upward momentum, certain challenges temper this growth. The relatively high cost of premium, technologically advanced shoe covers can act as a restraint, particularly for budget-conscious consumers or those new to cycling. Moreover, the seasonal nature of cycling in certain regions, leading to fluctuating demand, and the availability of affordable alternatives or integrated shoe designs can pose hurdles. However, the market is actively addressing these through innovative product development and strategic pricing. The market segmentation reveals a balanced demand across both men and women's applications, with full overshoes and partial overshoes catering to diverse weather conditions and cycling disciplines. Leading companies such as Castelli, Endura, Gore, and Shimano are continuously innovating, focusing on lightweight, aerodynamic, and waterproof designs to capture market share across key regions like Europe and North America, which are expected to dominate consumption.
Cycling Shoe Covers Company Market Share
This comprehensive report offers an in-depth analysis of the global Cycling Shoe Covers market, providing critical insights for industry stakeholders. Covering the historical period of 2019-2024, with a base year of 2025 and a forecast period extending to 2033, this research delves into market dynamics, key trends, segment-specific performance, product innovations, challenges, growth drivers, and emerging opportunities. The report aims to equip businesses with actionable intelligence to navigate this evolving landscape and capitalize on future growth prospects.
Cycling Shoe Covers Market Concentration & Dynamics
The global Cycling Shoe Covers market exhibits a moderate concentration, with key players like Castelli, Endura, Gore, Rapha, Shimano, Altura, Assos, Giordana, Giro, Garneau, PEARL iZUMi, and SealSkinz holding significant market shares. These companies drive innovation through dedicated R&D ecosystems, focusing on aerodynamic designs, advanced material science for enhanced weather protection, and improved fit for optimal performance. Regulatory frameworks, while generally permissive, can influence material sourcing and product certifications. The threat of substitute products, such as waterproof socks or gaiters, remains a consideration, though specialized cycling shoe covers offer superior protection and integration. End-user trends point towards a growing demand for durable, lightweight, and highly protective covers catering to diverse cycling disciplines, from professional racing to everyday commuting. Mergers and acquisitions (M&A) activities, though not yet at a million-deal count, are anticipated to shape market consolidation as larger entities seek to expand their portfolios and technological capabilities. The market share of the top five players is estimated to be over 70 million, with approximately xx M&A deals recorded over the historical period.
Cycling Shoe Covers Industry Insights & Trends
The Cycling Shoe Covers market is poised for substantial growth, projected to reach a market size of over $1,200 million by 2033, with a compound annual growth rate (CAGR) of approximately 6.5% during the forecast period. This expansion is fueled by several key drivers, including the increasing popularity of cycling as a recreational activity and a sustainable mode of transportation globally. Technological disruptions are at the forefront of market evolution. Innovations in material science, such as the integration of advanced waterproof and breathable membranes, lightweight yet durable fabrics, and reflective elements for enhanced safety, are transforming product offerings. The development of aerodynamic designs for competitive cycling, alongside the introduction of specialized covers for extreme weather conditions, further stimulates demand. Evolving consumer behaviors play a crucial role. Cyclists, increasingly aware of performance optimization and comfort, are seeking high-quality accessories that can withstand diverse environmental challenges. The rise of e-commerce platforms has also broadened accessibility to a wider range of products and brands, contributing to market penetration. Furthermore, the growing emphasis on health and wellness, coupled with government initiatives promoting cycling infrastructure, is expected to sustain positive market momentum. The demand for custom-fit and performance-oriented cycling shoe covers is a significant trend, driven by both amateur and professional cyclists.
Key Markets & Segments Leading Cycling Shoe Covers
The Men's segment is currently the dominant force in the Cycling Shoe Covers market, driven by higher participation rates in professional and recreational cycling. However, the Women's segment is exhibiting robust growth, reflecting the increasing number of female cyclists and their specific demands for comfort, fit, and style. In terms of product types, Full Overshoes are leading the market due to their comprehensive protection against elements, offering superior insulation and water resistance. Partial Overshoes, while catering to specific needs like wind protection or ease of use, represent a growing niche. Geographically, Europe stands out as the largest market, attributed to well-established cycling cultures, extensive cycling infrastructure, and a high disposable income among consumers. Countries like the Netherlands, Germany, and the UK are particularly strong contributors. The North American market is also witnessing significant expansion, propelled by increasing health consciousness and the growing popularity of cycling for fitness and commuting. Key drivers for European market dominance include:
- Established Cycling Culture: Deep-rooted traditions and widespread adoption of cycling for recreation and transport.
- Extensive Infrastructure: Abundant dedicated cycle paths and supportive urban planning.
- High Disposable Income: Consumers' ability to invest in premium cycling accessories.
- Advocacy Groups: Strong presence of cycling advocacy organizations promoting the sport.
- Climate Diversity: Demand for protective gear across varied weather conditions.
The dominance of Full Overshoes is attributed to their effectiveness in providing all-around protection from rain, mud, wind, and cold. This makes them indispensable for serious cyclists undertaking long rides or competing in adverse weather. The growing demand in the Women's segment is a testament to the increasing inclusivity of cycling as a sport and a lifestyle choice.
Cycling Shoe Covers Product Developments
Recent product developments in the Cycling Shoe Covers market have focused on enhancing performance, comfort, and durability. Innovations include the integration of advanced breathable yet waterproof membranes, such as Gore-Tex, providing superior protection without compromising on ventilation. Lightweight and abrasion-resistant materials are being utilized to extend product lifespan and reduce aerodynamic drag. Reflective detailing is increasingly incorporated for improved visibility in low-light conditions, a crucial safety feature. Furthermore, brands are investing in ergonomic designs that ensure a snug and secure fit over various cycling shoe models, minimizing chafing and maximizing power transfer. These advancements are driven by a competitive landscape where brands like Castelli, Rapha, and Assos are consistently pushing the boundaries of material science and design engineering to offer cyclists a distinct competitive edge and superior riding experience.
Challenges in the Cycling Shoe Covers Market
The Cycling Shoe Covers market faces several challenges that could impede its growth trajectory. High Manufacturing Costs associated with advanced materials and intricate designs can lead to premium pricing, potentially limiting adoption among budget-conscious consumers. Intense Competition from established brands and new entrants necessitates continuous innovation and marketing efforts, impacting profit margins. Supply Chain Disruptions, as witnessed in recent global events, can affect the availability of raw materials and finished goods, leading to production delays and increased costs. Furthermore, Consumer Education regarding the benefits and proper usage of specialized cycling shoe covers remains an ongoing effort, as some cyclists may opt for less specialized alternatives. The Threat of Counterfeit Products also poses a challenge, potentially damaging brand reputation and impacting sales.
Forces Driving Cycling Shoe Covers Growth
Several powerful forces are driving the growth of the Cycling Shoe Covers market. The escalating global interest in Outdoor Recreation and Fitness is a primary catalyst, with cycling emerging as a popular and accessible activity. Technological Advancements in material science, leading to lighter, more durable, and highly protective shoe covers, are continuously enhancing product appeal. The increasing adoption of Sustainable Transportation solutions, spurred by environmental concerns and government incentives, is boosting the overall cycling market, consequently driving demand for related accessories. Favorable Government Policies and Infrastructure Development that promote cycling further contribute to market expansion.
Challenges in the Cycling Shoe Covers Market
Looking beyond immediate obstacles, the long-term growth catalysts for the Cycling Shoe Covers market lie in continued Innovation and Product Differentiation. Brands that invest in cutting-edge materials, ergonomic designs, and smart features will likely capture market share. Strategic Partnerships with cycling teams, events, and retailers can enhance brand visibility and credibility. Furthermore, Market Expansion into Emerging Economies presents a significant opportunity, as cycling gains traction in regions with developing infrastructure and a growing middle class. The development of Eco-Friendly and Sustainable product lines can also resonate with an increasingly environmentally conscious consumer base.
Emerging Opportunities in Cycling Shoe Covers
The Cycling Shoe Covers market is ripe with emerging opportunities. The development of Smart Shoe Covers incorporating sensors for performance tracking or electronic heating elements for extreme cold weather cycling presents a novel frontier. Expansion into Niche Cycling Disciplines, such as gravel biking or cyclocross, where specialized protection is paramount, offers untapped potential. The growing demand for Personalized and Customizable cycling gear also presents an opportunity for brands to offer bespoke solutions. Furthermore, the increasing focus on Athleisure and Performance Apparel extends to cycling accessories, creating opportunities for stylish and functional designs that appeal to a broader audience.
Leading Players in the Cycling Shoe Covers Sector
- Castelli
- Endura
- Gore
- Rapha
- Shimano
- Altura
- Assos
- Giordana
- Giro
- Garneau
- PEARL iZUMi
- SealSkinz
Key Milestones in Cycling Shoe Covers Industry
- 2019: Introduction of advanced waterproof-breathable membranes by Gore for enhanced cycling shoe cover performance.
- 2020: Rapha launches a collection of aerodynamic cycling shoe covers, targeting professional racers.
- 2021: Shimano introduces innovative closure systems for improved fit and security in its cycling shoe covers.
- 2022: Assos invests in new material research, focusing on lightweight and durable fabrics for extreme weather conditions.
- 2023: Endura expands its range of reflective cycling shoe covers, emphasizing cyclist safety.
- 2024: Several brands begin exploring sustainable material sourcing for their cycling shoe cover production.
- 2025: Expected increase in M&A activities as market consolidation trends emerge.
Strategic Outlook for Cycling Shoe Covers Market
The strategic outlook for the Cycling Shoe Covers market is highly optimistic, driven by a confluence of factors including sustained growth in cycling participation, continuous technological innovation, and a growing consumer appetite for high-performance accessories. Key growth accelerators will involve a deeper focus on Material Innovation, particularly in areas of sustainability and advanced weather protection. Brands will need to strategically Expand their Product Offerings to cater to diverse cycling disciplines and weather conditions. Digitalization and E-commerce Strategies will be crucial for reaching a wider customer base and enhancing brand engagement. Furthermore, Collaborations and Partnerships within the cycling ecosystem will be instrumental in driving brand awareness and market penetration. The market is expected to witness a steady upward trajectory, offering significant opportunities for companies that can adapt to evolving consumer needs and technological advancements.
Cycling Shoe Covers Segmentation
-
1. Application
- 1.1. Men
- 1.2. Women
-
2. Types
- 2.1. Full Overshoes
- 2.2. Partial Overshoes
Cycling Shoe Covers Segmentation By Geography
-
1. North America
- 1.1. United States
- 1.2. Canada
- 1.3. Mexico
-
2. South America
- 2.1. Brazil
- 2.2. Argentina
- 2.3. Rest of South America
-
3. Europe
- 3.1. United Kingdom
- 3.2. Germany
- 3.3. France
- 3.4. Italy
- 3.5. Spain
- 3.6. Russia
- 3.7. Benelux
- 3.8. Nordics
- 3.9. Rest of Europe
-
4. Middle East & Africa
- 4.1. Turkey
- 4.2. Israel
- 4.3. GCC
- 4.4. North Africa
- 4.5. South Africa
- 4.6. Rest of Middle East & Africa
-
5. Asia Pacific
- 5.1. China
- 5.2. India
- 5.3. Japan
- 5.4. South Korea
- 5.5. ASEAN
- 5.6. Oceania
- 5.7. Rest of Asia Pacific
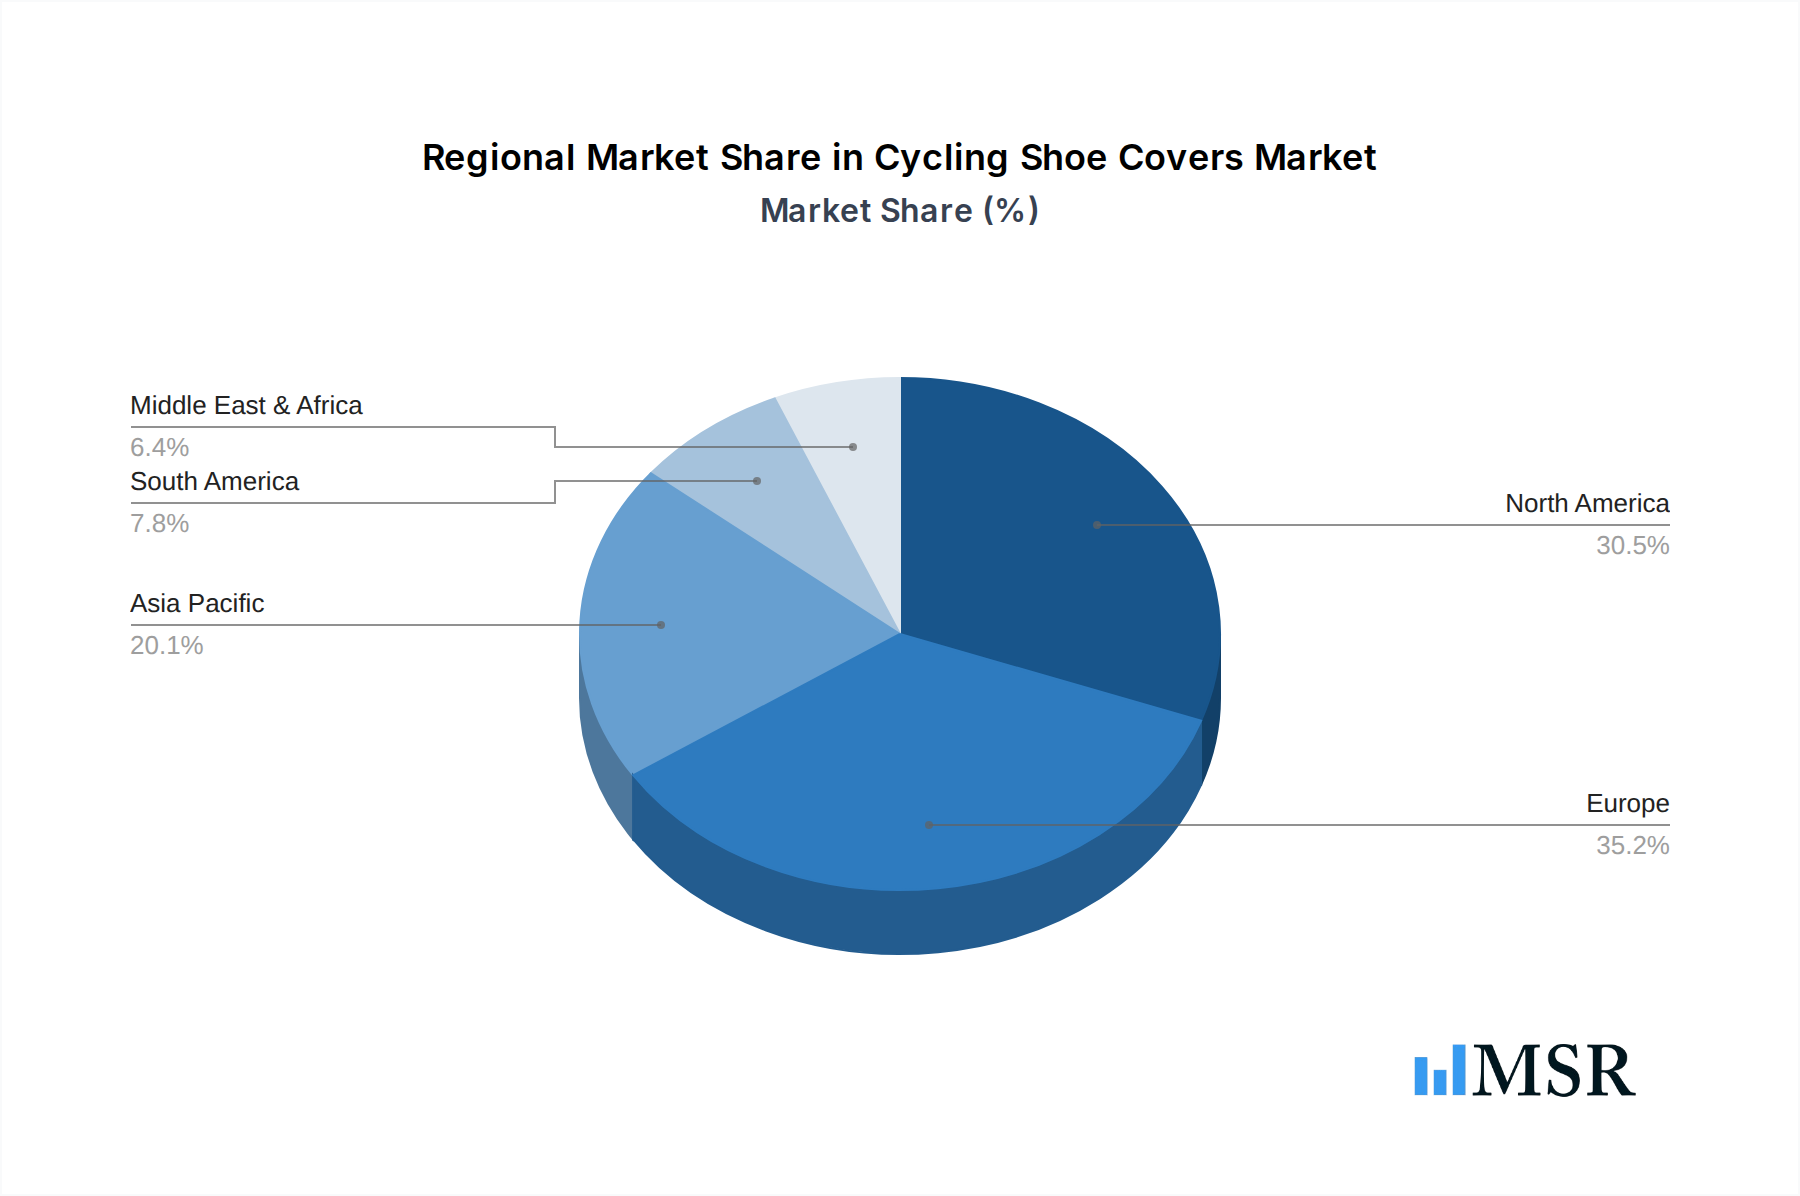
Cycling Shoe Covers Regional Market Share
Geographic Coverage of Cycling Shoe Covers
Cycling Shoe Covers REPORT HIGHLIGHTS
| Aspects | Details |
|---|---|
| Study Period | 2020-2034 |
| Base Year | 2025 |
| Estimated Year | 2026 |
| Forecast Period | 2026-2034 |
| Historical Period | 2020-2025 |
| Growth Rate | CAGR of 5% from 2020-2034 |
| Segmentation |
|
Table of Contents
- 1. Introduction
- 1.1. Research Scope
- 1.2. Market Segmentation
- 1.3. Research Objective
- 1.4. Definitions and Assumptions
- 2. Executive Summary
- 2.1. Market Snapshot
- 3. Market Dynamics
- 3.1. Market Drivers
- 3.2. Market Restrains
- 3.3. Market Trends
- 3.4. Market Opportunities
- 4. Market Factor Analysis
- 4.1. Porters Five Forces
- 4.1.1. Bargaining Power of Suppliers
- 4.1.2. Bargaining Power of Buyers
- 4.1.3. Threat of New Entrants
- 4.1.4. Threat of Substitutes
- 4.1.5. Competitive Rivalry
- 4.2. PESTEL analysis
- 4.3. BCG Analysis
- 4.3.1. Stars (High Growth, High Market Share)
- 4.3.2. Cash Cows (Low Growth, High Market Share)
- 4.3.3. Question Mark (High Growth, Low Market Share)
- 4.3.4. Dogs (Low Growth, Low Market Share)
- 4.4. Ansoff Matrix Analysis
- 4.5. Supply Chain Analysis
- 4.6. Regulatory Landscape
- 4.7. Current Market Potential and Opportunity Assessment (TAM–SAM–SOM Framework)
- 4.8. MSR Analyst Note
- 4.1. Porters Five Forces
- 5. Market Analysis, Insights and Forecast 2021-2033
- 5.1. Market Analysis, Insights and Forecast - by Application
- 5.1.1. Men
- 5.1.2. Women
- 5.2. Market Analysis, Insights and Forecast - by Types
- 5.2.1. Full Overshoes
- 5.2.2. Partial Overshoes
- 5.3. Market Analysis, Insights and Forecast - by Region
- 5.3.1. North America
- 5.3.2. South America
- 5.3.3. Europe
- 5.3.4. Middle East & Africa
- 5.3.5. Asia Pacific
- 5.1. Market Analysis, Insights and Forecast - by Application
- 6. Global Cycling Shoe Covers Analysis, Insights and Forecast, 2021-2033
- 6.1. Market Analysis, Insights and Forecast - by Application
- 6.1.1. Men
- 6.1.2. Women
- 6.2. Market Analysis, Insights and Forecast - by Types
- 6.2.1. Full Overshoes
- 6.2.2. Partial Overshoes
- 6.1. Market Analysis, Insights and Forecast - by Application
- 7. North America Cycling Shoe Covers Analysis, Insights and Forecast, 2020-2032
- 7.1. Market Analysis, Insights and Forecast - by Application
- 7.1.1. Men
- 7.1.2. Women
- 7.2. Market Analysis, Insights and Forecast - by Types
- 7.2.1. Full Overshoes
- 7.2.2. Partial Overshoes
- 7.1. Market Analysis, Insights and Forecast - by Application
- 8. South America Cycling Shoe Covers Analysis, Insights and Forecast, 2020-2032
- 8.1. Market Analysis, Insights and Forecast - by Application
- 8.1.1. Men
- 8.1.2. Women
- 8.2. Market Analysis, Insights and Forecast - by Types
- 8.2.1. Full Overshoes
- 8.2.2. Partial Overshoes
- 8.1. Market Analysis, Insights and Forecast - by Application
- 9. Europe Cycling Shoe Covers Analysis, Insights and Forecast, 2020-2032
- 9.1. Market Analysis, Insights and Forecast - by Application
- 9.1.1. Men
- 9.1.2. Women
- 9.2. Market Analysis, Insights and Forecast - by Types
- 9.2.1. Full Overshoes
- 9.2.2. Partial Overshoes
- 9.1. Market Analysis, Insights and Forecast - by Application
- 10. Middle East & Africa Cycling Shoe Covers Analysis, Insights and Forecast, 2020-2032
- 10.1. Market Analysis, Insights and Forecast - by Application
- 10.1.1. Men
- 10.1.2. Women
- 10.2. Market Analysis, Insights and Forecast - by Types
- 10.2.1. Full Overshoes
- 10.2.2. Partial Overshoes
- 10.1. Market Analysis, Insights and Forecast - by Application
- 11. Asia Pacific Cycling Shoe Covers Analysis, Insights and Forecast, 2020-2032
- 11.1. Market Analysis, Insights and Forecast - by Application
- 11.1.1. Men
- 11.1.2. Women
- 11.2. Market Analysis, Insights and Forecast - by Types
- 11.2.1. Full Overshoes
- 11.2.2. Partial Overshoes
- 11.1. Market Analysis, Insights and Forecast - by Application
- 12. Competitive Analysis
- 12.1. Company Profiles
- 12.1.1 Castelli
- 12.1.1.1. Company Overview
- 12.1.1.2. Products
- 12.1.1.3. Company Financials
- 12.1.1.4. SWOT Analysis
- 12.1.2 Endura
- 12.1.2.1. Company Overview
- 12.1.2.2. Products
- 12.1.2.3. Company Financials
- 12.1.2.4. SWOT Analysis
- 12.1.3 Gore
- 12.1.3.1. Company Overview
- 12.1.3.2. Products
- 12.1.3.3. Company Financials
- 12.1.3.4. SWOT Analysis
- 12.1.4 Rapha
- 12.1.4.1. Company Overview
- 12.1.4.2. Products
- 12.1.4.3. Company Financials
- 12.1.4.4. SWOT Analysis
- 12.1.5 Shimano
- 12.1.5.1. Company Overview
- 12.1.5.2. Products
- 12.1.5.3. Company Financials
- 12.1.5.4. SWOT Analysis
- 12.1.6 Altura
- 12.1.6.1. Company Overview
- 12.1.6.2. Products
- 12.1.6.3. Company Financials
- 12.1.6.4. SWOT Analysis
- 12.1.7 Assos
- 12.1.7.1. Company Overview
- 12.1.7.2. Products
- 12.1.7.3. Company Financials
- 12.1.7.4. SWOT Analysis
- 12.1.8 Giordana
- 12.1.8.1. Company Overview
- 12.1.8.2. Products
- 12.1.8.3. Company Financials
- 12.1.8.4. SWOT Analysis
- 12.1.9 Giro
- 12.1.9.1. Company Overview
- 12.1.9.2. Products
- 12.1.9.3. Company Financials
- 12.1.9.4. SWOT Analysis
- 12.1.10 Garneau
- 12.1.10.1. Company Overview
- 12.1.10.2. Products
- 12.1.10.3. Company Financials
- 12.1.10.4. SWOT Analysis
- 12.1.11 PEARL iZUMi
- 12.1.11.1. Company Overview
- 12.1.11.2. Products
- 12.1.11.3. Company Financials
- 12.1.11.4. SWOT Analysis
- 12.1.12 SealSkinz
- 12.1.12.1. Company Overview
- 12.1.12.2. Products
- 12.1.12.3. Company Financials
- 12.1.12.4. SWOT Analysis
- 12.1.1 Castelli
- 12.2. Market Entropy
- 12.2.1 Company's Key Areas Served
- 12.2.2 Recent Developments
- 12.3. Company Market Share Analysis 2025
- 12.3.1 Top 5 Companies Market Share Analysis
- 12.3.2 Top 3 Companies Market Share Analysis
- 12.4. List of Potential Customers
- 13. Research Methodology
List of Figures
- Figure 1: Global Cycling Shoe Covers Revenue Breakdown (undefined, %) by Region 2025 & 2033
- Figure 2: Global Cycling Shoe Covers Volume Breakdown (K, %) by Region 2025 & 2033
- Figure 3: North America Cycling Shoe Covers Revenue (undefined), by Application 2025 & 2033
- Figure 4: North America Cycling Shoe Covers Volume (K), by Application 2025 & 2033
- Figure 5: North America Cycling Shoe Covers Revenue Share (%), by Application 2025 & 2033
- Figure 6: North America Cycling Shoe Covers Volume Share (%), by Application 2025 & 2033
- Figure 7: North America Cycling Shoe Covers Revenue (undefined), by Types 2025 & 2033
- Figure 8: North America Cycling Shoe Covers Volume (K), by Types 2025 & 2033
- Figure 9: North America Cycling Shoe Covers Revenue Share (%), by Types 2025 & 2033
- Figure 10: North America Cycling Shoe Covers Volume Share (%), by Types 2025 & 2033
- Figure 11: North America Cycling Shoe Covers Revenue (undefined), by Country 2025 & 2033
- Figure 12: North America Cycling Shoe Covers Volume (K), by Country 2025 & 2033
- Figure 13: North America Cycling Shoe Covers Revenue Share (%), by Country 2025 & 2033
- Figure 14: North America Cycling Shoe Covers Volume Share (%), by Country 2025 & 2033
- Figure 15: South America Cycling Shoe Covers Revenue (undefined), by Application 2025 & 2033
- Figure 16: South America Cycling Shoe Covers Volume (K), by Application 2025 & 2033
- Figure 17: South America Cycling Shoe Covers Revenue Share (%), by Application 2025 & 2033
- Figure 18: South America Cycling Shoe Covers Volume Share (%), by Application 2025 & 2033
- Figure 19: South America Cycling Shoe Covers Revenue (undefined), by Types 2025 & 2033
- Figure 20: South America Cycling Shoe Covers Volume (K), by Types 2025 & 2033
- Figure 21: South America Cycling Shoe Covers Revenue Share (%), by Types 2025 & 2033
- Figure 22: South America Cycling Shoe Covers Volume Share (%), by Types 2025 & 2033
- Figure 23: South America Cycling Shoe Covers Revenue (undefined), by Country 2025 & 2033
- Figure 24: South America Cycling Shoe Covers Volume (K), by Country 2025 & 2033
- Figure 25: South America Cycling Shoe Covers Revenue Share (%), by Country 2025 & 2033
- Figure 26: South America Cycling Shoe Covers Volume Share (%), by Country 2025 & 2033
- Figure 27: Europe Cycling Shoe Covers Revenue (undefined), by Application 2025 & 2033
- Figure 28: Europe Cycling Shoe Covers Volume (K), by Application 2025 & 2033
- Figure 29: Europe Cycling Shoe Covers Revenue Share (%), by Application 2025 & 2033
- Figure 30: Europe Cycling Shoe Covers Volume Share (%), by Application 2025 & 2033
- Figure 31: Europe Cycling Shoe Covers Revenue (undefined), by Types 2025 & 2033
- Figure 32: Europe Cycling Shoe Covers Volume (K), by Types 2025 & 2033
- Figure 33: Europe Cycling Shoe Covers Revenue Share (%), by Types 2025 & 2033
- Figure 34: Europe Cycling Shoe Covers Volume Share (%), by Types 2025 & 2033
- Figure 35: Europe Cycling Shoe Covers Revenue (undefined), by Country 2025 & 2033
- Figure 36: Europe Cycling Shoe Covers Volume (K), by Country 2025 & 2033
- Figure 37: Europe Cycling Shoe Covers Revenue Share (%), by Country 2025 & 2033
- Figure 38: Europe Cycling Shoe Covers Volume Share (%), by Country 2025 & 2033
- Figure 39: Middle East & Africa Cycling Shoe Covers Revenue (undefined), by Application 2025 & 2033
- Figure 40: Middle East & Africa Cycling Shoe Covers Volume (K), by Application 2025 & 2033
- Figure 41: Middle East & Africa Cycling Shoe Covers Revenue Share (%), by Application 2025 & 2033
- Figure 42: Middle East & Africa Cycling Shoe Covers Volume Share (%), by Application 2025 & 2033
- Figure 43: Middle East & Africa Cycling Shoe Covers Revenue (undefined), by Types 2025 & 2033
- Figure 44: Middle East & Africa Cycling Shoe Covers Volume (K), by Types 2025 & 2033
- Figure 45: Middle East & Africa Cycling Shoe Covers Revenue Share (%), by Types 2025 & 2033
- Figure 46: Middle East & Africa Cycling Shoe Covers Volume Share (%), by Types 2025 & 2033
- Figure 47: Middle East & Africa Cycling Shoe Covers Revenue (undefined), by Country 2025 & 2033
- Figure 48: Middle East & Africa Cycling Shoe Covers Volume (K), by Country 2025 & 2033
- Figure 49: Middle East & Africa Cycling Shoe Covers Revenue Share (%), by Country 2025 & 2033
- Figure 50: Middle East & Africa Cycling Shoe Covers Volume Share (%), by Country 2025 & 2033
- Figure 51: Asia Pacific Cycling Shoe Covers Revenue (undefined), by Application 2025 & 2033
- Figure 52: Asia Pacific Cycling Shoe Covers Volume (K), by Application 2025 & 2033
- Figure 53: Asia Pacific Cycling Shoe Covers Revenue Share (%), by Application 2025 & 2033
- Figure 54: Asia Pacific Cycling Shoe Covers Volume Share (%), by Application 2025 & 2033
- Figure 55: Asia Pacific Cycling Shoe Covers Revenue (undefined), by Types 2025 & 2033
- Figure 56: Asia Pacific Cycling Shoe Covers Volume (K), by Types 2025 & 2033
- Figure 57: Asia Pacific Cycling Shoe Covers Revenue Share (%), by Types 2025 & 2033
- Figure 58: Asia Pacific Cycling Shoe Covers Volume Share (%), by Types 2025 & 2033
- Figure 59: Asia Pacific Cycling Shoe Covers Revenue (undefined), by Country 2025 & 2033
- Figure 60: Asia Pacific Cycling Shoe Covers Volume (K), by Country 2025 & 2033
- Figure 61: Asia Pacific Cycling Shoe Covers Revenue Share (%), by Country 2025 & 2033
- Figure 62: Asia Pacific Cycling Shoe Covers Volume Share (%), by Country 2025 & 2033
List of Tables
- Table 1: Global Cycling Shoe Covers Revenue undefined Forecast, by Application 2020 & 2033
- Table 2: Global Cycling Shoe Covers Volume K Forecast, by Application 2020 & 2033
- Table 3: Global Cycling Shoe Covers Revenue undefined Forecast, by Types 2020 & 2033
- Table 4: Global Cycling Shoe Covers Volume K Forecast, by Types 2020 & 2033
- Table 5: Global Cycling Shoe Covers Revenue undefined Forecast, by Region 2020 & 2033
- Table 6: Global Cycling Shoe Covers Volume K Forecast, by Region 2020 & 2033
- Table 7: Global Cycling Shoe Covers Revenue undefined Forecast, by Application 2020 & 2033
- Table 8: Global Cycling Shoe Covers Volume K Forecast, by Application 2020 & 2033
- Table 9: Global Cycling Shoe Covers Revenue undefined Forecast, by Types 2020 & 2033
- Table 10: Global Cycling Shoe Covers Volume K Forecast, by Types 2020 & 2033
- Table 11: Global Cycling Shoe Covers Revenue undefined Forecast, by Country 2020 & 2033
- Table 12: Global Cycling Shoe Covers Volume K Forecast, by Country 2020 & 2033
- Table 13: United States Cycling Shoe Covers Revenue (undefined) Forecast, by Application 2020 & 2033
- Table 14: United States Cycling Shoe Covers Volume (K) Forecast, by Application 2020 & 2033
- Table 15: Canada Cycling Shoe Covers Revenue (undefined) Forecast, by Application 2020 & 2033
- Table 16: Canada Cycling Shoe Covers Volume (K) Forecast, by Application 2020 & 2033
- Table 17: Mexico Cycling Shoe Covers Revenue (undefined) Forecast, by Application 2020 & 2033
- Table 18: Mexico Cycling Shoe Covers Volume (K) Forecast, by Application 2020 & 2033
- Table 19: Global Cycling Shoe Covers Revenue undefined Forecast, by Application 2020 & 2033
- Table 20: Global Cycling Shoe Covers Volume K Forecast, by Application 2020 & 2033
- Table 21: Global Cycling Shoe Covers Revenue undefined Forecast, by Types 2020 & 2033
- Table 22: Global Cycling Shoe Covers Volume K Forecast, by Types 2020 & 2033
- Table 23: Global Cycling Shoe Covers Revenue undefined Forecast, by Country 2020 & 2033
- Table 24: Global Cycling Shoe Covers Volume K Forecast, by Country 2020 & 2033
- Table 25: Brazil Cycling Shoe Covers Revenue (undefined) Forecast, by Application 2020 & 2033
- Table 26: Brazil Cycling Shoe Covers Volume (K) Forecast, by Application 2020 & 2033
- Table 27: Argentina Cycling Shoe Covers Revenue (undefined) Forecast, by Application 2020 & 2033
- Table 28: Argentina Cycling Shoe Covers Volume (K) Forecast, by Application 2020 & 2033
- Table 29: Rest of South America Cycling Shoe Covers Revenue (undefined) Forecast, by Application 2020 & 2033
- Table 30: Rest of South America Cycling Shoe Covers Volume (K) Forecast, by Application 2020 & 2033
- Table 31: Global Cycling Shoe Covers Revenue undefined Forecast, by Application 2020 & 2033
- Table 32: Global Cycling Shoe Covers Volume K Forecast, by Application 2020 & 2033
- Table 33: Global Cycling Shoe Covers Revenue undefined Forecast, by Types 2020 & 2033
- Table 34: Global Cycling Shoe Covers Volume K Forecast, by Types 2020 & 2033
- Table 35: Global Cycling Shoe Covers Revenue undefined Forecast, by Country 2020 & 2033
- Table 36: Global Cycling Shoe Covers Volume K Forecast, by Country 2020 & 2033
- Table 37: United Kingdom Cycling Shoe Covers Revenue (undefined) Forecast, by Application 2020 & 2033
- Table 38: United Kingdom Cycling Shoe Covers Volume (K) Forecast, by Application 2020 & 2033
- Table 39: Germany Cycling Shoe Covers Revenue (undefined) Forecast, by Application 2020 & 2033
- Table 40: Germany Cycling Shoe Covers Volume (K) Forecast, by Application 2020 & 2033
- Table 41: France Cycling Shoe Covers Revenue (undefined) Forecast, by Application 2020 & 2033
- Table 42: France Cycling Shoe Covers Volume (K) Forecast, by Application 2020 & 2033
- Table 43: Italy Cycling Shoe Covers Revenue (undefined) Forecast, by Application 2020 & 2033
- Table 44: Italy Cycling Shoe Covers Volume (K) Forecast, by Application 2020 & 2033
- Table 45: Spain Cycling Shoe Covers Revenue (undefined) Forecast, by Application 2020 & 2033
- Table 46: Spain Cycling Shoe Covers Volume (K) Forecast, by Application 2020 & 2033
- Table 47: Russia Cycling Shoe Covers Revenue (undefined) Forecast, by Application 2020 & 2033
- Table 48: Russia Cycling Shoe Covers Volume (K) Forecast, by Application 2020 & 2033
- Table 49: Benelux Cycling Shoe Covers Revenue (undefined) Forecast, by Application 2020 & 2033
- Table 50: Benelux Cycling Shoe Covers Volume (K) Forecast, by Application 2020 & 2033
- Table 51: Nordics Cycling Shoe Covers Revenue (undefined) Forecast, by Application 2020 & 2033
- Table 52: Nordics Cycling Shoe Covers Volume (K) Forecast, by Application 2020 & 2033
- Table 53: Rest of Europe Cycling Shoe Covers Revenue (undefined) Forecast, by Application 2020 & 2033
- Table 54: Rest of Europe Cycling Shoe Covers Volume (K) Forecast, by Application 2020 & 2033
- Table 55: Global Cycling Shoe Covers Revenue undefined Forecast, by Application 2020 & 2033
- Table 56: Global Cycling Shoe Covers Volume K Forecast, by Application 2020 & 2033
- Table 57: Global Cycling Shoe Covers Revenue undefined Forecast, by Types 2020 & 2033
- Table 58: Global Cycling Shoe Covers Volume K Forecast, by Types 2020 & 2033
- Table 59: Global Cycling Shoe Covers Revenue undefined Forecast, by Country 2020 & 2033
- Table 60: Global Cycling Shoe Covers Volume K Forecast, by Country 2020 & 2033
- Table 61: Turkey Cycling Shoe Covers Revenue (undefined) Forecast, by Application 2020 & 2033
- Table 62: Turkey Cycling Shoe Covers Volume (K) Forecast, by Application 2020 & 2033
- Table 63: Israel Cycling Shoe Covers Revenue (undefined) Forecast, by Application 2020 & 2033
- Table 64: Israel Cycling Shoe Covers Volume (K) Forecast, by Application 2020 & 2033
- Table 65: GCC Cycling Shoe Covers Revenue (undefined) Forecast, by Application 2020 & 2033
- Table 66: GCC Cycling Shoe Covers Volume (K) Forecast, by Application 2020 & 2033
- Table 67: North Africa Cycling Shoe Covers Revenue (undefined) Forecast, by Application 2020 & 2033
- Table 68: North Africa Cycling Shoe Covers Volume (K) Forecast, by Application 2020 & 2033
- Table 69: South Africa Cycling Shoe Covers Revenue (undefined) Forecast, by Application 2020 & 2033
- Table 70: South Africa Cycling Shoe Covers Volume (K) Forecast, by Application 2020 & 2033
- Table 71: Rest of Middle East & Africa Cycling Shoe Covers Revenue (undefined) Forecast, by Application 2020 & 2033
- Table 72: Rest of Middle East & Africa Cycling Shoe Covers Volume (K) Forecast, by Application 2020 & 2033
- Table 73: Global Cycling Shoe Covers Revenue undefined Forecast, by Application 2020 & 2033
- Table 74: Global Cycling Shoe Covers Volume K Forecast, by Application 2020 & 2033
- Table 75: Global Cycling Shoe Covers Revenue undefined Forecast, by Types 2020 & 2033
- Table 76: Global Cycling Shoe Covers Volume K Forecast, by Types 2020 & 2033
- Table 77: Global Cycling Shoe Covers Revenue undefined Forecast, by Country 2020 & 2033
- Table 78: Global Cycling Shoe Covers Volume K Forecast, by Country 2020 & 2033
- Table 79: China Cycling Shoe Covers Revenue (undefined) Forecast, by Application 2020 & 2033
- Table 80: China Cycling Shoe Covers Volume (K) Forecast, by Application 2020 & 2033
- Table 81: India Cycling Shoe Covers Revenue (undefined) Forecast, by Application 2020 & 2033
- Table 82: India Cycling Shoe Covers Volume (K) Forecast, by Application 2020 & 2033
- Table 83: Japan Cycling Shoe Covers Revenue (undefined) Forecast, by Application 2020 & 2033
- Table 84: Japan Cycling Shoe Covers Volume (K) Forecast, by Application 2020 & 2033
- Table 85: South Korea Cycling Shoe Covers Revenue (undefined) Forecast, by Application 2020 & 2033
- Table 86: South Korea Cycling Shoe Covers Volume (K) Forecast, by Application 2020 & 2033
- Table 87: ASEAN Cycling Shoe Covers Revenue (undefined) Forecast, by Application 2020 & 2033
- Table 88: ASEAN Cycling Shoe Covers Volume (K) Forecast, by Application 2020 & 2033
- Table 89: Oceania Cycling Shoe Covers Revenue (undefined) Forecast, by Application 2020 & 2033
- Table 90: Oceania Cycling Shoe Covers Volume (K) Forecast, by Application 2020 & 2033
- Table 91: Rest of Asia Pacific Cycling Shoe Covers Revenue (undefined) Forecast, by Application 2020 & 2033
- Table 92: Rest of Asia Pacific Cycling Shoe Covers Volume (K) Forecast, by Application 2020 & 2033
Frequently Asked Questions
1. What is the projected Compound Annual Growth Rate (CAGR) of the Cycling Shoe Covers?
The projected CAGR is approximately 5%.
2. Which companies are prominent players in the Cycling Shoe Covers?
Key companies in the market include Castelli, Endura, Gore, Rapha, Shimano, Altura, Assos, Giordana, Giro, Garneau, PEARL iZUMi, SealSkinz.
3. What are the main segments of the Cycling Shoe Covers?
The market segments include Application, Types.
4. Can you provide details about the market size?
The market size is estimated to be USD XXX N/A as of 2022.
5. What are some drivers contributing to market growth?
N/A
6. What are the notable trends driving market growth?
N/A
7. Are there any restraints impacting market growth?
N/A
8. Can you provide examples of recent developments in the market?
N/A
9. What pricing options are available for accessing the report?
Pricing options include single-user, multi-user, and enterprise licenses priced at USD 3950.00, USD 5925.00, and USD 7900.00 respectively.
10. Is the market size provided in terms of value or volume?
The market size is provided in terms of value, measured in N/A and volume, measured in K.
11. Are there any specific market keywords associated with the report?
Yes, the market keyword associated with the report is "Cycling Shoe Covers," which aids in identifying and referencing the specific market segment covered.
12. How do I determine which pricing option suits my needs best?
The pricing options vary based on user requirements and access needs. Individual users may opt for single-user licenses, while businesses requiring broader access may choose multi-user or enterprise licenses for cost-effective access to the report.
13. Are there any additional resources or data provided in the Cycling Shoe Covers report?
While the report offers comprehensive insights, it's advisable to review the specific contents or supplementary materials provided to ascertain if additional resources or data are available.
14. How can I stay updated on further developments or reports in the Cycling Shoe Covers?
To stay informed about further developments, trends, and reports in the Cycling Shoe Covers, consider subscribing to industry newsletters, following relevant companies and organizations, or regularly checking reputable industry news sources and publications.
Methodology
Step 1 - Identification of Relevant Samples Size from Population Database


Step 2 - Approaches for Defining Global Market Size (Value, Volume* & Price*)

Note*: In applicable scenarios
Step 3 - Data Sources
Primary Research
- Web Analytics
- Survey Reports
- Research Institute
- Latest Research Reports
- Opinion Leaders
Secondary Research
- Annual Reports
- White Paper
- Latest Press Release
- Industry Association
- Paid Database
- Investor Presentations

Step 4 - Data Triangulation
Involves using different sources of information in order to increase the validity of a study
These sources are likely to be stakeholders in a program - participants, other researchers, program staff, other community members, and so on.
Then we put all data in single framework & apply various statistical tools to find out the dynamic on the market.
During the analysis stage, feedback from the stakeholder groups would be compared to determine areas of agreement as well as areas of divergence