

Key Insights
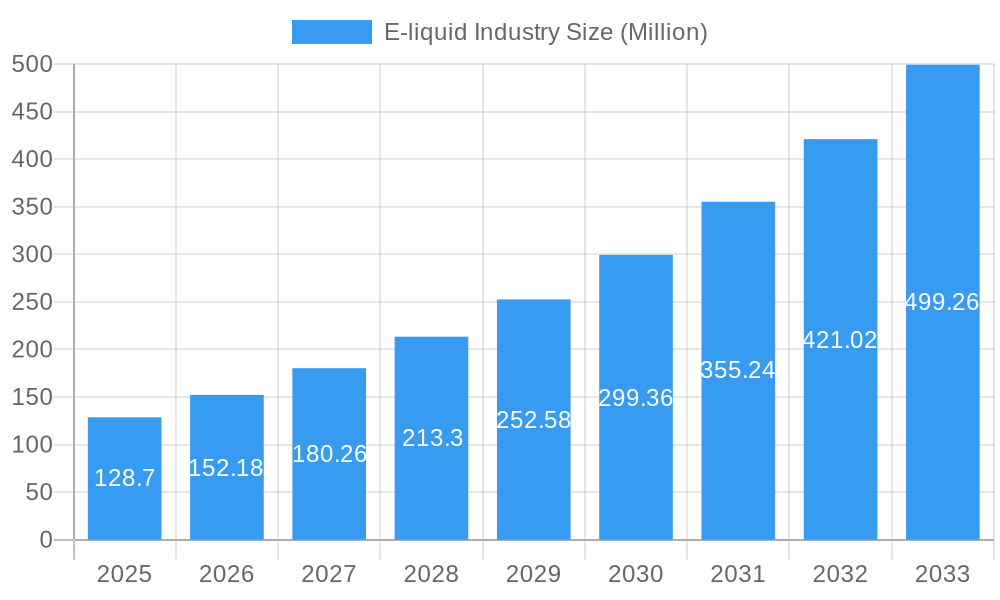
The e-liquid market, valued at $128.70 million in 2025, is projected to experience robust growth, driven by increasing e-cigarette adoption and the diverse range of flavors and nicotine strengths available. The Compound Annual Growth Rate (CAGR) of 18.20% from 2025 to 2033 indicates a significant expansion, potentially reaching over $500 million by 2033. This growth is fueled by several factors, including the perception of e-cigarettes as a less harmful alternative to traditional cigarettes among some consumers, the continuous innovation in device technology offering enhanced user experience, and the expanding online distribution channels increasing accessibility. However, stringent regulations regarding e-liquid composition and sales, particularly concerning nicotine content and youth access, pose significant restraints to market expansion. The market segmentation reveals a strong demand for both e-cigarette devices and e-liquids, with online channels gaining traction compared to offline retailers. Key players like RITCHY GROUP, Innokin Technology, and Philip Morris International are driving innovation and competition within this dynamic sector. Geographical analysis suggests that North America and Europe currently hold a significant market share, but the Asia-Pacific region exhibits high growth potential driven by rising disposable incomes and increasing adoption of vaping culture.
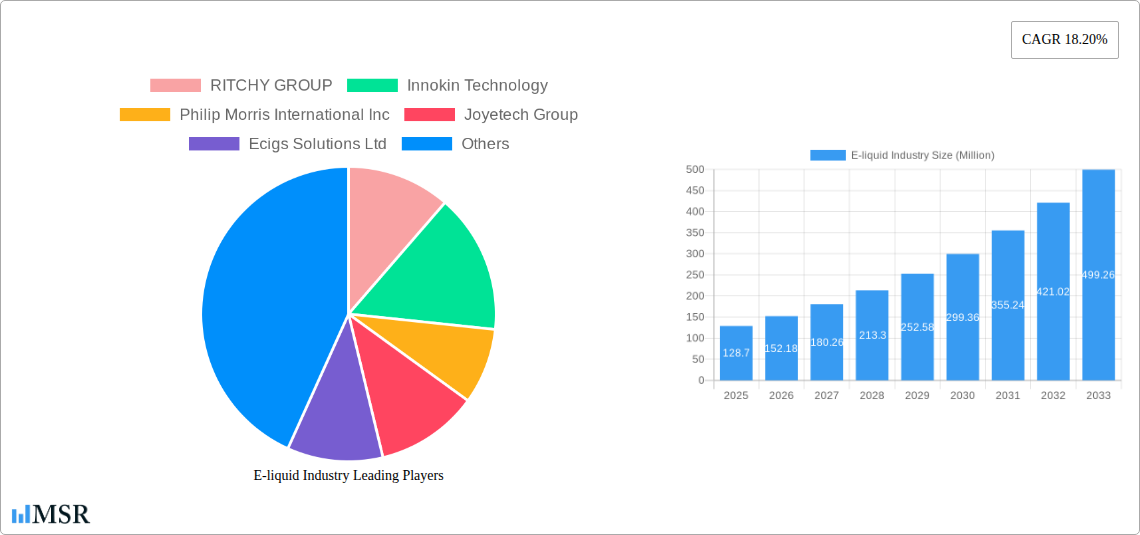
E-liquid Industry Market Size (In Million)
The future of the e-liquid market hinges on the evolving regulatory landscape. Stricter regulations could curtail growth, while more lenient policies could accelerate expansion. Further, the long-term health implications of e-cigarette use remain a subject of ongoing debate, which could impact consumer perception and market demand. The industry’s success will depend on its ability to balance innovation with responsible practices, addressing concerns about public health and youth access while catering to the evolving preferences of adult consumers. Growth in personalized e-liquid options, including bespoke flavor profiles and nicotine levels, is expected to be a key driver in the coming years. The diversification of product offerings, coupled with effective marketing and branding strategies targeting specific demographics, will also play a crucial role in shaping the future trajectory of the e-liquid market.
E-liquid Industry Company Market Share
E-liquid Industry Market Report: 2019-2033 - A Comprehensive Analysis
This comprehensive report provides a detailed analysis of the global e-liquid industry, encompassing market size, growth drivers, key players, and future trends from 2019 to 2033. With a focus on market concentration, technological advancements, and evolving consumer behavior, this report is an essential resource for industry stakeholders, investors, and market researchers seeking actionable insights into this dynamic sector. The report covers a market valued at millions, and includes forecasts through 2033, based on 2025 estimations. This in-depth analysis provides invaluable data for strategic decision-making within the rapidly evolving e-liquid market.
E-liquid Industry Market Concentration & Dynamics
The e-liquid industry exhibits a moderately concentrated market structure, with a few dominant players holding significant market share. However, the presence of numerous smaller players and ongoing innovation contributes to a dynamic competitive landscape. Key players include RITCHY GROUP, Innokin Technology, Philip Morris International Inc, Joyetech Group, Ecigs Solutions Ltd, Intellicig Inc, Aspire, KangerTech, British American Tobacco, and VIP Electronic Cigarettes. Market share distribution varies by segment and region, with online channels showing increasing concentration as larger brands gain e-commerce dominance. The industry is subject to stringent regulatory frameworks, varying significantly across different geographies. This dynamic regulatory environment heavily impacts market access and product development. Substitute products, such as traditional cigarettes and other nicotine delivery systems, pose a continued competitive challenge. Evolving consumer preferences, particularly toward specific flavors and nicotine strengths, further shape market dynamics. Mergers and acquisitions (M&A) activity in the sector remains relatively high, indicating ongoing consolidation and a pursuit of scale and market leadership.
- Market Share (Estimated 2025): Top 5 players hold approximately XX% of the global market.
- M&A Deal Count (2019-2024): Approximately XX deals, primarily focused on smaller players being acquired by larger entities.
- Innovation Ecosystem: Characterized by rapid product development and a focus on innovative vaping technologies.
E-liquid Industry Industry Insights & Trends
The global e-liquid industry experienced robust growth during the historical period (2019-2024), driven by increasing consumer adoption of e-cigarettes and a shift away from traditional smoking. The market size reached approximately $XX Million in 2024, and a Compound Annual Growth Rate (CAGR) of XX% is projected from 2025 to 2033. Technological disruptions, including advancements in battery technology, e-liquid formulations, and device design, have fueled innovation and broadened consumer choice. Evolving consumer behavior reflects a growing preference for healthier alternatives to traditional cigarettes, driving demand for e-liquids with lower nicotine concentrations and natural flavorings. However, the industry also faces headwinds from stricter regulations, public health concerns, and increasing awareness of the potential long-term health effects of vaping. The rise of heated tobacco products also presents a competitive challenge.
Key Markets & Segments Leading E-liquid Industry
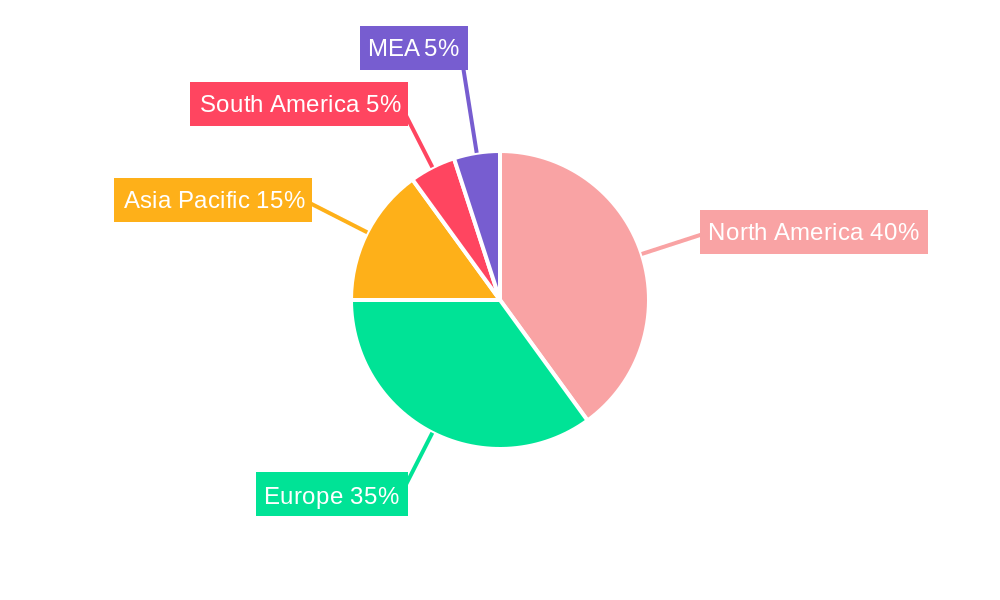
The North American and European markets currently dominate the e-liquid industry, driven by higher consumer adoption rates and more established regulatory frameworks. Within product types, e-cigarette devices represent a larger market segment compared to e-liquid devices, though e-liquid device sales are expected to grow at a faster pace in the future. Online distribution channels are rapidly gaining prominence due to increased convenience and broader market reach, although the offline channel (primarily vape shops) still holds a significant share, especially for premium and specialized products.
- Dominant Region: North America
- Drivers for North American Dominance: High disposable income, established e-commerce infrastructure, and relatively high adoption rates.
- Drivers for European Dominance: High smoking prevalence, growing awareness of health alternatives, and diverse consumer preferences.
- By Product Type: E-cigarette devices currently hold a larger market share.
- By Distribution Channel: Online channel showing rapid growth, driven by convenience and accessibility.
E-liquid Industry Product Developments
Recent years have witnessed significant innovation in e-liquid technology, with a focus on improving flavor delivery, reducing harshness, and providing a more satisfying vaping experience. The development of salt nicotine e-liquids has broadened appeal to consumers seeking a more similar throat hit to traditional cigarettes. Technological advancements in coil and wicking materials continue to improve vapor production and longevity. Competition among manufacturers fosters continuous innovation in product design, resulting in increasingly sophisticated and user-friendly devices.
Challenges in the E-liquid Industry Market
The e-liquid industry faces several significant challenges. These include navigating a constantly evolving regulatory landscape, addressing public health concerns surrounding vaping, and managing supply chain complexities, particularly procurement of raw materials. Intense competition among established brands and the emergence of new market entrants also present ongoing pressure on profitability and market share. The estimated impact of these challenges on market growth is approximately xx% in 2025.
Forces Driving E-liquid Industry Growth
The e-liquid industry's growth is fueled by several key factors. Technological advancements continue to improve vaping devices and e-liquids, enhancing user experience and market appeal. The growing global adult population seeking smoking cessation alternatives fuels increased demand. Favorable regulatory environments in some regions are expanding market accessibility. Finally, the increasing availability of e-liquids with diverse flavors and nicotine strengths expands the consumer base.
Long-Term Growth Catalysts in the E-liquid Industry
Long-term growth in the e-liquid market hinges on continuous innovation in product design, flavor development, and nicotine delivery systems. Strategic partnerships between established players and emerging technologies can unlock new opportunities for growth. Expansion into untapped markets, particularly in developing economies, presents significant potential. However, this potential must be balanced with the need to address public health concerns and ensure responsible marketing.
Emerging Opportunities in E-liquid Industry
Emerging opportunities exist in the development of e-liquids with enhanced flavor profiles, personalized nicotine delivery systems, and more sustainable packaging options. Expansion into new geographical markets and the creation of novel product lines leveraging advanced technologies present exciting prospects. Addressing consumer demand for healthier and safer alternatives will continue to be crucial.
Leading Players in the E-liquid Industry Sector
- RITCHY GROUP
- Innokin Technology
- Philip Morris International Inc
- Joyetech Group
- Ecigs Solutions Ltd
- Intellicig Inc
- Aspire
- KangerTech
- British American Tobacco
- VIP Electronic Cigarettes
Key Milestones in E-liquid Industry Industry
- September 2019: The Emirates Government Consumer Supervision Agency and the Emirates Standardization and Measurement Authority (ESMA) confirmed new regulations for electronic cigarettes in Dubai, legalizing sales under specific conditions.
- November 2019: The Dubai Department of Economic Development (DED) introduced 'Electronic cigarettes & accessories trading' as a legal activity for mainland LLCs.
- April 2022: RELX International lauded the Egyptian authorities' decision to legalize the import and commercialization of e-cigarette products.
Strategic Outlook for E-liquid Industry Market
The e-liquid industry possesses significant future market potential, driven by ongoing technological innovation, shifting consumer preferences, and the expansion of regulated markets. Strategic opportunities lie in developing novel product formulations, expanding into new geographic regions, and capitalizing on partnerships to broaden market access and improve consumer trust. Maintaining responsible marketing practices and proactively addressing public health concerns are essential for long-term industry sustainability.
E-liquid Industry Segmentation
-
1. Product Type
- 1.1. E-cigarette Devices
- 1.2. E-liquid Devices
-
2. Distribution Channel
- 2.1. Offline Channel
- 2.2. Online Channel
-
3. Geography
- 3.1. South Africa
- 3.2. Nigeria
- 3.3. Kenya
- 3.4. Ghana
- 3.5. United Arab Emirates
- 3.6. Egypt
- 3.7. Rest of Middle East & Africa
E-liquid Industry Segmentation By Geography
- 1. South Africa
- 2. Nigeria
- 3. Kenya
- 4. Ghana
- 5. United Arab Emirates
- 6. Egypt
- 7. Rest of Middle East
E-liquid Industry Regional Market Share
Geographic Coverage of E-liquid Industry
E-liquid Industry REPORT HIGHLIGHTS
| Aspects | Details |
|---|---|
| Study Period | 2020-2034 |
| Base Year | 2025 |
| Estimated Year | 2026 |
| Forecast Period | 2026-2034 |
| Historical Period | 2020-2025 |
| Growth Rate | CAGR of 18.20% from 2020-2034 |
| Segmentation |
|
Table of Contents
- 1. Introduction
- 1.1. Research Scope
- 1.2. Market Segmentation
- 1.3. Research Objective
- 1.4. Definitions and Assumptions
- 2. Executive Summary
- 2.1. Market Snapshot
- 3. Market Dynamics
- 3.1. Market Drivers
- 3.2. Market Restrains
- 3.3. Market Trends
- 3.4. Market Opportunities
- 4. Market Factor Analysis
- 4.1. Porters Five Forces
- 4.1.1. Bargaining Power of Suppliers
- 4.1.2. Bargaining Power of Buyers
- 4.1.3. Threat of New Entrants
- 4.1.4. Threat of Substitutes
- 4.1.5. Competitive Rivalry
- 4.2. PESTEL analysis
- 4.3. BCG Analysis
- 4.3.1. Stars (High Growth, High Market Share)
- 4.3.2. Cash Cows (Low Growth, High Market Share)
- 4.3.3. Question Mark (High Growth, Low Market Share)
- 4.3.4. Dogs (Low Growth, Low Market Share)
- 4.4. Ansoff Matrix Analysis
- 4.5. Supply Chain Analysis
- 4.6. Regulatory Landscape
- 4.7. Current Market Potential and Opportunity Assessment (TAM–SAM–SOM Framework)
- 4.8. MSR Analyst Note
- 4.1. Porters Five Forces
- 5. Market Analysis, Insights and Forecast 2021-2033
- 5.1. Market Analysis, Insights and Forecast - by Product Type
- 5.1.1. E-cigarette Devices
- 5.1.2. E-liquid Devices
- 5.2. Market Analysis, Insights and Forecast - by Distribution Channel
- 5.2.1. Offline Channel
- 5.2.2. Online Channel
- 5.3. Market Analysis, Insights and Forecast - by Geography
- 5.3.1. South Africa
- 5.3.2. Nigeria
- 5.3.3. Kenya
- 5.3.4. Ghana
- 5.3.5. United Arab Emirates
- 5.3.6. Egypt
- 5.3.7. Rest of Middle East & Africa
- 5.4. Market Analysis, Insights and Forecast - by Region
- 5.4.1. South Africa
- 5.4.2. Nigeria
- 5.4.3. Kenya
- 5.4.4. Ghana
- 5.4.5. United Arab Emirates
- 5.4.6. Egypt
- 5.4.7. Rest of Middle East
- 5.1. Market Analysis, Insights and Forecast - by Product Type
- 6. Global E-liquid Industry Analysis, Insights and Forecast, 2021-2033
- 6.1. Market Analysis, Insights and Forecast - by Product Type
- 6.1.1. E-cigarette Devices
- 6.1.2. E-liquid Devices
- 6.2. Market Analysis, Insights and Forecast - by Distribution Channel
- 6.2.1. Offline Channel
- 6.2.2. Online Channel
- 6.3. Market Analysis, Insights and Forecast - by Geography
- 6.3.1. South Africa
- 6.3.2. Nigeria
- 6.3.3. Kenya
- 6.3.4. Ghana
- 6.3.5. United Arab Emirates
- 6.3.6. Egypt
- 6.3.7. Rest of Middle East & Africa
- 6.1. Market Analysis, Insights and Forecast - by Product Type
- 7. South Africa E-liquid Industry Analysis, Insights and Forecast, 2020-2032
- 7.1. Market Analysis, Insights and Forecast - by Product Type
- 7.1.1. E-cigarette Devices
- 7.1.2. E-liquid Devices
- 7.2. Market Analysis, Insights and Forecast - by Distribution Channel
- 7.2.1. Offline Channel
- 7.2.2. Online Channel
- 7.3. Market Analysis, Insights and Forecast - by Geography
- 7.3.1. South Africa
- 7.3.2. Nigeria
- 7.3.3. Kenya
- 7.3.4. Ghana
- 7.3.5. United Arab Emirates
- 7.3.6. Egypt
- 7.3.7. Rest of Middle East & Africa
- 7.1. Market Analysis, Insights and Forecast - by Product Type
- 8. Nigeria E-liquid Industry Analysis, Insights and Forecast, 2020-2032
- 8.1. Market Analysis, Insights and Forecast - by Product Type
- 8.1.1. E-cigarette Devices
- 8.1.2. E-liquid Devices
- 8.2. Market Analysis, Insights and Forecast - by Distribution Channel
- 8.2.1. Offline Channel
- 8.2.2. Online Channel
- 8.3. Market Analysis, Insights and Forecast - by Geography
- 8.3.1. South Africa
- 8.3.2. Nigeria
- 8.3.3. Kenya
- 8.3.4. Ghana
- 8.3.5. United Arab Emirates
- 8.3.6. Egypt
- 8.3.7. Rest of Middle East & Africa
- 8.1. Market Analysis, Insights and Forecast - by Product Type
- 9. Kenya E-liquid Industry Analysis, Insights and Forecast, 2020-2032
- 9.1. Market Analysis, Insights and Forecast - by Product Type
- 9.1.1. E-cigarette Devices
- 9.1.2. E-liquid Devices
- 9.2. Market Analysis, Insights and Forecast - by Distribution Channel
- 9.2.1. Offline Channel
- 9.2.2. Online Channel
- 9.3. Market Analysis, Insights and Forecast - by Geography
- 9.3.1. South Africa
- 9.3.2. Nigeria
- 9.3.3. Kenya
- 9.3.4. Ghana
- 9.3.5. United Arab Emirates
- 9.3.6. Egypt
- 9.3.7. Rest of Middle East & Africa
- 9.1. Market Analysis, Insights and Forecast - by Product Type
- 10. Ghana E-liquid Industry Analysis, Insights and Forecast, 2020-2032
- 10.1. Market Analysis, Insights and Forecast - by Product Type
- 10.1.1. E-cigarette Devices
- 10.1.2. E-liquid Devices
- 10.2. Market Analysis, Insights and Forecast - by Distribution Channel
- 10.2.1. Offline Channel
- 10.2.2. Online Channel
- 10.3. Market Analysis, Insights and Forecast - by Geography
- 10.3.1. South Africa
- 10.3.2. Nigeria
- 10.3.3. Kenya
- 10.3.4. Ghana
- 10.3.5. United Arab Emirates
- 10.3.6. Egypt
- 10.3.7. Rest of Middle East & Africa
- 10.1. Market Analysis, Insights and Forecast - by Product Type
- 11. United Arab Emirates E-liquid Industry Analysis, Insights and Forecast, 2020-2032
- 11.1. Market Analysis, Insights and Forecast - by Product Type
- 11.1.1. E-cigarette Devices
- 11.1.2. E-liquid Devices
- 11.2. Market Analysis, Insights and Forecast - by Distribution Channel
- 11.2.1. Offline Channel
- 11.2.2. Online Channel
- 11.3. Market Analysis, Insights and Forecast - by Geography
- 11.3.1. South Africa
- 11.3.2. Nigeria
- 11.3.3. Kenya
- 11.3.4. Ghana
- 11.3.5. United Arab Emirates
- 11.3.6. Egypt
- 11.3.7. Rest of Middle East & Africa
- 11.1. Market Analysis, Insights and Forecast - by Product Type
- 12. Egypt E-liquid Industry Analysis, Insights and Forecast, 2020-2032
- 12.1. Market Analysis, Insights and Forecast - by Product Type
- 12.1.1. E-cigarette Devices
- 12.1.2. E-liquid Devices
- 12.2. Market Analysis, Insights and Forecast - by Distribution Channel
- 12.2.1. Offline Channel
- 12.2.2. Online Channel
- 12.3. Market Analysis, Insights and Forecast - by Geography
- 12.3.1. South Africa
- 12.3.2. Nigeria
- 12.3.3. Kenya
- 12.3.4. Ghana
- 12.3.5. United Arab Emirates
- 12.3.6. Egypt
- 12.3.7. Rest of Middle East & Africa
- 12.1. Market Analysis, Insights and Forecast - by Product Type
- 13. Rest of Middle East E-liquid Industry Analysis, Insights and Forecast, 2020-2032
- 13.1. Market Analysis, Insights and Forecast - by Product Type
- 13.1.1. E-cigarette Devices
- 13.1.2. E-liquid Devices
- 13.2. Market Analysis, Insights and Forecast - by Distribution Channel
- 13.2.1. Offline Channel
- 13.2.2. Online Channel
- 13.3. Market Analysis, Insights and Forecast - by Geography
- 13.3.1. South Africa
- 13.3.2. Nigeria
- 13.3.3. Kenya
- 13.3.4. Ghana
- 13.3.5. United Arab Emirates
- 13.3.6. Egypt
- 13.3.7. Rest of Middle East & Africa
- 13.1. Market Analysis, Insights and Forecast - by Product Type
- 14. Competitive Analysis
- 14.1. Company Profiles
- 14.1.1 RITCHY GROUP
- 14.1.1.1. Company Overview
- 14.1.1.2. Products
- 14.1.1.3. Company Financials
- 14.1.1.4. SWOT Analysis
- 14.1.2 Innokin Technology
- 14.1.2.1. Company Overview
- 14.1.2.2. Products
- 14.1.2.3. Company Financials
- 14.1.2.4. SWOT Analysis
- 14.1.3 Philip Morris International Inc
- 14.1.3.1. Company Overview
- 14.1.3.2. Products
- 14.1.3.3. Company Financials
- 14.1.3.4. SWOT Analysis
- 14.1.4 Joyetech Group
- 14.1.4.1. Company Overview
- 14.1.4.2. Products
- 14.1.4.3. Company Financials
- 14.1.4.4. SWOT Analysis
- 14.1.5 Ecigs Solutions Ltd
- 14.1.5.1. Company Overview
- 14.1.5.2. Products
- 14.1.5.3. Company Financials
- 14.1.5.4. SWOT Analysis
- 14.1.6 Intellicig Inc
- 14.1.6.1. Company Overview
- 14.1.6.2. Products
- 14.1.6.3. Company Financials
- 14.1.6.4. SWOT Analysis
- 14.1.7 Aspire
- 14.1.7.1. Company Overview
- 14.1.7.2. Products
- 14.1.7.3. Company Financials
- 14.1.7.4. SWOT Analysis
- 14.1.8 KangerTech
- 14.1.8.1. Company Overview
- 14.1.8.2. Products
- 14.1.8.3. Company Financials
- 14.1.8.4. SWOT Analysis
- 14.1.9 British American Tobacco
- 14.1.9.1. Company Overview
- 14.1.9.2. Products
- 14.1.9.3. Company Financials
- 14.1.9.4. SWOT Analysis
- 14.1.10 VIP Electronic Cigarettes
- 14.1.10.1. Company Overview
- 14.1.10.2. Products
- 14.1.10.3. Company Financials
- 14.1.10.4. SWOT Analysis
- 14.1.1 RITCHY GROUP
- 14.2. Market Entropy
- 14.2.1 Company's Key Areas Served
- 14.2.2 Recent Developments
- 14.3. Company Market Share Analysis 2025
- 14.3.1 Top 5 Companies Market Share Analysis
- 14.3.2 Top 3 Companies Market Share Analysis
- 14.4. List of Potential Customers
- 15. Research Methodology
List of Figures
- Figure 1: Global E-liquid Industry Revenue Breakdown (Million, %) by Region 2025 & 2033
- Figure 2: South Africa E-liquid Industry Revenue (Million), by Product Type 2025 & 2033
- Figure 3: South Africa E-liquid Industry Revenue Share (%), by Product Type 2025 & 2033
- Figure 4: South Africa E-liquid Industry Revenue (Million), by Distribution Channel 2025 & 2033
- Figure 5: South Africa E-liquid Industry Revenue Share (%), by Distribution Channel 2025 & 2033
- Figure 6: South Africa E-liquid Industry Revenue (Million), by Geography 2025 & 2033
- Figure 7: South Africa E-liquid Industry Revenue Share (%), by Geography 2025 & 2033
- Figure 8: South Africa E-liquid Industry Revenue (Million), by Country 2025 & 2033
- Figure 9: South Africa E-liquid Industry Revenue Share (%), by Country 2025 & 2033
- Figure 10: Nigeria E-liquid Industry Revenue (Million), by Product Type 2025 & 2033
- Figure 11: Nigeria E-liquid Industry Revenue Share (%), by Product Type 2025 & 2033
- Figure 12: Nigeria E-liquid Industry Revenue (Million), by Distribution Channel 2025 & 2033
- Figure 13: Nigeria E-liquid Industry Revenue Share (%), by Distribution Channel 2025 & 2033
- Figure 14: Nigeria E-liquid Industry Revenue (Million), by Geography 2025 & 2033
- Figure 15: Nigeria E-liquid Industry Revenue Share (%), by Geography 2025 & 2033
- Figure 16: Nigeria E-liquid Industry Revenue (Million), by Country 2025 & 2033
- Figure 17: Nigeria E-liquid Industry Revenue Share (%), by Country 2025 & 2033
- Figure 18: Kenya E-liquid Industry Revenue (Million), by Product Type 2025 & 2033
- Figure 19: Kenya E-liquid Industry Revenue Share (%), by Product Type 2025 & 2033
- Figure 20: Kenya E-liquid Industry Revenue (Million), by Distribution Channel 2025 & 2033
- Figure 21: Kenya E-liquid Industry Revenue Share (%), by Distribution Channel 2025 & 2033
- Figure 22: Kenya E-liquid Industry Revenue (Million), by Geography 2025 & 2033
- Figure 23: Kenya E-liquid Industry Revenue Share (%), by Geography 2025 & 2033
- Figure 24: Kenya E-liquid Industry Revenue (Million), by Country 2025 & 2033
- Figure 25: Kenya E-liquid Industry Revenue Share (%), by Country 2025 & 2033
- Figure 26: Ghana E-liquid Industry Revenue (Million), by Product Type 2025 & 2033
- Figure 27: Ghana E-liquid Industry Revenue Share (%), by Product Type 2025 & 2033
- Figure 28: Ghana E-liquid Industry Revenue (Million), by Distribution Channel 2025 & 2033
- Figure 29: Ghana E-liquid Industry Revenue Share (%), by Distribution Channel 2025 & 2033
- Figure 30: Ghana E-liquid Industry Revenue (Million), by Geography 2025 & 2033
- Figure 31: Ghana E-liquid Industry Revenue Share (%), by Geography 2025 & 2033
- Figure 32: Ghana E-liquid Industry Revenue (Million), by Country 2025 & 2033
- Figure 33: Ghana E-liquid Industry Revenue Share (%), by Country 2025 & 2033
- Figure 34: United Arab Emirates E-liquid Industry Revenue (Million), by Product Type 2025 & 2033
- Figure 35: United Arab Emirates E-liquid Industry Revenue Share (%), by Product Type 2025 & 2033
- Figure 36: United Arab Emirates E-liquid Industry Revenue (Million), by Distribution Channel 2025 & 2033
- Figure 37: United Arab Emirates E-liquid Industry Revenue Share (%), by Distribution Channel 2025 & 2033
- Figure 38: United Arab Emirates E-liquid Industry Revenue (Million), by Geography 2025 & 2033
- Figure 39: United Arab Emirates E-liquid Industry Revenue Share (%), by Geography 2025 & 2033
- Figure 40: United Arab Emirates E-liquid Industry Revenue (Million), by Country 2025 & 2033
- Figure 41: United Arab Emirates E-liquid Industry Revenue Share (%), by Country 2025 & 2033
- Figure 42: Egypt E-liquid Industry Revenue (Million), by Product Type 2025 & 2033
- Figure 43: Egypt E-liquid Industry Revenue Share (%), by Product Type 2025 & 2033
- Figure 44: Egypt E-liquid Industry Revenue (Million), by Distribution Channel 2025 & 2033
- Figure 45: Egypt E-liquid Industry Revenue Share (%), by Distribution Channel 2025 & 2033
- Figure 46: Egypt E-liquid Industry Revenue (Million), by Geography 2025 & 2033
- Figure 47: Egypt E-liquid Industry Revenue Share (%), by Geography 2025 & 2033
- Figure 48: Egypt E-liquid Industry Revenue (Million), by Country 2025 & 2033
- Figure 49: Egypt E-liquid Industry Revenue Share (%), by Country 2025 & 2033
- Figure 50: Rest of Middle East E-liquid Industry Revenue (Million), by Product Type 2025 & 2033
- Figure 51: Rest of Middle East E-liquid Industry Revenue Share (%), by Product Type 2025 & 2033
- Figure 52: Rest of Middle East E-liquid Industry Revenue (Million), by Distribution Channel 2025 & 2033
- Figure 53: Rest of Middle East E-liquid Industry Revenue Share (%), by Distribution Channel 2025 & 2033
- Figure 54: Rest of Middle East E-liquid Industry Revenue (Million), by Geography 2025 & 2033
- Figure 55: Rest of Middle East E-liquid Industry Revenue Share (%), by Geography 2025 & 2033
- Figure 56: Rest of Middle East E-liquid Industry Revenue (Million), by Country 2025 & 2033
- Figure 57: Rest of Middle East E-liquid Industry Revenue Share (%), by Country 2025 & 2033
List of Tables
- Table 1: Global E-liquid Industry Revenue Million Forecast, by Product Type 2020 & 2033
- Table 2: Global E-liquid Industry Revenue Million Forecast, by Distribution Channel 2020 & 2033
- Table 3: Global E-liquid Industry Revenue Million Forecast, by Geography 2020 & 2033
- Table 4: Global E-liquid Industry Revenue Million Forecast, by Region 2020 & 2033
- Table 5: Global E-liquid Industry Revenue Million Forecast, by Product Type 2020 & 2033
- Table 6: Global E-liquid Industry Revenue Million Forecast, by Distribution Channel 2020 & 2033
- Table 7: Global E-liquid Industry Revenue Million Forecast, by Geography 2020 & 2033
- Table 8: Global E-liquid Industry Revenue Million Forecast, by Country 2020 & 2033
- Table 9: Global E-liquid Industry Revenue Million Forecast, by Product Type 2020 & 2033
- Table 10: Global E-liquid Industry Revenue Million Forecast, by Distribution Channel 2020 & 2033
- Table 11: Global E-liquid Industry Revenue Million Forecast, by Geography 2020 & 2033
- Table 12: Global E-liquid Industry Revenue Million Forecast, by Country 2020 & 2033
- Table 13: Global E-liquid Industry Revenue Million Forecast, by Product Type 2020 & 2033
- Table 14: Global E-liquid Industry Revenue Million Forecast, by Distribution Channel 2020 & 2033
- Table 15: Global E-liquid Industry Revenue Million Forecast, by Geography 2020 & 2033
- Table 16: Global E-liquid Industry Revenue Million Forecast, by Country 2020 & 2033
- Table 17: Global E-liquid Industry Revenue Million Forecast, by Product Type 2020 & 2033
- Table 18: Global E-liquid Industry Revenue Million Forecast, by Distribution Channel 2020 & 2033
- Table 19: Global E-liquid Industry Revenue Million Forecast, by Geography 2020 & 2033
- Table 20: Global E-liquid Industry Revenue Million Forecast, by Country 2020 & 2033
- Table 21: Global E-liquid Industry Revenue Million Forecast, by Product Type 2020 & 2033
- Table 22: Global E-liquid Industry Revenue Million Forecast, by Distribution Channel 2020 & 2033
- Table 23: Global E-liquid Industry Revenue Million Forecast, by Geography 2020 & 2033
- Table 24: Global E-liquid Industry Revenue Million Forecast, by Country 2020 & 2033
- Table 25: Global E-liquid Industry Revenue Million Forecast, by Product Type 2020 & 2033
- Table 26: Global E-liquid Industry Revenue Million Forecast, by Distribution Channel 2020 & 2033
- Table 27: Global E-liquid Industry Revenue Million Forecast, by Geography 2020 & 2033
- Table 28: Global E-liquid Industry Revenue Million Forecast, by Country 2020 & 2033
- Table 29: Global E-liquid Industry Revenue Million Forecast, by Product Type 2020 & 2033
- Table 30: Global E-liquid Industry Revenue Million Forecast, by Distribution Channel 2020 & 2033
- Table 31: Global E-liquid Industry Revenue Million Forecast, by Geography 2020 & 2033
- Table 32: Global E-liquid Industry Revenue Million Forecast, by Country 2020 & 2033
Frequently Asked Questions
1. What is the projected Compound Annual Growth Rate (CAGR) of the E-liquid Industry?
The projected CAGR is approximately 18.20%.
2. Which companies are prominent players in the E-liquid Industry?
Key companies in the market include RITCHY GROUP, Innokin Technology, Philip Morris International Inc, Joyetech Group, Ecigs Solutions Ltd, Intellicig Inc, Aspire, KangerTech, British American Tobacco, VIP Electronic Cigarettes.
3. What are the main segments of the E-liquid Industry?
The market segments include Product Type, Distribution Channel, Geography.
4. Can you provide details about the market size?
The market size is estimated to be USD 128.70 Million as of 2022.
5. What are some drivers contributing to market growth?
Aggressive Social Media Marketing; Lower-risk Factor Associated with the Use of E-Cigarettes Compared to Conventional/Combustible Cigarettes.
6. What are the notable trends driving market growth?
Penetration of E-cigarettes in Organized Retail.
7. Are there any restraints impacting market growth?
Government Initiatives to Ban Disposable E-Cigarettes.
8. Can you provide examples of recent developments in the market?
In April 2022, RELX International, a multinational electronic cigarettes company, lauds the recent decision by Egyptian authorities to allow the legal import and commercialization of e-cigarette products in the country. The lifting of the ban highlights the Egyptian authorities' progressive approach to e-cigarettes. It sets the stage for creating a regulated market rich with business opportunities by serving the demand for easily accessible, quality products by legal age (adult) consumers across the country.
9. What pricing options are available for accessing the report?
Pricing options include single-user, multi-user, and enterprise licenses priced at USD 4750, USD 5250, and USD 8750 respectively.
10. Is the market size provided in terms of value or volume?
The market size is provided in terms of value, measured in Million.
11. Are there any specific market keywords associated with the report?
Yes, the market keyword associated with the report is "E-liquid Industry," which aids in identifying and referencing the specific market segment covered.
12. How do I determine which pricing option suits my needs best?
The pricing options vary based on user requirements and access needs. Individual users may opt for single-user licenses, while businesses requiring broader access may choose multi-user or enterprise licenses for cost-effective access to the report.
13. Are there any additional resources or data provided in the E-liquid Industry report?
While the report offers comprehensive insights, it's advisable to review the specific contents or supplementary materials provided to ascertain if additional resources or data are available.
14. How can I stay updated on further developments or reports in the E-liquid Industry?
To stay informed about further developments, trends, and reports in the E-liquid Industry, consider subscribing to industry newsletters, following relevant companies and organizations, or regularly checking reputable industry news sources and publications.
Methodology
Step 1 - Identification of Relevant Samples Size from Population Database


Step 2 - Approaches for Defining Global Market Size (Value, Volume* & Price*)

Note*: In applicable scenarios
Step 3 - Data Sources
Primary Research
- Web Analytics
- Survey Reports
- Research Institute
- Latest Research Reports
- Opinion Leaders
Secondary Research
- Annual Reports
- White Paper
- Latest Press Release
- Industry Association
- Paid Database
- Investor Presentations

Step 4 - Data Triangulation
Involves using different sources of information in order to increase the validity of a study
These sources are likely to be stakeholders in a program - participants, other researchers, program staff, other community members, and so on.
Then we put all data in single framework & apply various statistical tools to find out the dynamic on the market.
During the analysis stage, feedback from the stakeholder groups would be compared to determine areas of agreement as well as areas of divergence