

Key Insights
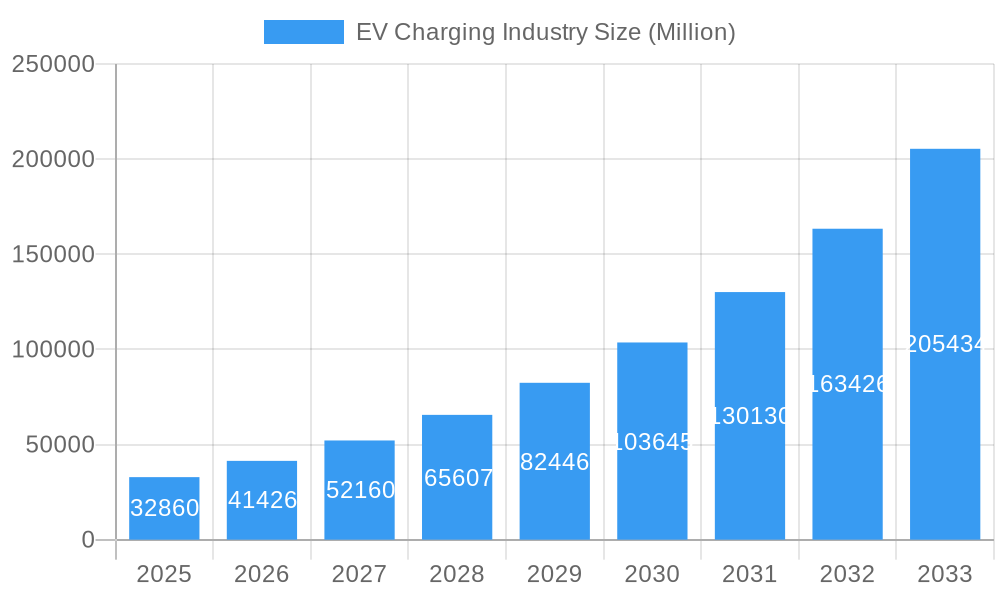
The global EV charging infrastructure market is experiencing explosive growth, projected to reach \$32.86 billion in 2025 and maintain a robust Compound Annual Growth Rate (CAGR) of 25.94% from 2025 to 2033. This expansion is fueled by several key drivers. The increasing adoption of electric vehicles (EVs) globally, driven by environmental concerns and government incentives, is creating a significant demand for charging solutions. Furthermore, advancements in battery technology, leading to improved EV range and reduced charging times, are boosting market appeal. The development of faster charging technologies, such as DC fast charging, is another significant factor contributing to the market's growth. The market is segmented by charger type (AC and DC), charging ownership (public and private), service type (charging and battery swapping), infrastructure type (CHAdeMO, CCS, GB/T, Tesla Superchargers, and others), and vehicle type (passenger cars and commercial vehicles). The diverse range of solutions reflects the varying needs of EV users and the ongoing evolution of the industry. Geographic growth is particularly strong in regions with established EV adoption strategies and robust government support, such as North America, Europe, and Asia-Pacific, with China and the United States holding leading positions. However, challenges remain, including the high initial investment costs associated with deploying charging infrastructure, the need for grid upgrades to handle increased electricity demand, and the ongoing development of standardized charging technologies.
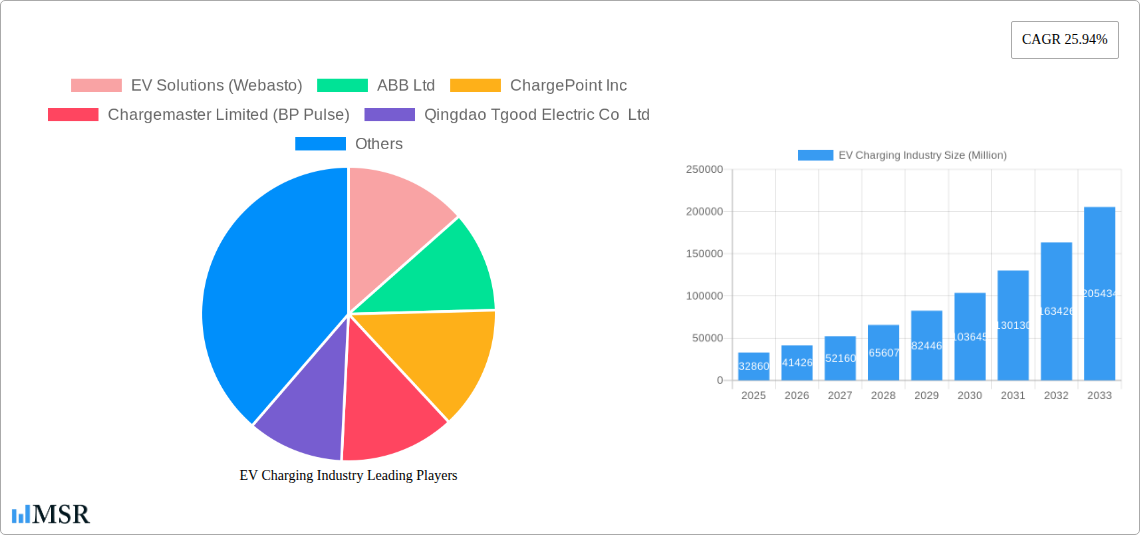
EV Charging Industry Market Size (In Billion)
Despite these challenges, the long-term outlook for the EV charging market remains exceptionally positive. Continued government investment in charging infrastructure development, coupled with technological advancements and the increasing affordability of EVs, are expected to drive sustained growth throughout the forecast period. The rise of smart charging technologies, allowing for optimized energy usage and grid integration, will further enhance the efficiency and sustainability of the EV charging ecosystem. Competition among major players like ChargePoint, ABB, and Tesla, along with the emergence of innovative startups, is driving innovation and expanding market access. The focus is shifting towards providing convenient, reliable, and affordable charging solutions, catering to the diverse needs of EV users across different vehicle types and usage patterns. The ongoing expansion of public charging networks and the increasing availability of private charging options will be instrumental in supporting the widespread adoption of electric mobility.
EV Charging Industry Company Market Share
EV Charging Industry Market Report: 2019-2033 Forecast
This comprehensive report provides an in-depth analysis of the global EV charging industry, projecting a market size exceeding $XX Million by 2033. It covers market dynamics, key segments, leading players, and emerging opportunities, offering invaluable insights for industry stakeholders, investors, and strategists. The report uses 2025 as its base year and analyzes data from the historical period (2019-2024) and forecast period (2025-2033).
EV Charging Industry Market Concentration & Dynamics
The EV charging industry is experiencing rapid growth, driven by increasing EV adoption and supportive government policies. Market concentration is moderate, with several large players and numerous smaller niche providers. The landscape is dynamic, with significant mergers and acquisitions (M&A) activity shaping the competitive landscape. Over the period 2019-2024, we observed approximately xx M&A deals, indicating strong consolidation trends. Major players like ABB Ltd, ChargePoint Inc, and Tesla Motors Inc. hold significant market share, but smaller companies are innovating in areas like specialized charging solutions and software platforms.
- Market Share: ABB Ltd and ChargePoint Inc. command approximately xx% and xx% market share respectively in 2024 (estimated). Tesla holds a significant share in the fast-charging segment.
- Innovation Ecosystems: Open-source initiatives and collaborative partnerships are fostering innovation, particularly in areas like smart charging and grid integration.
- Regulatory Frameworks: Government incentives, emissions regulations, and grid modernization initiatives are key drivers shaping the market. Variations in regulations across different regions influence market growth.
- Substitute Products: While currently limited, alternative technologies like battery swapping are emerging as potential substitutes, particularly for commercial vehicles.
- End-User Trends: Consumer preferences are shifting towards faster charging speeds, convenient locations, and integrated payment solutions.
- M&A Activities: The increase in M&A activity suggests a trend towards consolidation and expansion into new geographical markets.
EV Charging Industry Industry Insights & Trends
The global EV charging market is experiencing phenomenal growth, with a compound annual growth rate (CAGR) of xx% projected from 2025 to 2033. This surge is propelled by several key factors:
- Government Regulations & Incentives: Policies promoting EV adoption and charging infrastructure development are driving rapid expansion.
- Technological Advancements: Innovations like high-power charging (HPC), vehicle-to-grid (V2G) technology, and smart charging management systems are revolutionizing the market.
- Rising EV Sales: The significant increase in electric vehicle sales globally is directly correlated with a higher demand for charging infrastructure.
- Improved Battery Technology: Advances in battery technology are increasing the range and reducing charging times of EVs, fostering greater consumer confidence.
- Increased Consumer Awareness: Rising environmental awareness and concerns about climate change are driving consumer demand for EVs and the necessary supporting infrastructure.
- Expansion of Charging Networks: Existing players are actively expanding their charging networks while new players are entering the market, leading to greater accessibility and competition. The total market value is expected to reach $XX Million by 2033.
Key Markets & Segments Leading EV Charging Industry
The Asia-Pacific region is projected to dominate the EV charging market due to strong government support, rapid EV adoption, and a large and growing automotive industry. China, in particular, is a key driver of growth in this segment.
By Charger Type: The DC fast charging segment is experiencing rapid growth, driven by the demand for faster charging times. However, the AC charging segment still holds a significant market share, particularly for home and workplace charging.
By Charging Ownership Type: Public charging infrastructure is expanding rapidly, while private charging (home and workplace) continues to be a crucial component of the market.
By Charging Service Type: EV charging services are the dominant market segment, while battery swapping services are still emerging, with limited adoption outside of specific niches.
By Charging Infrastructure Type: CCS is gaining market dominance, but other standards like CHAdeMO and GB/T Fast Charge continue to be relevant in certain regions.
By Vehicle Type: Passenger cars account for the largest segment of the EV charging market. However, the commercial vehicle segment is expected to witness significant growth in the coming years.
Growth Drivers:
- Strong government support and policies favoring EV adoption
- Increasing electric vehicle sales
- Development of robust charging infrastructure
- Advancements in battery technology and charging speed.
- Growing consumer demand for EVs and convenient charging options.
EV Charging Industry Product Developments
Recent product innovations highlight a trend towards higher power outputs, improved reliability, and smarter charging management systems. The launch of 400kW charging stations, such as the EVBox Troniq High Power, exemplifies this trend, catering to the need for significantly reduced charging times. These advancements aim to overcome range anxiety and improve the overall EV ownership experience, driving broader market adoption.
Challenges in the EV Charging Industry Market
The EV charging industry faces several challenges, including:
- High upfront investment costs for infrastructure: This barrier to entry limits participation for smaller companies.
- Interoperability issues: The lack of standardization across charging connectors and protocols causes inconvenience for drivers.
- Grid capacity constraints: Rapid growth in charging demand puts pressure on existing power grids, requiring upgrades and expansion.
- Uneven geographical distribution: Many areas lack sufficient charging infrastructure, particularly in rural regions.
These challenges collectively reduce market accessibility and slow down overall growth.
Forces Driving EV Charging Industry Growth
Key factors driving market growth include:
- Government incentives and policies: Subsidies and tax credits encourage EV adoption and infrastructure deployment.
- Technological advancements: Higher power charging, smart grid integration, and battery innovations are attracting consumers.
- Growing environmental awareness: Concerns about climate change are driving demand for EVs and related infrastructure.
- Decreasing battery costs: Making EVs more affordable and widening market appeal.
Challenges in the EV Charging Industry Market
Long-term growth will depend on overcoming challenges such as:
- Standardization of charging technologies and protocols: Interoperability is critical for wider adoption.
- Investment in grid infrastructure upgrades: Ensuring the electricity grid can handle increased demand.
- Addressing range anxiety through improved battery technology and wider network coverage: Enhanced charging network accessibility is needed for widespread adoption.
Emerging Opportunities in EV Charging Industry
Emerging opportunities include:
- Integration of renewable energy sources: Using solar and wind power to reduce charging costs and emissions.
- Development of smart charging solutions: Optimizing energy usage and grid stability.
- Expansion into new markets: Developing charging infrastructure in underserved areas.
- Growth in commercial vehicle charging: Providing charging solutions for fleets and logistics.
Leading Players in the EV Charging Industry Sector
- EV Solutions (Webasto)
- ABB Ltd
- ChargePoint Inc
- Chargemaster Limited (BP Pulse)
- Qingdao Tgood Electric Co Ltd
- Leviton Manufacturing Co Inc
- BYD Company
- Siemens AG
- Schneider Electric SE
- EFACEC Power Solutions SGPS
- Evbox (ENGIE)
- Wanbang Digital Energy Pte Ltd (Star Charge)
- Tesla Motors Inc
- SemaConnect Inc
- The Newmotion BV (Acquired by Shell)
Key Milestones in EV Charging Industry Industry
- March 2023: 7-Eleven Inc. launched 7Charge, expanding fast-charging access. This significantly increased the convenience and accessibility of EV charging for consumers.
- June 2023: Stellantis introduced Free2move Charge, a comprehensive ecosystem for EV charging and energy management. This holistic approach enhances the EV ownership experience.
- June 2023: Circontrol launched Genion One, enabling 100% green energy EV charging. This caters to environmentally conscious drivers, boosting the adoption of sustainable charging practices.
- June 2023: EVBox unveiled the EVBox Troniq High Power, a 400 kW charging station, setting a new standard for fast charging capabilities. This development addresses range anxiety and accelerates the transition to EVs.
Strategic Outlook for EV Charging Industry Market
The future of the EV charging industry is bright, with significant potential for growth fueled by continued EV adoption, technological advancements, and supportive government policies. Strategic opportunities lie in expanding charging infrastructure, integrating renewable energy sources, and developing smart charging solutions to optimize grid management and reduce charging costs. Companies focusing on innovation, strategic partnerships, and global expansion will be best positioned to capitalize on the market's immense growth potential.
EV Charging Industry Segmentation
-
1. Vehicle Type
- 1.1. Passenger Cars
- 1.2. Commercial Vehicles
-
2. Charger Type
- 2.1. AC Charging Station
- 2.2. DC Charging Station
-
3. Charging Ownership Type
- 3.1. Public
- 3.2. Private
-
4. Charging Service Type
- 4.1. EV Charging Services
- 4.2. Battery Swapping Services
-
5. Charging Infrastructure Type
- 5.1. Chademo
- 5.2. CCS
- 5.3. GB/T Fast Charge
- 5.4. Tesla Superchargers
- 5.5. Other Charging Infrastructure Types
EV Charging Industry Segmentation By Geography
-
1. North America
- 1.1. United States
- 1.2. Canada
- 1.3. Rest of North America
-
2. Europe
- 2.1. Germany
- 2.2. United Kingdom
- 2.3. France
- 2.4. Italy
- 2.5. Rest of Europe
-
3. Asia Pacific
- 3.1. China
- 3.2. Japan
- 3.3. India
- 3.4. South Korea
- 3.5. Rest of Asia Pacific
-
4. Rest of the World
- 4.1. South America
- 4.2. Middle East and Africa
EV Charging Industry Regional Market Share
Geographic Coverage of EV Charging Industry
EV Charging Industry REPORT HIGHLIGHTS
| Aspects | Details |
|---|---|
| Study Period | 2020-2034 |
| Base Year | 2025 |
| Estimated Year | 2026 |
| Forecast Period | 2026-2034 |
| Historical Period | 2020-2025 |
| Growth Rate | CAGR of 25.94% from 2020-2034 |
| Segmentation |
|
Table of Contents
- 1. Introduction
- 1.1. Research Scope
- 1.2. Market Segmentation
- 1.3. Research Objective
- 1.4. Definitions and Assumptions
- 2. Executive Summary
- 2.1. Market Snapshot
- 3. Market Dynamics
- 3.1. Market Drivers
- 3.2. Market Restrains
- 3.3. Market Trends
- 3.4. Market Opportunities
- 4. Market Factor Analysis
- 4.1. Porters Five Forces
- 4.1.1. Bargaining Power of Suppliers
- 4.1.2. Bargaining Power of Buyers
- 4.1.3. Threat of New Entrants
- 4.1.4. Threat of Substitutes
- 4.1.5. Competitive Rivalry
- 4.2. PESTEL analysis
- 4.3. BCG Analysis
- 4.3.1. Stars (High Growth, High Market Share)
- 4.3.2. Cash Cows (Low Growth, High Market Share)
- 4.3.3. Question Mark (High Growth, Low Market Share)
- 4.3.4. Dogs (Low Growth, Low Market Share)
- 4.4. Ansoff Matrix Analysis
- 4.5. Supply Chain Analysis
- 4.6. Regulatory Landscape
- 4.7. Current Market Potential and Opportunity Assessment (TAM–SAM–SOM Framework)
- 4.8. MSR Analyst Note
- 4.1. Porters Five Forces
- 5. Market Analysis, Insights and Forecast 2021-2033
- 5.1. Market Analysis, Insights and Forecast - by Vehicle Type
- 5.1.1. Passenger Cars
- 5.1.2. Commercial Vehicles
- 5.2. Market Analysis, Insights and Forecast - by Charger Type
- 5.2.1. AC Charging Station
- 5.2.2. DC Charging Station
- 5.3. Market Analysis, Insights and Forecast - by Charging Ownership Type
- 5.3.1. Public
- 5.3.2. Private
- 5.4. Market Analysis, Insights and Forecast - by Charging Service Type
- 5.4.1. EV Charging Services
- 5.4.2. Battery Swapping Services
- 5.5. Market Analysis, Insights and Forecast - by Charging Infrastructure Type
- 5.5.1. Chademo
- 5.5.2. CCS
- 5.5.3. GB/T Fast Charge
- 5.5.4. Tesla Superchargers
- 5.5.5. Other Charging Infrastructure Types
- 5.6. Market Analysis, Insights and Forecast - by Region
- 5.6.1. North America
- 5.6.2. Europe
- 5.6.3. Asia Pacific
- 5.6.4. Rest of the World
- 5.1. Market Analysis, Insights and Forecast - by Vehicle Type
- 6. Global EV Charging Industry Analysis, Insights and Forecast, 2021-2033
- 6.1. Market Analysis, Insights and Forecast - by Vehicle Type
- 6.1.1. Passenger Cars
- 6.1.2. Commercial Vehicles
- 6.2. Market Analysis, Insights and Forecast - by Charger Type
- 6.2.1. AC Charging Station
- 6.2.2. DC Charging Station
- 6.3. Market Analysis, Insights and Forecast - by Charging Ownership Type
- 6.3.1. Public
- 6.3.2. Private
- 6.4. Market Analysis, Insights and Forecast - by Charging Service Type
- 6.4.1. EV Charging Services
- 6.4.2. Battery Swapping Services
- 6.5. Market Analysis, Insights and Forecast - by Charging Infrastructure Type
- 6.5.1. Chademo
- 6.5.2. CCS
- 6.5.3. GB/T Fast Charge
- 6.5.4. Tesla Superchargers
- 6.5.5. Other Charging Infrastructure Types
- 6.1. Market Analysis, Insights and Forecast - by Vehicle Type
- 7. North America EV Charging Industry Analysis, Insights and Forecast, 2020-2032
- 7.1. Market Analysis, Insights and Forecast - by Vehicle Type
- 7.1.1. Passenger Cars
- 7.1.2. Commercial Vehicles
- 7.2. Market Analysis, Insights and Forecast - by Charger Type
- 7.2.1. AC Charging Station
- 7.2.2. DC Charging Station
- 7.3. Market Analysis, Insights and Forecast - by Charging Ownership Type
- 7.3.1. Public
- 7.3.2. Private
- 7.4. Market Analysis, Insights and Forecast - by Charging Service Type
- 7.4.1. EV Charging Services
- 7.4.2. Battery Swapping Services
- 7.5. Market Analysis, Insights and Forecast - by Charging Infrastructure Type
- 7.5.1. Chademo
- 7.5.2. CCS
- 7.5.3. GB/T Fast Charge
- 7.5.4. Tesla Superchargers
- 7.5.5. Other Charging Infrastructure Types
- 7.1. Market Analysis, Insights and Forecast - by Vehicle Type
- 8. Europe EV Charging Industry Analysis, Insights and Forecast, 2020-2032
- 8.1. Market Analysis, Insights and Forecast - by Vehicle Type
- 8.1.1. Passenger Cars
- 8.1.2. Commercial Vehicles
- 8.2. Market Analysis, Insights and Forecast - by Charger Type
- 8.2.1. AC Charging Station
- 8.2.2. DC Charging Station
- 8.3. Market Analysis, Insights and Forecast - by Charging Ownership Type
- 8.3.1. Public
- 8.3.2. Private
- 8.4. Market Analysis, Insights and Forecast - by Charging Service Type
- 8.4.1. EV Charging Services
- 8.4.2. Battery Swapping Services
- 8.5. Market Analysis, Insights and Forecast - by Charging Infrastructure Type
- 8.5.1. Chademo
- 8.5.2. CCS
- 8.5.3. GB/T Fast Charge
- 8.5.4. Tesla Superchargers
- 8.5.5. Other Charging Infrastructure Types
- 8.1. Market Analysis, Insights and Forecast - by Vehicle Type
- 9. Asia Pacific EV Charging Industry Analysis, Insights and Forecast, 2020-2032
- 9.1. Market Analysis, Insights and Forecast - by Vehicle Type
- 9.1.1. Passenger Cars
- 9.1.2. Commercial Vehicles
- 9.2. Market Analysis, Insights and Forecast - by Charger Type
- 9.2.1. AC Charging Station
- 9.2.2. DC Charging Station
- 9.3. Market Analysis, Insights and Forecast - by Charging Ownership Type
- 9.3.1. Public
- 9.3.2. Private
- 9.4. Market Analysis, Insights and Forecast - by Charging Service Type
- 9.4.1. EV Charging Services
- 9.4.2. Battery Swapping Services
- 9.5. Market Analysis, Insights and Forecast - by Charging Infrastructure Type
- 9.5.1. Chademo
- 9.5.2. CCS
- 9.5.3. GB/T Fast Charge
- 9.5.4. Tesla Superchargers
- 9.5.5. Other Charging Infrastructure Types
- 9.1. Market Analysis, Insights and Forecast - by Vehicle Type
- 10. Rest of the World EV Charging Industry Analysis, Insights and Forecast, 2020-2032
- 10.1. Market Analysis, Insights and Forecast - by Vehicle Type
- 10.1.1. Passenger Cars
- 10.1.2. Commercial Vehicles
- 10.2. Market Analysis, Insights and Forecast - by Charger Type
- 10.2.1. AC Charging Station
- 10.2.2. DC Charging Station
- 10.3. Market Analysis, Insights and Forecast - by Charging Ownership Type
- 10.3.1. Public
- 10.3.2. Private
- 10.4. Market Analysis, Insights and Forecast - by Charging Service Type
- 10.4.1. EV Charging Services
- 10.4.2. Battery Swapping Services
- 10.5. Market Analysis, Insights and Forecast - by Charging Infrastructure Type
- 10.5.1. Chademo
- 10.5.2. CCS
- 10.5.3. GB/T Fast Charge
- 10.5.4. Tesla Superchargers
- 10.5.5. Other Charging Infrastructure Types
- 10.1. Market Analysis, Insights and Forecast - by Vehicle Type
- 11. Competitive Analysis
- 11.1. Company Profiles
- 11.1.1 EV Solutions (Webasto)
- 11.1.1.1. Company Overview
- 11.1.1.2. Products
- 11.1.1.3. Company Financials
- 11.1.1.4. SWOT Analysis
- 11.1.2 ABB Ltd
- 11.1.2.1. Company Overview
- 11.1.2.2. Products
- 11.1.2.3. Company Financials
- 11.1.2.4. SWOT Analysis
- 11.1.3 ChargePoint Inc
- 11.1.3.1. Company Overview
- 11.1.3.2. Products
- 11.1.3.3. Company Financials
- 11.1.3.4. SWOT Analysis
- 11.1.4 Chargemaster Limited (BP Pulse)
- 11.1.4.1. Company Overview
- 11.1.4.2. Products
- 11.1.4.3. Company Financials
- 11.1.4.4. SWOT Analysis
- 11.1.5 Qingdao Tgood Electric Co Ltd
- 11.1.5.1. Company Overview
- 11.1.5.2. Products
- 11.1.5.3. Company Financials
- 11.1.5.4. SWOT Analysis
- 11.1.6 Leviton Manufacturing Co Inc
- 11.1.6.1. Company Overview
- 11.1.6.2. Products
- 11.1.6.3. Company Financials
- 11.1.6.4. SWOT Analysis
- 11.1.7 BYD Company
- 11.1.7.1. Company Overview
- 11.1.7.2. Products
- 11.1.7.3. Company Financials
- 11.1.7.4. SWOT Analysis
- 11.1.8 Siemens AG
- 11.1.8.1. Company Overview
- 11.1.8.2. Products
- 11.1.8.3. Company Financials
- 11.1.8.4. SWOT Analysis
- 11.1.9 Schneider Electric SE
- 11.1.9.1. Company Overview
- 11.1.9.2. Products
- 11.1.9.3. Company Financials
- 11.1.9.4. SWOT Analysis
- 11.1.10 EFACEC Power Solutions SGPS
- 11.1.10.1. Company Overview
- 11.1.10.2. Products
- 11.1.10.3. Company Financials
- 11.1.10.4. SWOT Analysis
- 11.1.11 Evbox (ENGIE)
- 11.1.11.1. Company Overview
- 11.1.11.2. Products
- 11.1.11.3. Company Financials
- 11.1.11.4. SWOT Analysis
- 11.1.12 Wanbang Digital Energy Pte Ltd (Star Charge
- 11.1.12.1. Company Overview
- 11.1.12.2. Products
- 11.1.12.3. Company Financials
- 11.1.12.4. SWOT Analysis
- 11.1.13 Tesla Motors Inc
- 11.1.13.1. Company Overview
- 11.1.13.2. Products
- 11.1.13.3. Company Financials
- 11.1.13.4. SWOT Analysis
- 11.1.14 SemaConnect Inc
- 11.1.14.1. Company Overview
- 11.1.14.2. Products
- 11.1.14.3. Company Financials
- 11.1.14.4. SWOT Analysis
- 11.1.15 The Newmotion BV (Acquired by Shell)
- 11.1.15.1. Company Overview
- 11.1.15.2. Products
- 11.1.15.3. Company Financials
- 11.1.15.4. SWOT Analysis
- 11.1.1 EV Solutions (Webasto)
- 11.2. Market Entropy
- 11.2.1 Company's Key Areas Served
- 11.2.2 Recent Developments
- 11.3. Company Market Share Analysis 2025
- 11.3.1 Top 5 Companies Market Share Analysis
- 11.3.2 Top 3 Companies Market Share Analysis
- 11.4. List of Potential Customers
- 12. Research Methodology
List of Figures
- Figure 1: Global EV Charging Industry Revenue Breakdown (Million, %) by Region 2025 & 2033
- Figure 2: North America EV Charging Industry Revenue (Million), by Vehicle Type 2025 & 2033
- Figure 3: North America EV Charging Industry Revenue Share (%), by Vehicle Type 2025 & 2033
- Figure 4: North America EV Charging Industry Revenue (Million), by Charger Type 2025 & 2033
- Figure 5: North America EV Charging Industry Revenue Share (%), by Charger Type 2025 & 2033
- Figure 6: North America EV Charging Industry Revenue (Million), by Charging Ownership Type 2025 & 2033
- Figure 7: North America EV Charging Industry Revenue Share (%), by Charging Ownership Type 2025 & 2033
- Figure 8: North America EV Charging Industry Revenue (Million), by Charging Service Type 2025 & 2033
- Figure 9: North America EV Charging Industry Revenue Share (%), by Charging Service Type 2025 & 2033
- Figure 10: North America EV Charging Industry Revenue (Million), by Charging Infrastructure Type 2025 & 2033
- Figure 11: North America EV Charging Industry Revenue Share (%), by Charging Infrastructure Type 2025 & 2033
- Figure 12: North America EV Charging Industry Revenue (Million), by Country 2025 & 2033
- Figure 13: North America EV Charging Industry Revenue Share (%), by Country 2025 & 2033
- Figure 14: Europe EV Charging Industry Revenue (Million), by Vehicle Type 2025 & 2033
- Figure 15: Europe EV Charging Industry Revenue Share (%), by Vehicle Type 2025 & 2033
- Figure 16: Europe EV Charging Industry Revenue (Million), by Charger Type 2025 & 2033
- Figure 17: Europe EV Charging Industry Revenue Share (%), by Charger Type 2025 & 2033
- Figure 18: Europe EV Charging Industry Revenue (Million), by Charging Ownership Type 2025 & 2033
- Figure 19: Europe EV Charging Industry Revenue Share (%), by Charging Ownership Type 2025 & 2033
- Figure 20: Europe EV Charging Industry Revenue (Million), by Charging Service Type 2025 & 2033
- Figure 21: Europe EV Charging Industry Revenue Share (%), by Charging Service Type 2025 & 2033
- Figure 22: Europe EV Charging Industry Revenue (Million), by Charging Infrastructure Type 2025 & 2033
- Figure 23: Europe EV Charging Industry Revenue Share (%), by Charging Infrastructure Type 2025 & 2033
- Figure 24: Europe EV Charging Industry Revenue (Million), by Country 2025 & 2033
- Figure 25: Europe EV Charging Industry Revenue Share (%), by Country 2025 & 2033
- Figure 26: Asia Pacific EV Charging Industry Revenue (Million), by Vehicle Type 2025 & 2033
- Figure 27: Asia Pacific EV Charging Industry Revenue Share (%), by Vehicle Type 2025 & 2033
- Figure 28: Asia Pacific EV Charging Industry Revenue (Million), by Charger Type 2025 & 2033
- Figure 29: Asia Pacific EV Charging Industry Revenue Share (%), by Charger Type 2025 & 2033
- Figure 30: Asia Pacific EV Charging Industry Revenue (Million), by Charging Ownership Type 2025 & 2033
- Figure 31: Asia Pacific EV Charging Industry Revenue Share (%), by Charging Ownership Type 2025 & 2033
- Figure 32: Asia Pacific EV Charging Industry Revenue (Million), by Charging Service Type 2025 & 2033
- Figure 33: Asia Pacific EV Charging Industry Revenue Share (%), by Charging Service Type 2025 & 2033
- Figure 34: Asia Pacific EV Charging Industry Revenue (Million), by Charging Infrastructure Type 2025 & 2033
- Figure 35: Asia Pacific EV Charging Industry Revenue Share (%), by Charging Infrastructure Type 2025 & 2033
- Figure 36: Asia Pacific EV Charging Industry Revenue (Million), by Country 2025 & 2033
- Figure 37: Asia Pacific EV Charging Industry Revenue Share (%), by Country 2025 & 2033
- Figure 38: Rest of the World EV Charging Industry Revenue (Million), by Vehicle Type 2025 & 2033
- Figure 39: Rest of the World EV Charging Industry Revenue Share (%), by Vehicle Type 2025 & 2033
- Figure 40: Rest of the World EV Charging Industry Revenue (Million), by Charger Type 2025 & 2033
- Figure 41: Rest of the World EV Charging Industry Revenue Share (%), by Charger Type 2025 & 2033
- Figure 42: Rest of the World EV Charging Industry Revenue (Million), by Charging Ownership Type 2025 & 2033
- Figure 43: Rest of the World EV Charging Industry Revenue Share (%), by Charging Ownership Type 2025 & 2033
- Figure 44: Rest of the World EV Charging Industry Revenue (Million), by Charging Service Type 2025 & 2033
- Figure 45: Rest of the World EV Charging Industry Revenue Share (%), by Charging Service Type 2025 & 2033
- Figure 46: Rest of the World EV Charging Industry Revenue (Million), by Charging Infrastructure Type 2025 & 2033
- Figure 47: Rest of the World EV Charging Industry Revenue Share (%), by Charging Infrastructure Type 2025 & 2033
- Figure 48: Rest of the World EV Charging Industry Revenue (Million), by Country 2025 & 2033
- Figure 49: Rest of the World EV Charging Industry Revenue Share (%), by Country 2025 & 2033
List of Tables
- Table 1: Global EV Charging Industry Revenue Million Forecast, by Vehicle Type 2020 & 2033
- Table 2: Global EV Charging Industry Revenue Million Forecast, by Charger Type 2020 & 2033
- Table 3: Global EV Charging Industry Revenue Million Forecast, by Charging Ownership Type 2020 & 2033
- Table 4: Global EV Charging Industry Revenue Million Forecast, by Charging Service Type 2020 & 2033
- Table 5: Global EV Charging Industry Revenue Million Forecast, by Charging Infrastructure Type 2020 & 2033
- Table 6: Global EV Charging Industry Revenue Million Forecast, by Region 2020 & 2033
- Table 7: Global EV Charging Industry Revenue Million Forecast, by Vehicle Type 2020 & 2033
- Table 8: Global EV Charging Industry Revenue Million Forecast, by Charger Type 2020 & 2033
- Table 9: Global EV Charging Industry Revenue Million Forecast, by Charging Ownership Type 2020 & 2033
- Table 10: Global EV Charging Industry Revenue Million Forecast, by Charging Service Type 2020 & 2033
- Table 11: Global EV Charging Industry Revenue Million Forecast, by Charging Infrastructure Type 2020 & 2033
- Table 12: Global EV Charging Industry Revenue Million Forecast, by Country 2020 & 2033
- Table 13: United States EV Charging Industry Revenue (Million) Forecast, by Application 2020 & 2033
- Table 14: Canada EV Charging Industry Revenue (Million) Forecast, by Application 2020 & 2033
- Table 15: Rest of North America EV Charging Industry Revenue (Million) Forecast, by Application 2020 & 2033
- Table 16: Global EV Charging Industry Revenue Million Forecast, by Vehicle Type 2020 & 2033
- Table 17: Global EV Charging Industry Revenue Million Forecast, by Charger Type 2020 & 2033
- Table 18: Global EV Charging Industry Revenue Million Forecast, by Charging Ownership Type 2020 & 2033
- Table 19: Global EV Charging Industry Revenue Million Forecast, by Charging Service Type 2020 & 2033
- Table 20: Global EV Charging Industry Revenue Million Forecast, by Charging Infrastructure Type 2020 & 2033
- Table 21: Global EV Charging Industry Revenue Million Forecast, by Country 2020 & 2033
- Table 22: Germany EV Charging Industry Revenue (Million) Forecast, by Application 2020 & 2033
- Table 23: United Kingdom EV Charging Industry Revenue (Million) Forecast, by Application 2020 & 2033
- Table 24: France EV Charging Industry Revenue (Million) Forecast, by Application 2020 & 2033
- Table 25: Italy EV Charging Industry Revenue (Million) Forecast, by Application 2020 & 2033
- Table 26: Rest of Europe EV Charging Industry Revenue (Million) Forecast, by Application 2020 & 2033
- Table 27: Global EV Charging Industry Revenue Million Forecast, by Vehicle Type 2020 & 2033
- Table 28: Global EV Charging Industry Revenue Million Forecast, by Charger Type 2020 & 2033
- Table 29: Global EV Charging Industry Revenue Million Forecast, by Charging Ownership Type 2020 & 2033
- Table 30: Global EV Charging Industry Revenue Million Forecast, by Charging Service Type 2020 & 2033
- Table 31: Global EV Charging Industry Revenue Million Forecast, by Charging Infrastructure Type 2020 & 2033
- Table 32: Global EV Charging Industry Revenue Million Forecast, by Country 2020 & 2033
- Table 33: China EV Charging Industry Revenue (Million) Forecast, by Application 2020 & 2033
- Table 34: Japan EV Charging Industry Revenue (Million) Forecast, by Application 2020 & 2033
- Table 35: India EV Charging Industry Revenue (Million) Forecast, by Application 2020 & 2033
- Table 36: South Korea EV Charging Industry Revenue (Million) Forecast, by Application 2020 & 2033
- Table 37: Rest of Asia Pacific EV Charging Industry Revenue (Million) Forecast, by Application 2020 & 2033
- Table 38: Global EV Charging Industry Revenue Million Forecast, by Vehicle Type 2020 & 2033
- Table 39: Global EV Charging Industry Revenue Million Forecast, by Charger Type 2020 & 2033
- Table 40: Global EV Charging Industry Revenue Million Forecast, by Charging Ownership Type 2020 & 2033
- Table 41: Global EV Charging Industry Revenue Million Forecast, by Charging Service Type 2020 & 2033
- Table 42: Global EV Charging Industry Revenue Million Forecast, by Charging Infrastructure Type 2020 & 2033
- Table 43: Global EV Charging Industry Revenue Million Forecast, by Country 2020 & 2033
- Table 44: South America EV Charging Industry Revenue (Million) Forecast, by Application 2020 & 2033
- Table 45: Middle East and Africa EV Charging Industry Revenue (Million) Forecast, by Application 2020 & 2033
Frequently Asked Questions
1. What is the projected Compound Annual Growth Rate (CAGR) of the EV Charging Industry?
The projected CAGR is approximately 25.94%.
2. Which companies are prominent players in the EV Charging Industry?
Key companies in the market include EV Solutions (Webasto), ABB Ltd, ChargePoint Inc, Chargemaster Limited (BP Pulse), Qingdao Tgood Electric Co Ltd, Leviton Manufacturing Co Inc, BYD Company, Siemens AG, Schneider Electric SE, EFACEC Power Solutions SGPS, Evbox (ENGIE), Wanbang Digital Energy Pte Ltd (Star Charge, Tesla Motors Inc, SemaConnect Inc, The Newmotion BV (Acquired by Shell).
3. What are the main segments of the EV Charging Industry?
The market segments include Vehicle Type, Charger Type, Charging Ownership Type, Charging Service Type, Charging Infrastructure Type.
4. Can you provide details about the market size?
The market size is estimated to be USD 32.86 Million as of 2022.
5. What are some drivers contributing to market growth?
Rising EV Sales and Decreasing EV Prices are Driving the Market.
6. What are the notable trends driving market growth?
Passenger Cars are Leading the Electric Vehicle Charging Station Market.
7. Are there any restraints impacting market growth?
High Initial Cost of Installing and Maintaining a Standard EV Charging Station is a Challenge.
8. Can you provide examples of recent developments in the market?
June 2023: Stellantis introduced Free2move Charge, a comprehensive ecosystem that provides seamless charging and energy management solutions for electric vehicle (EV) customers. This holistic approach caters to EV needs across various scenarios, including home charging, business charging, and on-the-go charging. The initiative is overseen by the newly established Stellantis Charging & Energy Business Unit, emphasizing Stellantis’s commitment to supporting the growing EV market.
9. What pricing options are available for accessing the report?
Pricing options include single-user, multi-user, and enterprise licenses priced at USD 4750, USD 5250, and USD 8750 respectively.
10. Is the market size provided in terms of value or volume?
The market size is provided in terms of value, measured in Million.
11. Are there any specific market keywords associated with the report?
Yes, the market keyword associated with the report is "EV Charging Industry," which aids in identifying and referencing the specific market segment covered.
12. How do I determine which pricing option suits my needs best?
The pricing options vary based on user requirements and access needs. Individual users may opt for single-user licenses, while businesses requiring broader access may choose multi-user or enterprise licenses for cost-effective access to the report.
13. Are there any additional resources or data provided in the EV Charging Industry report?
While the report offers comprehensive insights, it's advisable to review the specific contents or supplementary materials provided to ascertain if additional resources or data are available.
14. How can I stay updated on further developments or reports in the EV Charging Industry?
To stay informed about further developments, trends, and reports in the EV Charging Industry, consider subscribing to industry newsletters, following relevant companies and organizations, or regularly checking reputable industry news sources and publications.
Methodology
Step 1 - Identification of Relevant Samples Size from Population Database


Step 2 - Approaches for Defining Global Market Size (Value, Volume* & Price*)

Note*: In applicable scenarios
Step 3 - Data Sources
Primary Research
- Web Analytics
- Survey Reports
- Research Institute
- Latest Research Reports
- Opinion Leaders
Secondary Research
- Annual Reports
- White Paper
- Latest Press Release
- Industry Association
- Paid Database
- Investor Presentations

Step 4 - Data Triangulation
Involves using different sources of information in order to increase the validity of a study
These sources are likely to be stakeholders in a program - participants, other researchers, program staff, other community members, and so on.
Then we put all data in single framework & apply various statistical tools to find out the dynamic on the market.
During the analysis stage, feedback from the stakeholder groups would be compared to determine areas of agreement as well as areas of divergence