

Key Insights
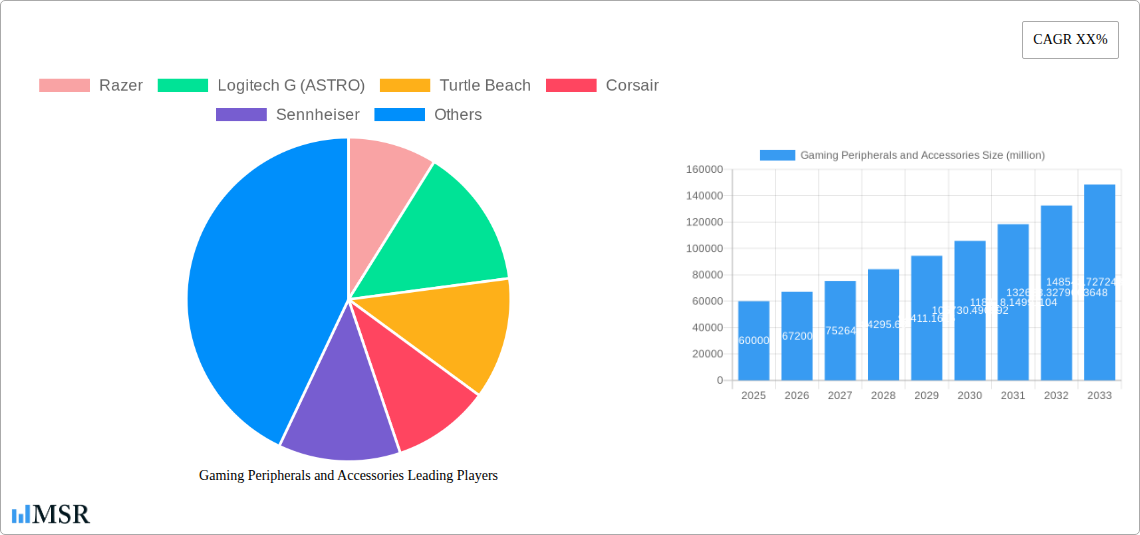
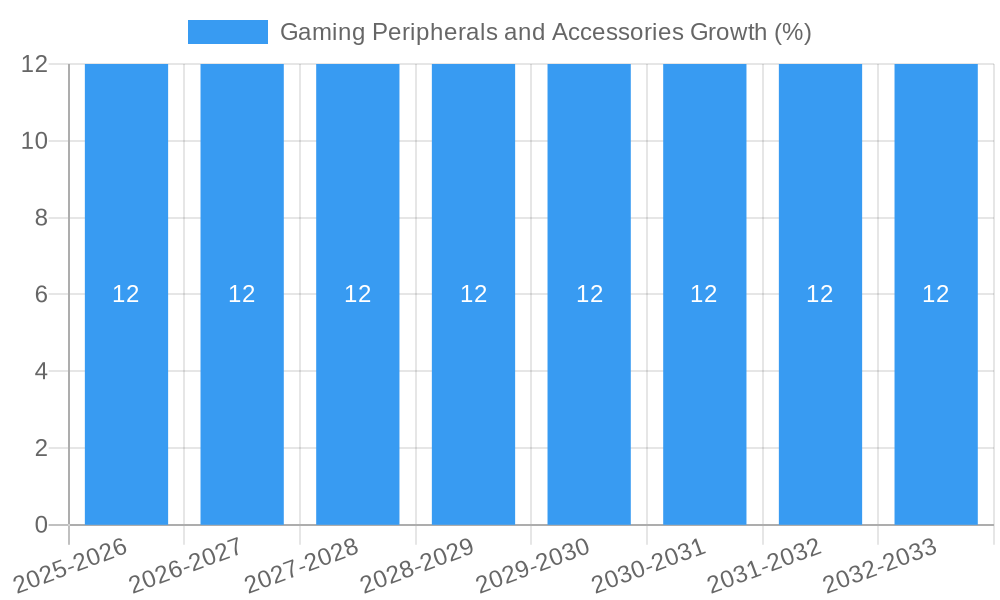
The global gaming peripherals and accessories market is experiencing robust growth, projected to reach an estimated market size of $60 billion by 2025, with a Compound Annual Growth Rate (CAGR) of 12% during the forecast period of 2025-2033. This expansion is primarily fueled by the escalating popularity of esports, the increasing accessibility of gaming across various platforms, and the continuous innovation in product design and functionality. The demand for high-performance gaming mice, responsive keyboards, immersive headsets, and precise controllers is surging as both individual players and professional esports teams seek to gain a competitive edge. Emerging markets, particularly in Asia Pacific and South America, are showing significant potential, driven by a young and tech-savvy population with a growing disposable income allocated towards gaming. Technological advancements, such as the integration of AI, personalized RGB lighting, and advanced haptic feedback, are further stimulating consumer interest and driving market value.
Despite the positive trajectory, certain restraints could temper the market's full potential. The rising cost of advanced gaming hardware can be a barrier for casual gamers, potentially limiting adoption in price-sensitive regions. Furthermore, the rapid pace of technological obsolescence necessitates frequent upgrades, creating a continuous demand but also an ongoing expense for consumers. The market is also subject to supply chain disruptions and component shortages, which can impact product availability and pricing. However, the strong underlying demand, driven by a passionate global gaming community and continuous investment from major players like Razer, Logitech G, and Corsair, is expected to drive sustained innovation and market expansion. The diverse application segments, from individual enthusiasts to professional esports organizations, coupled with a wide array of product types, ensure a broad market reach and resilience against specific segment fluctuations.
Gaming Peripherals and Accessories Market Analysis 2019-2033: Unlocking Growth in an Evolving Industry
Report Description:
Dive deep into the dynamic gaming peripherals and accessories market with our comprehensive industry report. Covering the historical period of 2019–2024 and projecting growth through 2033, this in-depth analysis provides unparalleled insights for industry stakeholders. We meticulously examine market concentration, industry dynamics, key trends, dominant segments, product innovations, challenges, growth drivers, emerging opportunities, leading players like Razer, Logitech G (ASTRO), Turtle Beach, Corsair, SteelSeries, Sony, and Microsoft, and pivotal industry milestones. With a base year of 2025 and an estimated year of 2025, our forecast period of 2025–2033 delivers actionable intelligence for strategic decision-making in the esports peripherals and PC gaming accessories sectors. Understand the evolving landscape of gaming mice, gaming keyboards, gaming headsets, gaming controllers, and other critical gamer gear.
Gaming Peripherals and Accessories Market Concentration & Dynamics
The gaming peripherals and accessories market exhibits a moderate to high concentration, with a few dominant players like Razer, Logitech G (ASTRO), and Turtle Beach commanding significant market share, estimated to be over 40% combined in the global market. The innovation ecosystem is vibrant, driven by intense competition and rapid technological advancements. Major companies continuously invest in R&D to introduce cutting-edge features such as ultra-low latency wireless technology, advanced haptics, and ergonomic designs. Regulatory frameworks are generally supportive, with a focus on consumer safety and interoperability standards. However, counterfeit products and intellectual property infringement remain persistent challenges. Substitute products, such as integrated laptop keyboards and touch controls on mobile devices, pose a limited threat to the dedicated gaming peripherals market, which caters to a distinct performance-oriented user base. End-user trends are shifting towards personalization and customization, with gamers seeking peripherals that reflect their individual style and enhance their gameplay experience. Mergers and acquisitions (M&A) activities have been notable, with strategic acquisitions aimed at expanding product portfolios and market reach. For instance, recent M&A deals in the gaming hardware space have involved companies acquiring smaller specialized accessory manufacturers to gain access to niche technologies or customer bases. The number of significant M&A deals in the past five years is estimated to be around 25, with a total disclosed deal value exceeding one billion dollars. This consolidation signifies a mature yet still expanding market where strategic partnerships and acquisitions are key to sustained growth and market dominance.
Gaming Peripherals and Accessories Industry Insights & Trends
The gaming peripherals and accessories industry is experiencing robust growth, projected to reach a global market size of approximately seventy-five billion dollars by 2025, with a Compound Annual Growth Rate (CAGR) of roughly eleven percent during the forecast period of 2025–2033. This expansion is fueled by a confluence of factors, including the escalating popularity of esports, the increasing penetration of high-performance gaming PCs and consoles, and the burgeoning mobile gaming market. Technological disruptions are at the forefront of this growth. The integration of advanced features such as ultra-responsive sensors, customizable RGB lighting, and AI-powered functionalities in gaming mice and gaming keyboards is significantly enhancing the player experience. Wireless technologies, particularly low-latency 2.4GHz and Bluetooth, are becoming standard, offering enhanced freedom of movement and convenience. In the realm of gaming headsets, innovations are focusing on immersive audio, active noise cancellation, and superior microphone quality for clear in-game communication, with top-tier models now exceeding three hundred dollars in price. The controller segment is witnessing advancements in haptic feedback, adaptive triggers, and ergonomic designs, mirroring innovations seen in console controllers but extended to PC and mobile platforms. Evolving consumer behaviors are a critical driver. The rise of professional esports players and streamers has created a demand for high-performance, durable, and aesthetically appealing gamer gear. Gamers are increasingly willing to invest in premium peripherals that offer a competitive edge and a more immersive gameplay experience. The younger demographic, with greater disposable income and a deep engagement with digital entertainment, represents a significant consumer base. Furthermore, the increasing accessibility of high-speed internet and cloud gaming services is expanding the addressable market for gaming accessories beyond traditional PC and console gamers. The proliferation of online gaming communities and social media platforms also plays a crucial role in influencing purchasing decisions through reviews, influencer recommendations, and the showcasing of high-end gaming setups. The overall market trend indicates a continuous upward trajectory, driven by innovation and a growing global gaming population. The estimated market size for gaming keyboards alone is expected to surpass ten billion dollars by 2025.
Key Markets & Segments Leading Gaming Peripherals and Accessories
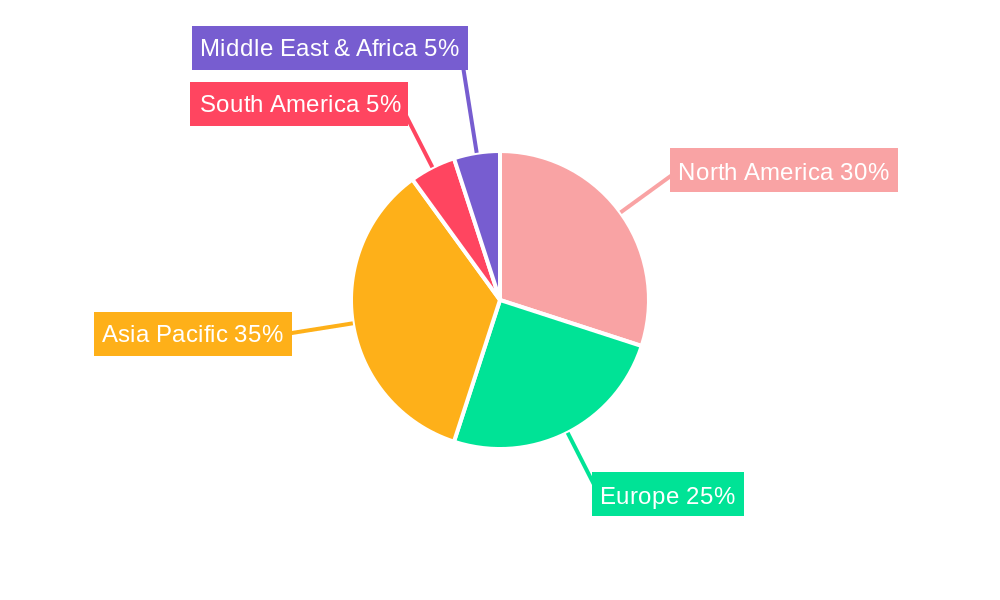
The gaming peripherals and accessories market is spearheaded by dynamic regional and segment-specific growth. Dominant regions exhibiting strong demand include North America and Asia-Pacific, with North America currently holding an estimated forty percent market share due to its mature gaming culture and high disposable incomes. Asia-Pacific, however, is the fastest-growing region, projected to achieve a CAGR of thirteen percent over the forecast period, driven by rapid economic growth, increasing internet penetration, and a massive, young population embracing gaming. Key countries within these regions, such as the United States, China, Japan, and South Korea, are significant contributors to market value, each with unique consumer preferences and gaming ecosystems.
Within the Application segment, Individual Players constitute the largest share, estimated at approximately sixty-five percent of the total market revenue, owing to the sheer volume of casual and enthusiast gamers worldwide. The Professional eSports segment, while smaller in volume, is a high-value segment with a CAGR of fifteen percent, as professional gamers and teams invest heavily in top-tier equipment for competitive advantage. The Others category, encompassing broader entertainment uses and simulation enthusiasts, represents a smaller but growing segment.
Analyzing the Types of gaming peripherals, the Headset segment is currently the largest, accounting for an estimated thirty-five percent of the market, driven by the need for immersive audio and clear communication in multiplayer games. The Gaming Mouse segment follows closely, representing twenty-eight percent of the market, with innovations in sensor technology and ergonomics driving demand. The Gaming Keyboards segment holds around twenty percent, with mechanical keyboards and customizable features being key attractions. The Controllers segment, with an estimated twelve percent market share, is experiencing resurgence due to console gaming popularity and the demand for adaptive and wireless options. The Others category, including accessories like mousepads, steering wheels, and specialized controllers, makes up the remaining five percent, but offers niche growth opportunities.
Key drivers for dominance in these segments include:
- Economic Growth & Disposable Income: Higher disposable incomes in developed and emerging economies directly correlate with increased spending on premium gaming peripherals.
- Internet Penetration & Broadband Speed: Ubiquitous high-speed internet is fundamental for online gaming, which in turn drives demand for reliable and high-performance peripherals.
- Esports Ecosystem Development: The growth of professional esports leagues, tournaments, and streaming platforms creates a continuous demand for high-performance gaming gear among professional and aspiring players.
- Console and PC Gaming Popularity: The sustained popularity of gaming consoles like PlayStation and Xbox, alongside the PC gaming platform, directly fuels the demand for their associated and compatible peripherals.
- Technological Advancements: Continuous innovation in sensor technology, wireless connectivity, audio fidelity, and ergonomic design makes newer peripherals more attractive and performance-enhancing.
- Content Availability & Gaming Library Expansion: A steady stream of new AAA game releases and a growing diversity of game genres encourage gamers to upgrade their setups.
- Social Media Influence & Streaming Culture: The visibility of high-end gaming setups on platforms like Twitch and YouTube influences consumer purchasing decisions, creating aspirational buying behavior.
Gaming Peripherals and Accessories Product Developments
Product innovation in the gaming peripherals and accessories market is characterized by a relentless pursuit of enhanced performance, superior user experience, and aesthetic appeal. Companies are increasingly integrating advanced technologies such as ultra-low latency wireless connectivity, sophisticated optical sensors with adjustable DPI settings for pinpoint accuracy in gaming mice, and high-quality mechanical switches for tactile feedback and durability in gaming keyboards. Advancements in audio technology for gaming headsets include virtual surround sound, active noise cancellation, and high-fidelity drivers for immersive soundscapes. The development of haptic feedback and adaptive triggers in gaming controllers further deepens player immersion. These innovations are driven by a competitive landscape where companies like Razer, Logitech G (ASTRO), and SteelSeries strive to offer differentiated products that provide a tangible competitive edge for individual players and professional esports athletes alike, pushing the boundaries of what's possible in gamer gear.
Challenges in the Gaming Peripherals and Accessories Market
The gaming peripherals and accessories market faces several significant challenges. Supply chain disruptions, exacerbated by global events, can lead to component shortages and increased manufacturing costs, impacting product availability and pricing. Intense competition among numerous players, including established giants and emerging brands, creates price pressures and necessitates substantial investment in marketing and R&D. The rapid pace of technological evolution means that products can become obsolete quickly, requiring continuous innovation and investment. Regulatory hurdles related to electronic waste disposal and material sourcing also pose a challenge, requiring adherence to evolving environmental standards. For example, the cost of sourcing specialized semiconductors has seen an increase of approximately fifteen percent over the past two years. Furthermore, the high cost of premium gaming peripherals can be a barrier for entry-level consumers, limiting market penetration in price-sensitive regions.
Forces Driving Gaming Peripherals and Accessories Growth
The growth of the gaming peripherals and accessories market is propelled by several powerful forces. The increasing global adoption of high-speed internet and the proliferation of smartphones and gaming consoles have significantly expanded the addressable market. The burgeoning popularity of esports as a professional career path and spectator sport fuels demand for high-performance equipment. Technological advancements in processing power, graphics capabilities, and display resolutions enable more immersive gaming experiences, directly translating into a need for advanced peripherals that can keep pace. Economic development in emerging markets is also a key driver, as a growing middle class with increasing disposable income turns to gaming as a primary form of entertainment. The ongoing innovation in product design and functionality, such as personalized RGB lighting and customizable button layouts, caters to the demand for unique and personalized gaming setups.
Challenges in the Gaming Peripherals and Accessories Market
Long-term growth catalysts for the gaming peripherals and accessories market are deeply rooted in continuous technological innovation and strategic market expansion. The ongoing development of virtual reality (VR) and augmented reality (AR) technologies presents a significant opportunity for the creation of entirely new categories of immersive gaming peripherals and accessories. Partnerships between peripheral manufacturers and game developers, aimed at creating hardware optimized for specific game titles, will foster deeper player engagement and drive sales. Furthermore, the expansion of cloud gaming services, reducing the reliance on expensive local hardware, may shift consumer spending towards software and enhanced peripheral experiences that complement these platforms. The increasing professionalization of gaming, with more formal leagues and collegiate programs, will solidify the demand for high-quality, durable, and ergonomically designed equipment.
Emerging Opportunities in Gaming Peripherals and Accessories
Emerging opportunities in the gaming peripherals and accessories market are diverse and promising. The growing popularity of mobile gaming, particularly in emerging economies, presents a vast untapped market for mobile-specific gaming accessories like dedicated controllers, cooling fans, and enhanced grip accessories. The increasing demand for ergonomic and health-conscious gaming setups opens avenues for products designed to reduce strain and improve comfort during long gaming sessions. The integration of AI and machine learning into peripherals, offering features like adaptive gameplay adjustments and personalized performance feedback, represents a significant technological frontier. Furthermore, the ongoing trend of PC customization and aesthetic personalization, driven by content creators and enthusiasts, fuels demand for visually appealing and highly customizable components like RGB lighting solutions and unique accessory designs. The development of peripherals tailored for specific niche gaming genres, such as flight simulators or racing games, also offers significant growth potential.
Leading Players in the Gaming Peripherals and Accessories Sector
- Razer
- Logitech G (ASTRO)
- Turtle Beach
- Corsair
- Sennheiser
- Plantronics
- SteelSeries
- Sony
- Samsung
- Mad Catz
- ROCCAT
- QPAD
- Thrustmaster
- HyperX
- Tt eSPORTS
- Cooler Master
- ZOWIE
- Sharkoon
- Trust
- Microsoft
- Genius (KYE Systems Corp)
- HP
- A4TECH
- Shenzhen Rapoo Technology
- Mionix
- COUGAR
Key Milestones in Gaming Peripherals and Accessories Industry
- 2019: Razer launches the Viper Ultimate wireless gaming mouse, setting a new benchmark for wireless performance.
- 2020: Logitech acquires ASTRO Gaming, significantly strengthening its position in the premium gaming headset market.
- 2020: Turtle Beach introduces the Stealth 700 Gen 2 headset, receiving widespread critical acclaim for its audio quality and features.
- 2021: Corsair acquires SCUF Gaming, expanding its reach into the high-performance controller market.
- 2021: SteelSeries launches the Apex Pro line of keyboards, featuring adjustable actuation switches.
- 2022: Sony releases the DualSense Edge wireless controller for PlayStation 5, offering advanced customization options.
- 2022: HyperX introduces the Pulsefire Haste wireless gaming mouse, focusing on lightweight design and performance.
- 2023: The increasing prevalence of AI-powered features in gaming mice, offering intelligent aim assist and recoil management.
- 2023: Significant growth in the demand for ergonomic gaming accessories, addressing gamer health concerns.
- 2024: The market sees a surge in demand for sustainable and eco-friendly gaming peripherals.
Strategic Outlook for Gaming Peripherals and Accessories Market
The strategic outlook for the gaming peripherals and accessories market is exceptionally strong, driven by sustained innovation and an ever-expanding global gaming community. Future growth will be accelerated by the continued integration of advanced technologies like AI, haptics, and ultra-low latency wireless solutions, catering to the increasing demand for immersive and responsive gameplay. Strategic partnerships between peripheral manufacturers and leading game developers will create exclusive hardware-software synergies, driving sales and enhancing user engagement. The growing influence of esports and the creator economy will continue to fuel demand for premium, high-performance gear. Furthermore, the expansion into emerging markets and the development of accessories for evolving platforms like VR/AR and mobile gaming present significant untapped potential. Companies that focus on delivering exceptional performance, customization, and user experience will be well-positioned to capture substantial market share in this dynamic and lucrative industry. The market is projected to exceed one hundred billion dollars by 2030.
Gaming Peripherals and Accessories Segmentation
-
1. Application
- 1.1. Individual Players
- 1.2. Professional eSports
- 1.3. Others
-
2. Types
- 2.1. Gaming Mouse
- 2.2. Gaming Keyboards
- 2.3. Headset
- 2.4. Controllers
- 2.5. Others
Gaming Peripherals and Accessories Segmentation By Geography
-
1. North America
- 1.1. United States
- 1.2. Canada
- 1.3. Mexico
-
2. South America
- 2.1. Brazil
- 2.2. Argentina
- 2.3. Rest of South America
-
3. Europe
- 3.1. United Kingdom
- 3.2. Germany
- 3.3. France
- 3.4. Italy
- 3.5. Spain
- 3.6. Russia
- 3.7. Benelux
- 3.8. Nordics
- 3.9. Rest of Europe
-
4. Middle East & Africa
- 4.1. Turkey
- 4.2. Israel
- 4.3. GCC
- 4.4. North Africa
- 4.5. South Africa
- 4.6. Rest of Middle East & Africa
-
5. Asia Pacific
- 5.1. China
- 5.2. India
- 5.3. Japan
- 5.4. South Korea
- 5.5. ASEAN
- 5.6. Oceania
- 5.7. Rest of Asia Pacific
Gaming Peripherals and Accessories REPORT HIGHLIGHTS
| Aspects | Details |
|---|---|
| Study Period | 2019-2033 |
| Base Year | 2024 |
| Estimated Year | 2025 |
| Forecast Period | 2025-2033 |
| Historical Period | 2019-2024 |
| Growth Rate | CAGR of XX% from 2019-2033 |
| Segmentation |
|
Table of Contents
- 1. Introduction
- 1.1. Research Scope
- 1.2. Market Segmentation
- 1.3. Research Methodology
- 1.4. Definitions and Assumptions
- 2. Executive Summary
- 2.1. Introduction
- 3. Market Dynamics
- 3.1. Introduction
- 3.2. Market Drivers
- 3.3. Market Restrains
- 3.4. Market Trends
- 4. Market Factor Analysis
- 4.1. Porters Five Forces
- 4.2. Supply/Value Chain
- 4.3. PESTEL analysis
- 4.4. Market Entropy
- 4.5. Patent/Trademark Analysis
- 5. Global Gaming Peripherals and Accessories Analysis, Insights and Forecast, 2019-2031
- 5.1. Market Analysis, Insights and Forecast - by Application
- 5.1.1. Individual Players
- 5.1.2. Professional eSports
- 5.1.3. Others
- 5.2. Market Analysis, Insights and Forecast - by Types
- 5.2.1. Gaming Mouse
- 5.2.2. Gaming Keyboards
- 5.2.3. Headset
- 5.2.4. Controllers
- 5.2.5. Others
- 5.3. Market Analysis, Insights and Forecast - by Region
- 5.3.1. North America
- 5.3.2. South America
- 5.3.3. Europe
- 5.3.4. Middle East & Africa
- 5.3.5. Asia Pacific
- 5.1. Market Analysis, Insights and Forecast - by Application
- 6. North America Gaming Peripherals and Accessories Analysis, Insights and Forecast, 2019-2031
- 6.1. Market Analysis, Insights and Forecast - by Application
- 6.1.1. Individual Players
- 6.1.2. Professional eSports
- 6.1.3. Others
- 6.2. Market Analysis, Insights and Forecast - by Types
- 6.2.1. Gaming Mouse
- 6.2.2. Gaming Keyboards
- 6.2.3. Headset
- 6.2.4. Controllers
- 6.2.5. Others
- 6.1. Market Analysis, Insights and Forecast - by Application
- 7. South America Gaming Peripherals and Accessories Analysis, Insights and Forecast, 2019-2031
- 7.1. Market Analysis, Insights and Forecast - by Application
- 7.1.1. Individual Players
- 7.1.2. Professional eSports
- 7.1.3. Others
- 7.2. Market Analysis, Insights and Forecast - by Types
- 7.2.1. Gaming Mouse
- 7.2.2. Gaming Keyboards
- 7.2.3. Headset
- 7.2.4. Controllers
- 7.2.5. Others
- 7.1. Market Analysis, Insights and Forecast - by Application
- 8. Europe Gaming Peripherals and Accessories Analysis, Insights and Forecast, 2019-2031
- 8.1. Market Analysis, Insights and Forecast - by Application
- 8.1.1. Individual Players
- 8.1.2. Professional eSports
- 8.1.3. Others
- 8.2. Market Analysis, Insights and Forecast - by Types
- 8.2.1. Gaming Mouse
- 8.2.2. Gaming Keyboards
- 8.2.3. Headset
- 8.2.4. Controllers
- 8.2.5. Others
- 8.1. Market Analysis, Insights and Forecast - by Application
- 9. Middle East & Africa Gaming Peripherals and Accessories Analysis, Insights and Forecast, 2019-2031
- 9.1. Market Analysis, Insights and Forecast - by Application
- 9.1.1. Individual Players
- 9.1.2. Professional eSports
- 9.1.3. Others
- 9.2. Market Analysis, Insights and Forecast - by Types
- 9.2.1. Gaming Mouse
- 9.2.2. Gaming Keyboards
- 9.2.3. Headset
- 9.2.4. Controllers
- 9.2.5. Others
- 9.1. Market Analysis, Insights and Forecast - by Application
- 10. Asia Pacific Gaming Peripherals and Accessories Analysis, Insights and Forecast, 2019-2031
- 10.1. Market Analysis, Insights and Forecast - by Application
- 10.1.1. Individual Players
- 10.1.2. Professional eSports
- 10.1.3. Others
- 10.2. Market Analysis, Insights and Forecast - by Types
- 10.2.1. Gaming Mouse
- 10.2.2. Gaming Keyboards
- 10.2.3. Headset
- 10.2.4. Controllers
- 10.2.5. Others
- 10.1. Market Analysis, Insights and Forecast - by Application
- 11. Competitive Analysis
- 11.1. Global Market Share Analysis 2024
- 11.2. Company Profiles
- 11.2.1 Razer
- 11.2.1.1. Overview
- 11.2.1.2. Products
- 11.2.1.3. SWOT Analysis
- 11.2.1.4. Recent Developments
- 11.2.1.5. Financials (Based on Availability)
- 11.2.2 Logitech G (ASTRO)
- 11.2.2.1. Overview
- 11.2.2.2. Products
- 11.2.2.3. SWOT Analysis
- 11.2.2.4. Recent Developments
- 11.2.2.5. Financials (Based on Availability)
- 11.2.3 Turtle Beach
- 11.2.3.1. Overview
- 11.2.3.2. Products
- 11.2.3.3. SWOT Analysis
- 11.2.3.4. Recent Developments
- 11.2.3.5. Financials (Based on Availability)
- 11.2.4 Corsair
- 11.2.4.1. Overview
- 11.2.4.2. Products
- 11.2.4.3. SWOT Analysis
- 11.2.4.4. Recent Developments
- 11.2.4.5. Financials (Based on Availability)
- 11.2.5 Sennheiser
- 11.2.5.1. Overview
- 11.2.5.2. Products
- 11.2.5.3. SWOT Analysis
- 11.2.5.4. Recent Developments
- 11.2.5.5. Financials (Based on Availability)
- 11.2.6 Plantronics
- 11.2.6.1. Overview
- 11.2.6.2. Products
- 11.2.6.3. SWOT Analysis
- 11.2.6.4. Recent Developments
- 11.2.6.5. Financials (Based on Availability)
- 11.2.7 SteelSeries
- 11.2.7.1. Overview
- 11.2.7.2. Products
- 11.2.7.3. SWOT Analysis
- 11.2.7.4. Recent Developments
- 11.2.7.5. Financials (Based on Availability)
- 11.2.8 Sony
- 11.2.8.1. Overview
- 11.2.8.2. Products
- 11.2.8.3. SWOT Analysis
- 11.2.8.4. Recent Developments
- 11.2.8.5. Financials (Based on Availability)
- 11.2.9 Samsung
- 11.2.9.1. Overview
- 11.2.9.2. Products
- 11.2.9.3. SWOT Analysis
- 11.2.9.4. Recent Developments
- 11.2.9.5. Financials (Based on Availability)
- 11.2.10 Mad Catz
- 11.2.10.1. Overview
- 11.2.10.2. Products
- 11.2.10.3. SWOT Analysis
- 11.2.10.4. Recent Developments
- 11.2.10.5. Financials (Based on Availability)
- 11.2.11 ROCCAT
- 11.2.11.1. Overview
- 11.2.11.2. Products
- 11.2.11.3. SWOT Analysis
- 11.2.11.4. Recent Developments
- 11.2.11.5. Financials (Based on Availability)
- 11.2.12 QPAD
- 11.2.12.1. Overview
- 11.2.12.2. Products
- 11.2.12.3. SWOT Analysis
- 11.2.12.4. Recent Developments
- 11.2.12.5. Financials (Based on Availability)
- 11.2.13 Thrustmaster
- 11.2.13.1. Overview
- 11.2.13.2. Products
- 11.2.13.3. SWOT Analysis
- 11.2.13.4. Recent Developments
- 11.2.13.5. Financials (Based on Availability)
- 11.2.14 HyperX
- 11.2.14.1. Overview
- 11.2.14.2. Products
- 11.2.14.3. SWOT Analysis
- 11.2.14.4. Recent Developments
- 11.2.14.5. Financials (Based on Availability)
- 11.2.15 Tt eSPORTS
- 11.2.15.1. Overview
- 11.2.15.2. Products
- 11.2.15.3. SWOT Analysis
- 11.2.15.4. Recent Developments
- 11.2.15.5. Financials (Based on Availability)
- 11.2.16 Cooler Master
- 11.2.16.1. Overview
- 11.2.16.2. Products
- 11.2.16.3. SWOT Analysis
- 11.2.16.4. Recent Developments
- 11.2.16.5. Financials (Based on Availability)
- 11.2.17 ZOWIE
- 11.2.17.1. Overview
- 11.2.17.2. Products
- 11.2.17.3. SWOT Analysis
- 11.2.17.4. Recent Developments
- 11.2.17.5. Financials (Based on Availability)
- 11.2.18 Sharkoon
- 11.2.18.1. Overview
- 11.2.18.2. Products
- 11.2.18.3. SWOT Analysis
- 11.2.18.4. Recent Developments
- 11.2.18.5. Financials (Based on Availability)
- 11.2.19 Trust
- 11.2.19.1. Overview
- 11.2.19.2. Products
- 11.2.19.3. SWOT Analysis
- 11.2.19.4. Recent Developments
- 11.2.19.5. Financials (Based on Availability)
- 11.2.20 Microsoft
- 11.2.20.1. Overview
- 11.2.20.2. Products
- 11.2.20.3. SWOT Analysis
- 11.2.20.4. Recent Developments
- 11.2.20.5. Financials (Based on Availability)
- 11.2.21 Genius(KYE Systems Corp)
- 11.2.21.1. Overview
- 11.2.21.2. Products
- 11.2.21.3. SWOT Analysis
- 11.2.21.4. Recent Developments
- 11.2.21.5. Financials (Based on Availability)
- 11.2.22 HP
- 11.2.22.1. Overview
- 11.2.22.2. Products
- 11.2.22.3. SWOT Analysis
- 11.2.22.4. Recent Developments
- 11.2.22.5. Financials (Based on Availability)
- 11.2.23 A4TECH
- 11.2.23.1. Overview
- 11.2.23.2. Products
- 11.2.23.3. SWOT Analysis
- 11.2.23.4. Recent Developments
- 11.2.23.5. Financials (Based on Availability)
- 11.2.24 Shenzhen Rapoo Technology
- 11.2.24.1. Overview
- 11.2.24.2. Products
- 11.2.24.3. SWOT Analysis
- 11.2.24.4. Recent Developments
- 11.2.24.5. Financials (Based on Availability)
- 11.2.25 Mionix
- 11.2.25.1. Overview
- 11.2.25.2. Products
- 11.2.25.3. SWOT Analysis
- 11.2.25.4. Recent Developments
- 11.2.25.5. Financials (Based on Availability)
- 11.2.26 COUGAR
- 11.2.26.1. Overview
- 11.2.26.2. Products
- 11.2.26.3. SWOT Analysis
- 11.2.26.4. Recent Developments
- 11.2.26.5. Financials (Based on Availability)
- 11.2.1 Razer
List of Figures
- Figure 1: Global Gaming Peripherals and Accessories Revenue Breakdown (million, %) by Region 2024 & 2032
- Figure 2: Global Gaming Peripherals and Accessories Volume Breakdown (K, %) by Region 2024 & 2032
- Figure 3: North America Gaming Peripherals and Accessories Revenue (million), by Application 2024 & 2032
- Figure 4: North America Gaming Peripherals and Accessories Volume (K), by Application 2024 & 2032
- Figure 5: North America Gaming Peripherals and Accessories Revenue Share (%), by Application 2024 & 2032
- Figure 6: North America Gaming Peripherals and Accessories Volume Share (%), by Application 2024 & 2032
- Figure 7: North America Gaming Peripherals and Accessories Revenue (million), by Types 2024 & 2032
- Figure 8: North America Gaming Peripherals and Accessories Volume (K), by Types 2024 & 2032
- Figure 9: North America Gaming Peripherals and Accessories Revenue Share (%), by Types 2024 & 2032
- Figure 10: North America Gaming Peripherals and Accessories Volume Share (%), by Types 2024 & 2032
- Figure 11: North America Gaming Peripherals and Accessories Revenue (million), by Country 2024 & 2032
- Figure 12: North America Gaming Peripherals and Accessories Volume (K), by Country 2024 & 2032
- Figure 13: North America Gaming Peripherals and Accessories Revenue Share (%), by Country 2024 & 2032
- Figure 14: North America Gaming Peripherals and Accessories Volume Share (%), by Country 2024 & 2032
- Figure 15: South America Gaming Peripherals and Accessories Revenue (million), by Application 2024 & 2032
- Figure 16: South America Gaming Peripherals and Accessories Volume (K), by Application 2024 & 2032
- Figure 17: South America Gaming Peripherals and Accessories Revenue Share (%), by Application 2024 & 2032
- Figure 18: South America Gaming Peripherals and Accessories Volume Share (%), by Application 2024 & 2032
- Figure 19: South America Gaming Peripherals and Accessories Revenue (million), by Types 2024 & 2032
- Figure 20: South America Gaming Peripherals and Accessories Volume (K), by Types 2024 & 2032
- Figure 21: South America Gaming Peripherals and Accessories Revenue Share (%), by Types 2024 & 2032
- Figure 22: South America Gaming Peripherals and Accessories Volume Share (%), by Types 2024 & 2032
- Figure 23: South America Gaming Peripherals and Accessories Revenue (million), by Country 2024 & 2032
- Figure 24: South America Gaming Peripherals and Accessories Volume (K), by Country 2024 & 2032
- Figure 25: South America Gaming Peripherals and Accessories Revenue Share (%), by Country 2024 & 2032
- Figure 26: South America Gaming Peripherals and Accessories Volume Share (%), by Country 2024 & 2032
- Figure 27: Europe Gaming Peripherals and Accessories Revenue (million), by Application 2024 & 2032
- Figure 28: Europe Gaming Peripherals and Accessories Volume (K), by Application 2024 & 2032
- Figure 29: Europe Gaming Peripherals and Accessories Revenue Share (%), by Application 2024 & 2032
- Figure 30: Europe Gaming Peripherals and Accessories Volume Share (%), by Application 2024 & 2032
- Figure 31: Europe Gaming Peripherals and Accessories Revenue (million), by Types 2024 & 2032
- Figure 32: Europe Gaming Peripherals and Accessories Volume (K), by Types 2024 & 2032
- Figure 33: Europe Gaming Peripherals and Accessories Revenue Share (%), by Types 2024 & 2032
- Figure 34: Europe Gaming Peripherals and Accessories Volume Share (%), by Types 2024 & 2032
- Figure 35: Europe Gaming Peripherals and Accessories Revenue (million), by Country 2024 & 2032
- Figure 36: Europe Gaming Peripherals and Accessories Volume (K), by Country 2024 & 2032
- Figure 37: Europe Gaming Peripherals and Accessories Revenue Share (%), by Country 2024 & 2032
- Figure 38: Europe Gaming Peripherals and Accessories Volume Share (%), by Country 2024 & 2032
- Figure 39: Middle East & Africa Gaming Peripherals and Accessories Revenue (million), by Application 2024 & 2032
- Figure 40: Middle East & Africa Gaming Peripherals and Accessories Volume (K), by Application 2024 & 2032
- Figure 41: Middle East & Africa Gaming Peripherals and Accessories Revenue Share (%), by Application 2024 & 2032
- Figure 42: Middle East & Africa Gaming Peripherals and Accessories Volume Share (%), by Application 2024 & 2032
- Figure 43: Middle East & Africa Gaming Peripherals and Accessories Revenue (million), by Types 2024 & 2032
- Figure 44: Middle East & Africa Gaming Peripherals and Accessories Volume (K), by Types 2024 & 2032
- Figure 45: Middle East & Africa Gaming Peripherals and Accessories Revenue Share (%), by Types 2024 & 2032
- Figure 46: Middle East & Africa Gaming Peripherals and Accessories Volume Share (%), by Types 2024 & 2032
- Figure 47: Middle East & Africa Gaming Peripherals and Accessories Revenue (million), by Country 2024 & 2032
- Figure 48: Middle East & Africa Gaming Peripherals and Accessories Volume (K), by Country 2024 & 2032
- Figure 49: Middle East & Africa Gaming Peripherals and Accessories Revenue Share (%), by Country 2024 & 2032
- Figure 50: Middle East & Africa Gaming Peripherals and Accessories Volume Share (%), by Country 2024 & 2032
- Figure 51: Asia Pacific Gaming Peripherals and Accessories Revenue (million), by Application 2024 & 2032
- Figure 52: Asia Pacific Gaming Peripherals and Accessories Volume (K), by Application 2024 & 2032
- Figure 53: Asia Pacific Gaming Peripherals and Accessories Revenue Share (%), by Application 2024 & 2032
- Figure 54: Asia Pacific Gaming Peripherals and Accessories Volume Share (%), by Application 2024 & 2032
- Figure 55: Asia Pacific Gaming Peripherals and Accessories Revenue (million), by Types 2024 & 2032
- Figure 56: Asia Pacific Gaming Peripherals and Accessories Volume (K), by Types 2024 & 2032
- Figure 57: Asia Pacific Gaming Peripherals and Accessories Revenue Share (%), by Types 2024 & 2032
- Figure 58: Asia Pacific Gaming Peripherals and Accessories Volume Share (%), by Types 2024 & 2032
- Figure 59: Asia Pacific Gaming Peripherals and Accessories Revenue (million), by Country 2024 & 2032
- Figure 60: Asia Pacific Gaming Peripherals and Accessories Volume (K), by Country 2024 & 2032
- Figure 61: Asia Pacific Gaming Peripherals and Accessories Revenue Share (%), by Country 2024 & 2032
- Figure 62: Asia Pacific Gaming Peripherals and Accessories Volume Share (%), by Country 2024 & 2032
List of Tables
- Table 1: Global Gaming Peripherals and Accessories Revenue million Forecast, by Region 2019 & 2032
- Table 2: Global Gaming Peripherals and Accessories Volume K Forecast, by Region 2019 & 2032
- Table 3: Global Gaming Peripherals and Accessories Revenue million Forecast, by Application 2019 & 2032
- Table 4: Global Gaming Peripherals and Accessories Volume K Forecast, by Application 2019 & 2032
- Table 5: Global Gaming Peripherals and Accessories Revenue million Forecast, by Types 2019 & 2032
- Table 6: Global Gaming Peripherals and Accessories Volume K Forecast, by Types 2019 & 2032
- Table 7: Global Gaming Peripherals and Accessories Revenue million Forecast, by Region 2019 & 2032
- Table 8: Global Gaming Peripherals and Accessories Volume K Forecast, by Region 2019 & 2032
- Table 9: Global Gaming Peripherals and Accessories Revenue million Forecast, by Application 2019 & 2032
- Table 10: Global Gaming Peripherals and Accessories Volume K Forecast, by Application 2019 & 2032
- Table 11: Global Gaming Peripherals and Accessories Revenue million Forecast, by Types 2019 & 2032
- Table 12: Global Gaming Peripherals and Accessories Volume K Forecast, by Types 2019 & 2032
- Table 13: Global Gaming Peripherals and Accessories Revenue million Forecast, by Country 2019 & 2032
- Table 14: Global Gaming Peripherals and Accessories Volume K Forecast, by Country 2019 & 2032
- Table 15: United States Gaming Peripherals and Accessories Revenue (million) Forecast, by Application 2019 & 2032
- Table 16: United States Gaming Peripherals and Accessories Volume (K) Forecast, by Application 2019 & 2032
- Table 17: Canada Gaming Peripherals and Accessories Revenue (million) Forecast, by Application 2019 & 2032
- Table 18: Canada Gaming Peripherals and Accessories Volume (K) Forecast, by Application 2019 & 2032
- Table 19: Mexico Gaming Peripherals and Accessories Revenue (million) Forecast, by Application 2019 & 2032
- Table 20: Mexico Gaming Peripherals and Accessories Volume (K) Forecast, by Application 2019 & 2032
- Table 21: Global Gaming Peripherals and Accessories Revenue million Forecast, by Application 2019 & 2032
- Table 22: Global Gaming Peripherals and Accessories Volume K Forecast, by Application 2019 & 2032
- Table 23: Global Gaming Peripherals and Accessories Revenue million Forecast, by Types 2019 & 2032
- Table 24: Global Gaming Peripherals and Accessories Volume K Forecast, by Types 2019 & 2032
- Table 25: Global Gaming Peripherals and Accessories Revenue million Forecast, by Country 2019 & 2032
- Table 26: Global Gaming Peripherals and Accessories Volume K Forecast, by Country 2019 & 2032
- Table 27: Brazil Gaming Peripherals and Accessories Revenue (million) Forecast, by Application 2019 & 2032
- Table 28: Brazil Gaming Peripherals and Accessories Volume (K) Forecast, by Application 2019 & 2032
- Table 29: Argentina Gaming Peripherals and Accessories Revenue (million) Forecast, by Application 2019 & 2032
- Table 30: Argentina Gaming Peripherals and Accessories Volume (K) Forecast, by Application 2019 & 2032
- Table 31: Rest of South America Gaming Peripherals and Accessories Revenue (million) Forecast, by Application 2019 & 2032
- Table 32: Rest of South America Gaming Peripherals and Accessories Volume (K) Forecast, by Application 2019 & 2032
- Table 33: Global Gaming Peripherals and Accessories Revenue million Forecast, by Application 2019 & 2032
- Table 34: Global Gaming Peripherals and Accessories Volume K Forecast, by Application 2019 & 2032
- Table 35: Global Gaming Peripherals and Accessories Revenue million Forecast, by Types 2019 & 2032
- Table 36: Global Gaming Peripherals and Accessories Volume K Forecast, by Types 2019 & 2032
- Table 37: Global Gaming Peripherals and Accessories Revenue million Forecast, by Country 2019 & 2032
- Table 38: Global Gaming Peripherals and Accessories Volume K Forecast, by Country 2019 & 2032
- Table 39: United Kingdom Gaming Peripherals and Accessories Revenue (million) Forecast, by Application 2019 & 2032
- Table 40: United Kingdom Gaming Peripherals and Accessories Volume (K) Forecast, by Application 2019 & 2032
- Table 41: Germany Gaming Peripherals and Accessories Revenue (million) Forecast, by Application 2019 & 2032
- Table 42: Germany Gaming Peripherals and Accessories Volume (K) Forecast, by Application 2019 & 2032
- Table 43: France Gaming Peripherals and Accessories Revenue (million) Forecast, by Application 2019 & 2032
- Table 44: France Gaming Peripherals and Accessories Volume (K) Forecast, by Application 2019 & 2032
- Table 45: Italy Gaming Peripherals and Accessories Revenue (million) Forecast, by Application 2019 & 2032
- Table 46: Italy Gaming Peripherals and Accessories Volume (K) Forecast, by Application 2019 & 2032
- Table 47: Spain Gaming Peripherals and Accessories Revenue (million) Forecast, by Application 2019 & 2032
- Table 48: Spain Gaming Peripherals and Accessories Volume (K) Forecast, by Application 2019 & 2032
- Table 49: Russia Gaming Peripherals and Accessories Revenue (million) Forecast, by Application 2019 & 2032
- Table 50: Russia Gaming Peripherals and Accessories Volume (K) Forecast, by Application 2019 & 2032
- Table 51: Benelux Gaming Peripherals and Accessories Revenue (million) Forecast, by Application 2019 & 2032
- Table 52: Benelux Gaming Peripherals and Accessories Volume (K) Forecast, by Application 2019 & 2032
- Table 53: Nordics Gaming Peripherals and Accessories Revenue (million) Forecast, by Application 2019 & 2032
- Table 54: Nordics Gaming Peripherals and Accessories Volume (K) Forecast, by Application 2019 & 2032
- Table 55: Rest of Europe Gaming Peripherals and Accessories Revenue (million) Forecast, by Application 2019 & 2032
- Table 56: Rest of Europe Gaming Peripherals and Accessories Volume (K) Forecast, by Application 2019 & 2032
- Table 57: Global Gaming Peripherals and Accessories Revenue million Forecast, by Application 2019 & 2032
- Table 58: Global Gaming Peripherals and Accessories Volume K Forecast, by Application 2019 & 2032
- Table 59: Global Gaming Peripherals and Accessories Revenue million Forecast, by Types 2019 & 2032
- Table 60: Global Gaming Peripherals and Accessories Volume K Forecast, by Types 2019 & 2032
- Table 61: Global Gaming Peripherals and Accessories Revenue million Forecast, by Country 2019 & 2032
- Table 62: Global Gaming Peripherals and Accessories Volume K Forecast, by Country 2019 & 2032
- Table 63: Turkey Gaming Peripherals and Accessories Revenue (million) Forecast, by Application 2019 & 2032
- Table 64: Turkey Gaming Peripherals and Accessories Volume (K) Forecast, by Application 2019 & 2032
- Table 65: Israel Gaming Peripherals and Accessories Revenue (million) Forecast, by Application 2019 & 2032
- Table 66: Israel Gaming Peripherals and Accessories Volume (K) Forecast, by Application 2019 & 2032
- Table 67: GCC Gaming Peripherals and Accessories Revenue (million) Forecast, by Application 2019 & 2032
- Table 68: GCC Gaming Peripherals and Accessories Volume (K) Forecast, by Application 2019 & 2032
- Table 69: North Africa Gaming Peripherals and Accessories Revenue (million) Forecast, by Application 2019 & 2032
- Table 70: North Africa Gaming Peripherals and Accessories Volume (K) Forecast, by Application 2019 & 2032
- Table 71: South Africa Gaming Peripherals and Accessories Revenue (million) Forecast, by Application 2019 & 2032
- Table 72: South Africa Gaming Peripherals and Accessories Volume (K) Forecast, by Application 2019 & 2032
- Table 73: Rest of Middle East & Africa Gaming Peripherals and Accessories Revenue (million) Forecast, by Application 2019 & 2032
- Table 74: Rest of Middle East & Africa Gaming Peripherals and Accessories Volume (K) Forecast, by Application 2019 & 2032
- Table 75: Global Gaming Peripherals and Accessories Revenue million Forecast, by Application 2019 & 2032
- Table 76: Global Gaming Peripherals and Accessories Volume K Forecast, by Application 2019 & 2032
- Table 77: Global Gaming Peripherals and Accessories Revenue million Forecast, by Types 2019 & 2032
- Table 78: Global Gaming Peripherals and Accessories Volume K Forecast, by Types 2019 & 2032
- Table 79: Global Gaming Peripherals and Accessories Revenue million Forecast, by Country 2019 & 2032
- Table 80: Global Gaming Peripherals and Accessories Volume K Forecast, by Country 2019 & 2032
- Table 81: China Gaming Peripherals and Accessories Revenue (million) Forecast, by Application 2019 & 2032
- Table 82: China Gaming Peripherals and Accessories Volume (K) Forecast, by Application 2019 & 2032
- Table 83: India Gaming Peripherals and Accessories Revenue (million) Forecast, by Application 2019 & 2032
- Table 84: India Gaming Peripherals and Accessories Volume (K) Forecast, by Application 2019 & 2032
- Table 85: Japan Gaming Peripherals and Accessories Revenue (million) Forecast, by Application 2019 & 2032
- Table 86: Japan Gaming Peripherals and Accessories Volume (K) Forecast, by Application 2019 & 2032
- Table 87: South Korea Gaming Peripherals and Accessories Revenue (million) Forecast, by Application 2019 & 2032
- Table 88: South Korea Gaming Peripherals and Accessories Volume (K) Forecast, by Application 2019 & 2032
- Table 89: ASEAN Gaming Peripherals and Accessories Revenue (million) Forecast, by Application 2019 & 2032
- Table 90: ASEAN Gaming Peripherals and Accessories Volume (K) Forecast, by Application 2019 & 2032
- Table 91: Oceania Gaming Peripherals and Accessories Revenue (million) Forecast, by Application 2019 & 2032
- Table 92: Oceania Gaming Peripherals and Accessories Volume (K) Forecast, by Application 2019 & 2032
- Table 93: Rest of Asia Pacific Gaming Peripherals and Accessories Revenue (million) Forecast, by Application 2019 & 2032
- Table 94: Rest of Asia Pacific Gaming Peripherals and Accessories Volume (K) Forecast, by Application 2019 & 2032
Frequently Asked Questions
1. What is the projected Compound Annual Growth Rate (CAGR) of the Gaming Peripherals and Accessories?
The projected CAGR is approximately XX%.
2. Which companies are prominent players in the Gaming Peripherals and Accessories?
Key companies in the market include Razer, Logitech G (ASTRO), Turtle Beach, Corsair, Sennheiser, Plantronics, SteelSeries, Sony, Samsung, Mad Catz, ROCCAT, QPAD, Thrustmaster, HyperX, Tt eSPORTS, Cooler Master, ZOWIE, Sharkoon, Trust, Microsoft, Genius(KYE Systems Corp), HP, A4TECH, Shenzhen Rapoo Technology, Mionix, COUGAR.
3. What are the main segments of the Gaming Peripherals and Accessories?
The market segments include Application, Types.
4. Can you provide details about the market size?
The market size is estimated to be USD XXX million as of 2022.
5. What are some drivers contributing to market growth?
N/A
6. What are the notable trends driving market growth?
N/A
7. Are there any restraints impacting market growth?
N/A
8. Can you provide examples of recent developments in the market?
N/A
9. What pricing options are available for accessing the report?
Pricing options include single-user, multi-user, and enterprise licenses priced at USD 3950.00, USD 5925.00, and USD 7900.00 respectively.
10. Is the market size provided in terms of value or volume?
The market size is provided in terms of value, measured in million and volume, measured in K.
11. Are there any specific market keywords associated with the report?
Yes, the market keyword associated with the report is "Gaming Peripherals and Accessories," which aids in identifying and referencing the specific market segment covered.
12. How do I determine which pricing option suits my needs best?
The pricing options vary based on user requirements and access needs. Individual users may opt for single-user licenses, while businesses requiring broader access may choose multi-user or enterprise licenses for cost-effective access to the report.
13. Are there any additional resources or data provided in the Gaming Peripherals and Accessories report?
While the report offers comprehensive insights, it's advisable to review the specific contents or supplementary materials provided to ascertain if additional resources or data are available.
14. How can I stay updated on further developments or reports in the Gaming Peripherals and Accessories?
To stay informed about further developments, trends, and reports in the Gaming Peripherals and Accessories, consider subscribing to industry newsletters, following relevant companies and organizations, or regularly checking reputable industry news sources and publications.
Methodology
Step 1 - Identification of Relevant Samples Size from Population Database


Step 2 - Approaches for Defining Global Market Size (Value, Volume* & Price*)

Note*: In applicable scenarios
Step 3 - Data Sources
Primary Research
- Web Analytics
- Survey Reports
- Research Institute
- Latest Research Reports
- Opinion Leaders
Secondary Research
- Annual Reports
- White Paper
- Latest Press Release
- Industry Association
- Paid Database
- Investor Presentations

Step 4 - Data Triangulation
Involves using different sources of information in order to increase the validity of a study
These sources are likely to be stakeholders in a program - participants, other researchers, program staff, other community members, and so on.
Then we put all data in single framework & apply various statistical tools to find out the dynamic on the market.
During the analysis stage, feedback from the stakeholder groups would be compared to determine areas of agreement as well as areas of divergence
