

Key Insights
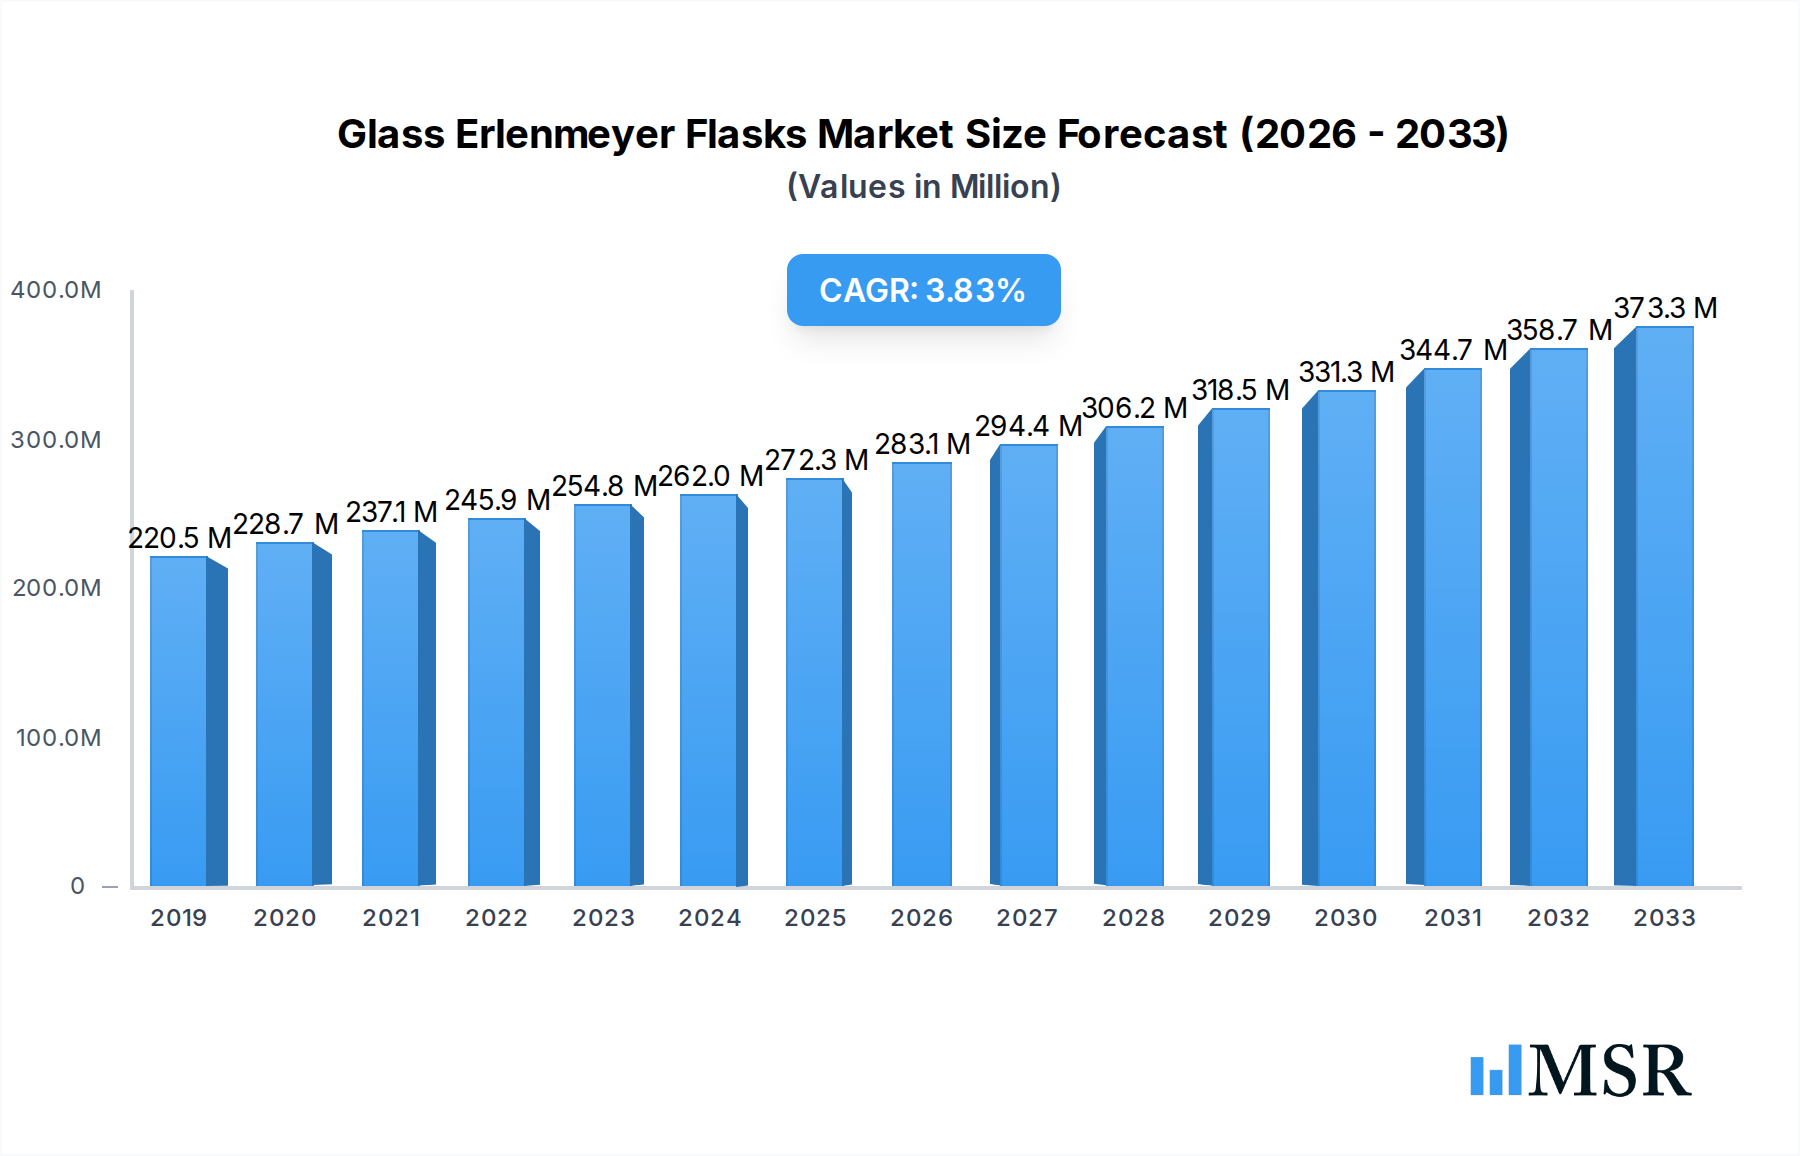
The global Glass Erlenmeyer Flask market is poised for robust growth, projected to reach a substantial $262 million by 2025, driven by a compound annual growth rate (CAGR) of 4.1%. This expansion is fueled by the increasing demand for precise and reliable laboratory equipment across diverse sectors. The bio-pharmaceutical industry stands out as a significant contributor, with continuous research and development activities necessitating high-quality glassware for experimentation, synthesis, and quality control. Similarly, the burgeoning food testing sector, driven by stringent regulatory standards and consumer demand for safe products, is a key growth engine. Chemical laboratories, the traditional stronghold of erlenmeyer flasks, continue to contribute steadily, owing to their fundamental role in analytical and synthetic chemistry. While the market is primarily segmented into graduated and non-graduated types, the increasing sophistication of laboratory procedures is expected to favor the adoption of graduated flasks for enhanced accuracy in volume measurements.

Glass Erlenmeyer Flasks Market Size (In Million)
The market's trajectory is further shaped by evolving trends such as the emphasis on sustainable laboratory practices, leading to a preference for durable and reusable glassware like borosilicate glass erlenmeyer flasks. Automation in laboratories also plays a role, with manufacturers developing flasks that are compatible with automated systems. However, the market is not without its restraints. The increasing adoption of alternative materials and disposable plastics in certain applications could pose a challenge, albeit a limited one given the superior chemical resistance and reusability of glass. Furthermore, fluctuations in raw material prices, particularly for borosilicate glass, could impact manufacturing costs. Despite these challenges, the intrinsic advantages of glass erlenmeyer flasks—chemical inertness, thermal shock resistance, and optical clarity—ensure their continued prominence in scientific research and industrial applications. Key players like DWK Life Sciences, Corning, and Bellco Glass are actively innovating and expanding their product portfolios to cater to the evolving needs of these dynamic sectors.
Glass Erlenmeyer Flasks Company Market Share
Glass Erlenmeyer Flasks Market Concentration & Dynamics
The global glass erlenmeyer flasks market exhibits a moderate concentration, with key players like DWK Life Sciences, Corning, and Quark Enterprises holding significant market shares, estimated at over 15 million each. These industry giants, alongside established players such as Bellco Glass, Glassco Group, Hamilton Laboratory Glass, Kavalierglass, BOROSIL, Hilgenberg, Hario, Pioneer Scientific Instrument, Jencons Glass Industries, and Sibata Scientific Technology, drive innovation through continuous research and development. The innovation ecosystem is characterized by advancements in material science for enhanced durability and chemical resistance, and streamlined manufacturing processes. Regulatory frameworks, primarily focused on laboratory safety and material purity, are stringent but generally conducive to market growth. Substitute products, such as plastic erlenmeyer flasks, present a competitive challenge, particularly in cost-sensitive applications, though glass remains preferred for its superior chemical inertness and thermal stability. End-user trends indicate a growing demand for high-purity, precision-engineered glassware across the bio-pharmaceutical and chemical laboratory segments. Merger and acquisition (M&A) activities are moderate, with an estimated 5-10 significant deals annually, aimed at expanding product portfolios and geographical reach.
- Market Share of Leading Players: DWK Life Sciences (xx million), Corning (xx million), Quark Enterprises (xx million).
- M&A Deal Count (Annual): Estimated 5-10 major transactions.
- Innovation Focus: Enhanced durability, chemical inertness, thermal resistance, and precision manufacturing.
- Regulatory Landscape: Emphasis on laboratory safety standards, material purity certifications.
Glass Erlenmeyer Flasks Industry Insights & Trends
The global glass erlenmeyer flasks market is poised for robust growth, driven by an increasing demand from burgeoning chemical and bio-pharmaceutical sectors. The market size is projected to reach approximately 800 million by the estimated year of 2025, with a compound annual growth rate (CAGR) of xx% expected during the forecast period of 2025–2033. Technological disruptions are primarily centered around advancements in glass manufacturing, leading to more precise graduations, improved thermal shock resistance, and enhanced chemical inertness, crucial for sensitive laboratory procedures. Evolving consumer behaviors highlight a preference for sustainable and durable laboratory equipment, further bolstering the demand for high-quality borosilicate glass erlenmeyer flasks. The historical period from 2019 to 2024 saw steady growth, influenced by increasing R&D investments globally and the expanding applications of erlenmeyer flasks in advanced scientific research. The base year of 2025 is anticipated to mark a significant milestone, with continued upward trajectory fueled by these trends. The shift towards digitalization in laboratories also indirectly supports the demand for reliable, manual glassware as complementary tools for experimentation and sample preparation. Furthermore, the increasing global focus on stringent quality control in food testing laboratories is creating a steady demand for specialized glassware. The development of specialized coatings for enhanced non-stick properties and easier cleaning is another trend that is gaining traction. The market is also seeing a subtle shift towards flasks with more intricate and precise volume markings to accommodate micro-scale experiments and highly quantitative analyses, especially in the R&D intensive bio-pharmaceutical segment.
Key Markets & Segments Leading Glass Erlenmeyer Flasks
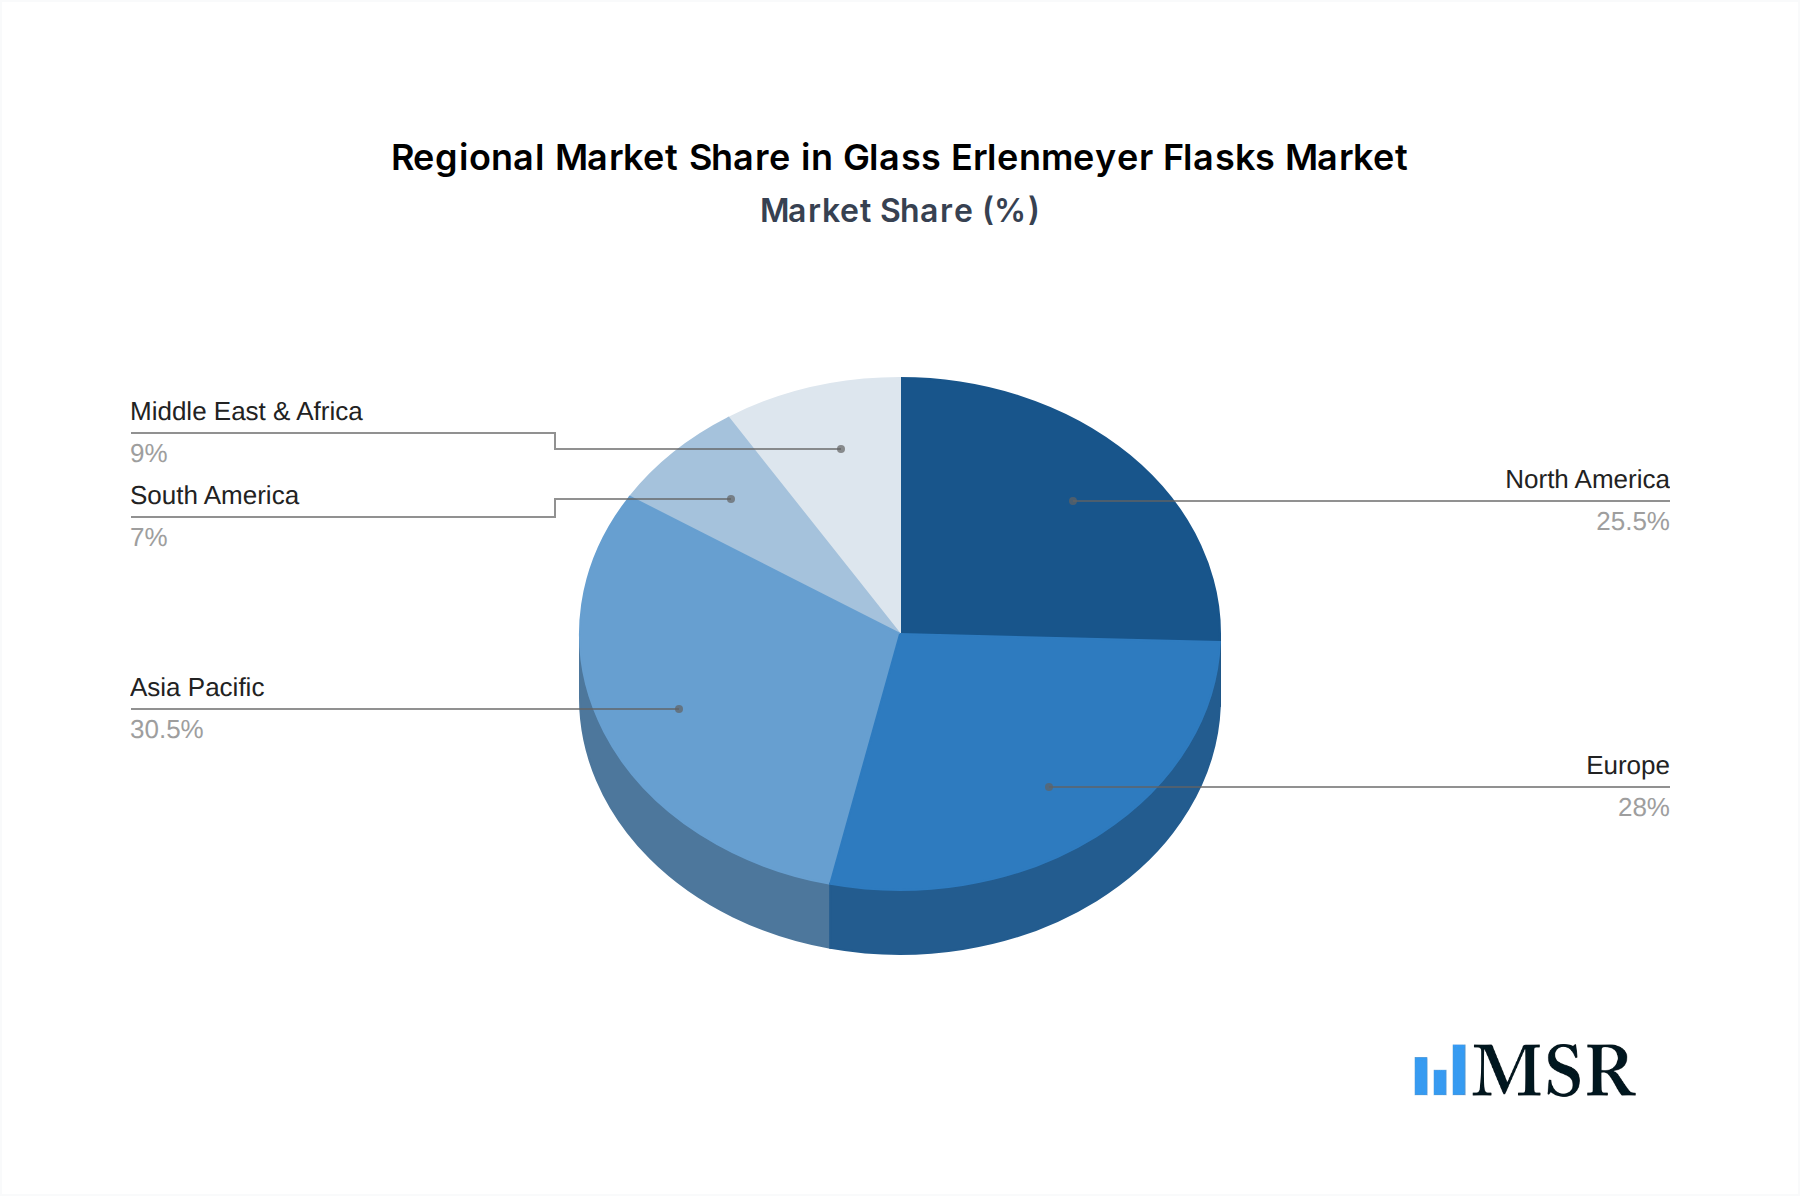
The Chemical Laboratory and Bio-Pharmaceutical Laboratory segments are the dominant forces driving the global glass erlenmeyer flasks market, accounting for an estimated 70% of the total market value. Within these segments, With Graduated erlenmeyer flasks are particularly sought after, contributing approximately 60% to the segment's revenue due to the critical need for precise volume measurements in experimental procedures and quality control. Geographically, North America and Europe continue to lead, with their well-established research infrastructure and substantial investments in life sciences and chemical industries, collectively representing over 50% of the global market share.
- Dominant Applications:
- Chemical Laboratory: Driven by extensive use in synthesis, titration, and general laboratory work. Economic growth in chemical manufacturing and increased R&D spending are key accelerators.
- Bio-Pharmaceutical Laboratory: Fueled by drug discovery, development, and quality assurance processes. Advancements in biotechnology and the growing pipeline of new therapeutics are critical drivers.
- Food Testing Laboratory: Exhibits steady growth due to stringent food safety regulations and the need for reliable analytical tools.
- Dominant Types:
- With Graduated: Essential for accurate volume dispensing and measurement, crucial for quantitative analyses. Increased focus on precision in research amplifies this demand.
- Without Graduated: Preferred for applications where approximate volumes are sufficient, such as mixing and general storage, offering a cost-effective option.
- Regional Dominance:
- North America: High concentration of research institutions and pharmaceutical companies, strong regulatory support for scientific innovation. Infrastructure development and a skilled workforce contribute significantly.
- Europe: Robust pharmaceutical and chemical industries, coupled with government initiatives promoting scientific research and development. A strong legacy of glass manufacturing also plays a role.
- Asia Pacific: Emerging as a significant growth region, driven by increasing investments in R&D, expansion of the pharmaceutical sector, and a growing number of food testing laboratories.
Glass Erlenmeyer Flasks Product Developments
Product development in the glass erlenmeyer flasks market is characterized by a focus on enhancing user experience and analytical precision. Innovations include the introduction of flasks with improved spout designs for cleaner pouring and reduced sample loss, as well as the development of specialized borosilicate glass formulations that offer superior thermal shock resistance and chemical inertness. Advances in graduation accuracy and legibility, often through etched or enamel markings, cater to the growing demand for precision in research. Some manufacturers are also exploring eco-friendly manufacturing processes and packaging solutions to align with sustainability trends.
Challenges in the Glass Erlenmeyer Flasks Market
The glass erlenmeyer flasks market faces several challenges that temper its growth trajectory. The primary restraint is the price sensitivity in certain market segments, where cheaper plastic alternatives are often favored, particularly in educational settings or for non-critical applications, impacting market share. Supply chain disruptions, exacerbated by global events, can lead to increased lead times and material costs for high-quality borosilicate glass, affecting manufacturing efficiency. Furthermore, intense competition among numerous global and regional manufacturers, coupled with the commoditization of basic flask types, can pressure profit margins. Regulatory hurdles, while ensuring quality, can also add to manufacturing complexity and cost.
- Price Competition: Pressure from lower-cost plastic alternatives.
- Supply Chain Volatility: Fluctuations in raw material availability and logistics.
- Intense Manufacturer Competition: Leading to price pressures and reduced profit margins.
Forces Driving Glass Erlenmeyer Flasks Growth
The growth of the glass erlenmeyer flasks market is propelled by a confluence of powerful forces. Foremost among these is the ever-increasing global investment in research and development, particularly within the pharmaceutical, biotechnology, and chemical industries, which are the primary consumers of these essential laboratory tools. Technological advancements in these fields necessitate high-quality, reliable glassware for accurate experimentation. Economic growth in emerging markets is also a significant driver, as these regions expand their scientific infrastructure and research capabilities. Furthermore, stringent regulatory requirements for quality control and safety in various industries, especially food and beverage testing, mandate the use of precise and inert laboratory glassware.
Challenges in the Glass Erlenmeyer Flasks Market
Long-term growth catalysts for the glass erlenmeyer flasks market lie in continuous innovation and strategic market expansion. The development of smart glassware integrated with sensors for real-time data logging during experiments presents a futuristic avenue. Partnerships between glassware manufacturers and scientific instrument companies can create synergistic opportunities, offering integrated solutions to end-users. Expanding into underserved geographical markets with developing research infrastructures, such as parts of Southeast Asia and Africa, offers significant untapped potential. Furthermore, focusing on niche applications within specialized research areas, like microfluidics or advanced material science, can carve out high-value market segments.
Emerging Opportunities in Glass Erlenmeyer Flasks
Emerging opportunities within the glass erlenmeyer flasks market are closely tied to scientific advancement and evolving industry needs. The growing field of synthetic biology and personalized medicine requires highly specialized and pure glassware for intricate experimental protocols, creating demand for custom-designed flasks. The increasing global focus on environmental sustainability is an opportunity for manufacturers to promote flasks made from recycled glass or through energy-efficient processes. Furthermore, the expansion of online e-commerce platforms for laboratory supplies provides a direct channel to reach a wider customer base, including smaller research institutions and individual scientists, facilitating market penetration and brand visibility.
- Synthetic Biology & Personalized Medicine: Demand for specialized, custom flasks.
- Sustainability Initiatives: Opportunities in eco-friendly manufacturing and materials.
- E-commerce Expansion: Direct market access and broader customer reach.
Leading Players in the Glass Erlenmeyer Flasks Sector
- DWK Life Sciences
- Corning
- Quark Enterprises
- Bellco Glass
- Glassco Group
- Hamilton Laboratory Glass
- Kavalierglass
- BOROSIL
- Hilgenberg
- Hario
- Pioneer Scientific Instrument
- Jencons Glass Industries
- Sibata Scientific Technology
Key Milestones in Glass Erlenmeyer Flasks Industry
- 2019: Increased adoption of automation in chemical synthesis drives demand for standardized, high-quality erlenmeyer flasks.
- 2020: The global pandemic accelerates R&D in bio-pharmaceuticals, leading to a surge in demand for laboratory glassware, including erlenmeyer flasks.
- 2021: Focus on sustainable manufacturing practices gains momentum, with some companies introducing erlenmeyer flasks made from recycled borosilicate glass.
- 2022: Advancements in etching techniques lead to more durable and precise graduations on erlenmeyer flasks, enhancing their utility in quantitative analysis.
- 2023: Increased regulatory scrutiny in food safety testing mandates the use of high-purity glassware, boosting demand for premium erlenmeyer flasks.
- 2024: Emergence of niche manufacturers offering customized erlenmeyer flask designs for specialized research applications, such as microfluidics.
Strategic Outlook for Glass Erlenmeyer Flasks Market
The strategic outlook for the glass erlenmeyer flasks market is characterized by sustained growth driven by innovation and market expansion. Key growth accelerators include continued investment in life sciences R&D, the increasing stringency of quality control standards across industries, and the ongoing expansion of research infrastructure in emerging economies. Manufacturers are advised to focus on developing value-added products, such as flasks with enhanced durability, improved precision graduations, and specialized functionalities, to command premium pricing. Strategic partnerships, particularly with instrument manufacturers and research institutions, will be crucial for staying ahead of technological trends and securing long-term contracts. Exploring new application areas and geographical markets will further diversify revenue streams and mitigate risks, ensuring a robust and competitive market presence.
Glass Erlenmeyer Flasks Segmentation
-
1. Application
- 1.1. Chemical Laboratory
- 1.2. Bio-Pharmaceutical Laboratory
- 1.3. Food Testing Laboratory
- 1.4. Others
-
2. Types
- 2.1. With Graduated
- 2.2. Without Graduated
Glass Erlenmeyer Flasks Segmentation By Geography
-
1. North America
- 1.1. United States
- 1.2. Canada
- 1.3. Mexico
-
2. South America
- 2.1. Brazil
- 2.2. Argentina
- 2.3. Rest of South America
-
3. Europe
- 3.1. United Kingdom
- 3.2. Germany
- 3.3. France
- 3.4. Italy
- 3.5. Spain
- 3.6. Russia
- 3.7. Benelux
- 3.8. Nordics
- 3.9. Rest of Europe
-
4. Middle East & Africa
- 4.1. Turkey
- 4.2. Israel
- 4.3. GCC
- 4.4. North Africa
- 4.5. South Africa
- 4.6. Rest of Middle East & Africa
-
5. Asia Pacific
- 5.1. China
- 5.2. India
- 5.3. Japan
- 5.4. South Korea
- 5.5. ASEAN
- 5.6. Oceania
- 5.7. Rest of Asia Pacific
Glass Erlenmeyer Flasks Regional Market Share
Geographic Coverage of Glass Erlenmeyer Flasks
Glass Erlenmeyer Flasks REPORT HIGHLIGHTS
| Aspects | Details |
|---|---|
| Study Period | 2020-2034 |
| Base Year | 2025 |
| Estimated Year | 2026 |
| Forecast Period | 2026-2034 |
| Historical Period | 2020-2025 |
| Growth Rate | CAGR of 4.1% from 2020-2034 |
| Segmentation |
|
Table of Contents
- 1. Introduction
- 1.1. Research Scope
- 1.2. Market Segmentation
- 1.3. Research Methodology
- 1.4. Definitions and Assumptions
- 2. Executive Summary
- 2.1. Introduction
- 3. Market Dynamics
- 3.1. Introduction
- 3.2. Market Drivers
- 3.3. Market Restrains
- 3.4. Market Trends
- 4. Market Factor Analysis
- 4.1. Porters Five Forces
- 4.2. Supply/Value Chain
- 4.3. PESTEL analysis
- 4.4. Market Entropy
- 4.5. Patent/Trademark Analysis
- 5. Global Glass Erlenmeyer Flasks Analysis, Insights and Forecast, 2020-2032
- 5.1. Market Analysis, Insights and Forecast - by Application
- 5.1.1. Chemical Laboratory
- 5.1.2. Bio-Pharmaceutical Laboratory
- 5.1.3. Food Testing Laboratory
- 5.1.4. Others
- 5.2. Market Analysis, Insights and Forecast - by Types
- 5.2.1. With Graduated
- 5.2.2. Without Graduated
- 5.3. Market Analysis, Insights and Forecast - by Region
- 5.3.1. North America
- 5.3.2. South America
- 5.3.3. Europe
- 5.3.4. Middle East & Africa
- 5.3.5. Asia Pacific
- 5.1. Market Analysis, Insights and Forecast - by Application
- 6. North America Glass Erlenmeyer Flasks Analysis, Insights and Forecast, 2020-2032
- 6.1. Market Analysis, Insights and Forecast - by Application
- 6.1.1. Chemical Laboratory
- 6.1.2. Bio-Pharmaceutical Laboratory
- 6.1.3. Food Testing Laboratory
- 6.1.4. Others
- 6.2. Market Analysis, Insights and Forecast - by Types
- 6.2.1. With Graduated
- 6.2.2. Without Graduated
- 6.1. Market Analysis, Insights and Forecast - by Application
- 7. South America Glass Erlenmeyer Flasks Analysis, Insights and Forecast, 2020-2032
- 7.1. Market Analysis, Insights and Forecast - by Application
- 7.1.1. Chemical Laboratory
- 7.1.2. Bio-Pharmaceutical Laboratory
- 7.1.3. Food Testing Laboratory
- 7.1.4. Others
- 7.2. Market Analysis, Insights and Forecast - by Types
- 7.2.1. With Graduated
- 7.2.2. Without Graduated
- 7.1. Market Analysis, Insights and Forecast - by Application
- 8. Europe Glass Erlenmeyer Flasks Analysis, Insights and Forecast, 2020-2032
- 8.1. Market Analysis, Insights and Forecast - by Application
- 8.1.1. Chemical Laboratory
- 8.1.2. Bio-Pharmaceutical Laboratory
- 8.1.3. Food Testing Laboratory
- 8.1.4. Others
- 8.2. Market Analysis, Insights and Forecast - by Types
- 8.2.1. With Graduated
- 8.2.2. Without Graduated
- 8.1. Market Analysis, Insights and Forecast - by Application
- 9. Middle East & Africa Glass Erlenmeyer Flasks Analysis, Insights and Forecast, 2020-2032
- 9.1. Market Analysis, Insights and Forecast - by Application
- 9.1.1. Chemical Laboratory
- 9.1.2. Bio-Pharmaceutical Laboratory
- 9.1.3. Food Testing Laboratory
- 9.1.4. Others
- 9.2. Market Analysis, Insights and Forecast - by Types
- 9.2.1. With Graduated
- 9.2.2. Without Graduated
- 9.1. Market Analysis, Insights and Forecast - by Application
- 10. Asia Pacific Glass Erlenmeyer Flasks Analysis, Insights and Forecast, 2020-2032
- 10.1. Market Analysis, Insights and Forecast - by Application
- 10.1.1. Chemical Laboratory
- 10.1.2. Bio-Pharmaceutical Laboratory
- 10.1.3. Food Testing Laboratory
- 10.1.4. Others
- 10.2. Market Analysis, Insights and Forecast - by Types
- 10.2.1. With Graduated
- 10.2.2. Without Graduated
- 10.1. Market Analysis, Insights and Forecast - by Application
- 11. Competitive Analysis
- 11.1. Global Market Share Analysis 2025
- 11.2. Company Profiles
- 11.2.1 DWK Life Sciences
- 11.2.1.1. Overview
- 11.2.1.2. Products
- 11.2.1.3. SWOT Analysis
- 11.2.1.4. Recent Developments
- 11.2.1.5. Financials (Based on Availability)
- 11.2.2 Corning
- 11.2.2.1. Overview
- 11.2.2.2. Products
- 11.2.2.3. SWOT Analysis
- 11.2.2.4. Recent Developments
- 11.2.2.5. Financials (Based on Availability)
- 11.2.3 Quark Enterprises
- 11.2.3.1. Overview
- 11.2.3.2. Products
- 11.2.3.3. SWOT Analysis
- 11.2.3.4. Recent Developments
- 11.2.3.5. Financials (Based on Availability)
- 11.2.4 Bellco Glass
- 11.2.4.1. Overview
- 11.2.4.2. Products
- 11.2.4.3. SWOT Analysis
- 11.2.4.4. Recent Developments
- 11.2.4.5. Financials (Based on Availability)
- 11.2.5 Glassco Group
- 11.2.5.1. Overview
- 11.2.5.2. Products
- 11.2.5.3. SWOT Analysis
- 11.2.5.4. Recent Developments
- 11.2.5.5. Financials (Based on Availability)
- 11.2.6 Hamilton Laboratory Glass
- 11.2.6.1. Overview
- 11.2.6.2. Products
- 11.2.6.3. SWOT Analysis
- 11.2.6.4. Recent Developments
- 11.2.6.5. Financials (Based on Availability)
- 11.2.7 Kavalierglass
- 11.2.7.1. Overview
- 11.2.7.2. Products
- 11.2.7.3. SWOT Analysis
- 11.2.7.4. Recent Developments
- 11.2.7.5. Financials (Based on Availability)
- 11.2.8 BOROSIL
- 11.2.8.1. Overview
- 11.2.8.2. Products
- 11.2.8.3. SWOT Analysis
- 11.2.8.4. Recent Developments
- 11.2.8.5. Financials (Based on Availability)
- 11.2.9 Hilgenberg
- 11.2.9.1. Overview
- 11.2.9.2. Products
- 11.2.9.3. SWOT Analysis
- 11.2.9.4. Recent Developments
- 11.2.9.5. Financials (Based on Availability)
- 11.2.10 Hario
- 11.2.10.1. Overview
- 11.2.10.2. Products
- 11.2.10.3. SWOT Analysis
- 11.2.10.4. Recent Developments
- 11.2.10.5. Financials (Based on Availability)
- 11.2.11 Pioneer Scientific Instrument
- 11.2.11.1. Overview
- 11.2.11.2. Products
- 11.2.11.3. SWOT Analysis
- 11.2.11.4. Recent Developments
- 11.2.11.5. Financials (Based on Availability)
- 11.2.12 Jencons Glass Industries
- 11.2.12.1. Overview
- 11.2.12.2. Products
- 11.2.12.3. SWOT Analysis
- 11.2.12.4. Recent Developments
- 11.2.12.5. Financials (Based on Availability)
- 11.2.13 Sibata Scientific Technology
- 11.2.13.1. Overview
- 11.2.13.2. Products
- 11.2.13.3. SWOT Analysis
- 11.2.13.4. Recent Developments
- 11.2.13.5. Financials (Based on Availability)
- 11.2.1 DWK Life Sciences
List of Figures
- Figure 1: Global Glass Erlenmeyer Flasks Revenue Breakdown (million, %) by Region 2025 & 2033
- Figure 2: Global Glass Erlenmeyer Flasks Volume Breakdown (K, %) by Region 2025 & 2033
- Figure 3: North America Glass Erlenmeyer Flasks Revenue (million), by Application 2025 & 2033
- Figure 4: North America Glass Erlenmeyer Flasks Volume (K), by Application 2025 & 2033
- Figure 5: North America Glass Erlenmeyer Flasks Revenue Share (%), by Application 2025 & 2033
- Figure 6: North America Glass Erlenmeyer Flasks Volume Share (%), by Application 2025 & 2033
- Figure 7: North America Glass Erlenmeyer Flasks Revenue (million), by Types 2025 & 2033
- Figure 8: North America Glass Erlenmeyer Flasks Volume (K), by Types 2025 & 2033
- Figure 9: North America Glass Erlenmeyer Flasks Revenue Share (%), by Types 2025 & 2033
- Figure 10: North America Glass Erlenmeyer Flasks Volume Share (%), by Types 2025 & 2033
- Figure 11: North America Glass Erlenmeyer Flasks Revenue (million), by Country 2025 & 2033
- Figure 12: North America Glass Erlenmeyer Flasks Volume (K), by Country 2025 & 2033
- Figure 13: North America Glass Erlenmeyer Flasks Revenue Share (%), by Country 2025 & 2033
- Figure 14: North America Glass Erlenmeyer Flasks Volume Share (%), by Country 2025 & 2033
- Figure 15: South America Glass Erlenmeyer Flasks Revenue (million), by Application 2025 & 2033
- Figure 16: South America Glass Erlenmeyer Flasks Volume (K), by Application 2025 & 2033
- Figure 17: South America Glass Erlenmeyer Flasks Revenue Share (%), by Application 2025 & 2033
- Figure 18: South America Glass Erlenmeyer Flasks Volume Share (%), by Application 2025 & 2033
- Figure 19: South America Glass Erlenmeyer Flasks Revenue (million), by Types 2025 & 2033
- Figure 20: South America Glass Erlenmeyer Flasks Volume (K), by Types 2025 & 2033
- Figure 21: South America Glass Erlenmeyer Flasks Revenue Share (%), by Types 2025 & 2033
- Figure 22: South America Glass Erlenmeyer Flasks Volume Share (%), by Types 2025 & 2033
- Figure 23: South America Glass Erlenmeyer Flasks Revenue (million), by Country 2025 & 2033
- Figure 24: South America Glass Erlenmeyer Flasks Volume (K), by Country 2025 & 2033
- Figure 25: South America Glass Erlenmeyer Flasks Revenue Share (%), by Country 2025 & 2033
- Figure 26: South America Glass Erlenmeyer Flasks Volume Share (%), by Country 2025 & 2033
- Figure 27: Europe Glass Erlenmeyer Flasks Revenue (million), by Application 2025 & 2033
- Figure 28: Europe Glass Erlenmeyer Flasks Volume (K), by Application 2025 & 2033
- Figure 29: Europe Glass Erlenmeyer Flasks Revenue Share (%), by Application 2025 & 2033
- Figure 30: Europe Glass Erlenmeyer Flasks Volume Share (%), by Application 2025 & 2033
- Figure 31: Europe Glass Erlenmeyer Flasks Revenue (million), by Types 2025 & 2033
- Figure 32: Europe Glass Erlenmeyer Flasks Volume (K), by Types 2025 & 2033
- Figure 33: Europe Glass Erlenmeyer Flasks Revenue Share (%), by Types 2025 & 2033
- Figure 34: Europe Glass Erlenmeyer Flasks Volume Share (%), by Types 2025 & 2033
- Figure 35: Europe Glass Erlenmeyer Flasks Revenue (million), by Country 2025 & 2033
- Figure 36: Europe Glass Erlenmeyer Flasks Volume (K), by Country 2025 & 2033
- Figure 37: Europe Glass Erlenmeyer Flasks Revenue Share (%), by Country 2025 & 2033
- Figure 38: Europe Glass Erlenmeyer Flasks Volume Share (%), by Country 2025 & 2033
- Figure 39: Middle East & Africa Glass Erlenmeyer Flasks Revenue (million), by Application 2025 & 2033
- Figure 40: Middle East & Africa Glass Erlenmeyer Flasks Volume (K), by Application 2025 & 2033
- Figure 41: Middle East & Africa Glass Erlenmeyer Flasks Revenue Share (%), by Application 2025 & 2033
- Figure 42: Middle East & Africa Glass Erlenmeyer Flasks Volume Share (%), by Application 2025 & 2033
- Figure 43: Middle East & Africa Glass Erlenmeyer Flasks Revenue (million), by Types 2025 & 2033
- Figure 44: Middle East & Africa Glass Erlenmeyer Flasks Volume (K), by Types 2025 & 2033
- Figure 45: Middle East & Africa Glass Erlenmeyer Flasks Revenue Share (%), by Types 2025 & 2033
- Figure 46: Middle East & Africa Glass Erlenmeyer Flasks Volume Share (%), by Types 2025 & 2033
- Figure 47: Middle East & Africa Glass Erlenmeyer Flasks Revenue (million), by Country 2025 & 2033
- Figure 48: Middle East & Africa Glass Erlenmeyer Flasks Volume (K), by Country 2025 & 2033
- Figure 49: Middle East & Africa Glass Erlenmeyer Flasks Revenue Share (%), by Country 2025 & 2033
- Figure 50: Middle East & Africa Glass Erlenmeyer Flasks Volume Share (%), by Country 2025 & 2033
- Figure 51: Asia Pacific Glass Erlenmeyer Flasks Revenue (million), by Application 2025 & 2033
- Figure 52: Asia Pacific Glass Erlenmeyer Flasks Volume (K), by Application 2025 & 2033
- Figure 53: Asia Pacific Glass Erlenmeyer Flasks Revenue Share (%), by Application 2025 & 2033
- Figure 54: Asia Pacific Glass Erlenmeyer Flasks Volume Share (%), by Application 2025 & 2033
- Figure 55: Asia Pacific Glass Erlenmeyer Flasks Revenue (million), by Types 2025 & 2033
- Figure 56: Asia Pacific Glass Erlenmeyer Flasks Volume (K), by Types 2025 & 2033
- Figure 57: Asia Pacific Glass Erlenmeyer Flasks Revenue Share (%), by Types 2025 & 2033
- Figure 58: Asia Pacific Glass Erlenmeyer Flasks Volume Share (%), by Types 2025 & 2033
- Figure 59: Asia Pacific Glass Erlenmeyer Flasks Revenue (million), by Country 2025 & 2033
- Figure 60: Asia Pacific Glass Erlenmeyer Flasks Volume (K), by Country 2025 & 2033
- Figure 61: Asia Pacific Glass Erlenmeyer Flasks Revenue Share (%), by Country 2025 & 2033
- Figure 62: Asia Pacific Glass Erlenmeyer Flasks Volume Share (%), by Country 2025 & 2033
List of Tables
- Table 1: Global Glass Erlenmeyer Flasks Revenue million Forecast, by Application 2020 & 2033
- Table 2: Global Glass Erlenmeyer Flasks Volume K Forecast, by Application 2020 & 2033
- Table 3: Global Glass Erlenmeyer Flasks Revenue million Forecast, by Types 2020 & 2033
- Table 4: Global Glass Erlenmeyer Flasks Volume K Forecast, by Types 2020 & 2033
- Table 5: Global Glass Erlenmeyer Flasks Revenue million Forecast, by Region 2020 & 2033
- Table 6: Global Glass Erlenmeyer Flasks Volume K Forecast, by Region 2020 & 2033
- Table 7: Global Glass Erlenmeyer Flasks Revenue million Forecast, by Application 2020 & 2033
- Table 8: Global Glass Erlenmeyer Flasks Volume K Forecast, by Application 2020 & 2033
- Table 9: Global Glass Erlenmeyer Flasks Revenue million Forecast, by Types 2020 & 2033
- Table 10: Global Glass Erlenmeyer Flasks Volume K Forecast, by Types 2020 & 2033
- Table 11: Global Glass Erlenmeyer Flasks Revenue million Forecast, by Country 2020 & 2033
- Table 12: Global Glass Erlenmeyer Flasks Volume K Forecast, by Country 2020 & 2033
- Table 13: United States Glass Erlenmeyer Flasks Revenue (million) Forecast, by Application 2020 & 2033
- Table 14: United States Glass Erlenmeyer Flasks Volume (K) Forecast, by Application 2020 & 2033
- Table 15: Canada Glass Erlenmeyer Flasks Revenue (million) Forecast, by Application 2020 & 2033
- Table 16: Canada Glass Erlenmeyer Flasks Volume (K) Forecast, by Application 2020 & 2033
- Table 17: Mexico Glass Erlenmeyer Flasks Revenue (million) Forecast, by Application 2020 & 2033
- Table 18: Mexico Glass Erlenmeyer Flasks Volume (K) Forecast, by Application 2020 & 2033
- Table 19: Global Glass Erlenmeyer Flasks Revenue million Forecast, by Application 2020 & 2033
- Table 20: Global Glass Erlenmeyer Flasks Volume K Forecast, by Application 2020 & 2033
- Table 21: Global Glass Erlenmeyer Flasks Revenue million Forecast, by Types 2020 & 2033
- Table 22: Global Glass Erlenmeyer Flasks Volume K Forecast, by Types 2020 & 2033
- Table 23: Global Glass Erlenmeyer Flasks Revenue million Forecast, by Country 2020 & 2033
- Table 24: Global Glass Erlenmeyer Flasks Volume K Forecast, by Country 2020 & 2033
- Table 25: Brazil Glass Erlenmeyer Flasks Revenue (million) Forecast, by Application 2020 & 2033
- Table 26: Brazil Glass Erlenmeyer Flasks Volume (K) Forecast, by Application 2020 & 2033
- Table 27: Argentina Glass Erlenmeyer Flasks Revenue (million) Forecast, by Application 2020 & 2033
- Table 28: Argentina Glass Erlenmeyer Flasks Volume (K) Forecast, by Application 2020 & 2033
- Table 29: Rest of South America Glass Erlenmeyer Flasks Revenue (million) Forecast, by Application 2020 & 2033
- Table 30: Rest of South America Glass Erlenmeyer Flasks Volume (K) Forecast, by Application 2020 & 2033
- Table 31: Global Glass Erlenmeyer Flasks Revenue million Forecast, by Application 2020 & 2033
- Table 32: Global Glass Erlenmeyer Flasks Volume K Forecast, by Application 2020 & 2033
- Table 33: Global Glass Erlenmeyer Flasks Revenue million Forecast, by Types 2020 & 2033
- Table 34: Global Glass Erlenmeyer Flasks Volume K Forecast, by Types 2020 & 2033
- Table 35: Global Glass Erlenmeyer Flasks Revenue million Forecast, by Country 2020 & 2033
- Table 36: Global Glass Erlenmeyer Flasks Volume K Forecast, by Country 2020 & 2033
- Table 37: United Kingdom Glass Erlenmeyer Flasks Revenue (million) Forecast, by Application 2020 & 2033
- Table 38: United Kingdom Glass Erlenmeyer Flasks Volume (K) Forecast, by Application 2020 & 2033
- Table 39: Germany Glass Erlenmeyer Flasks Revenue (million) Forecast, by Application 2020 & 2033
- Table 40: Germany Glass Erlenmeyer Flasks Volume (K) Forecast, by Application 2020 & 2033
- Table 41: France Glass Erlenmeyer Flasks Revenue (million) Forecast, by Application 2020 & 2033
- Table 42: France Glass Erlenmeyer Flasks Volume (K) Forecast, by Application 2020 & 2033
- Table 43: Italy Glass Erlenmeyer Flasks Revenue (million) Forecast, by Application 2020 & 2033
- Table 44: Italy Glass Erlenmeyer Flasks Volume (K) Forecast, by Application 2020 & 2033
- Table 45: Spain Glass Erlenmeyer Flasks Revenue (million) Forecast, by Application 2020 & 2033
- Table 46: Spain Glass Erlenmeyer Flasks Volume (K) Forecast, by Application 2020 & 2033
- Table 47: Russia Glass Erlenmeyer Flasks Revenue (million) Forecast, by Application 2020 & 2033
- Table 48: Russia Glass Erlenmeyer Flasks Volume (K) Forecast, by Application 2020 & 2033
- Table 49: Benelux Glass Erlenmeyer Flasks Revenue (million) Forecast, by Application 2020 & 2033
- Table 50: Benelux Glass Erlenmeyer Flasks Volume (K) Forecast, by Application 2020 & 2033
- Table 51: Nordics Glass Erlenmeyer Flasks Revenue (million) Forecast, by Application 2020 & 2033
- Table 52: Nordics Glass Erlenmeyer Flasks Volume (K) Forecast, by Application 2020 & 2033
- Table 53: Rest of Europe Glass Erlenmeyer Flasks Revenue (million) Forecast, by Application 2020 & 2033
- Table 54: Rest of Europe Glass Erlenmeyer Flasks Volume (K) Forecast, by Application 2020 & 2033
- Table 55: Global Glass Erlenmeyer Flasks Revenue million Forecast, by Application 2020 & 2033
- Table 56: Global Glass Erlenmeyer Flasks Volume K Forecast, by Application 2020 & 2033
- Table 57: Global Glass Erlenmeyer Flasks Revenue million Forecast, by Types 2020 & 2033
- Table 58: Global Glass Erlenmeyer Flasks Volume K Forecast, by Types 2020 & 2033
- Table 59: Global Glass Erlenmeyer Flasks Revenue million Forecast, by Country 2020 & 2033
- Table 60: Global Glass Erlenmeyer Flasks Volume K Forecast, by Country 2020 & 2033
- Table 61: Turkey Glass Erlenmeyer Flasks Revenue (million) Forecast, by Application 2020 & 2033
- Table 62: Turkey Glass Erlenmeyer Flasks Volume (K) Forecast, by Application 2020 & 2033
- Table 63: Israel Glass Erlenmeyer Flasks Revenue (million) Forecast, by Application 2020 & 2033
- Table 64: Israel Glass Erlenmeyer Flasks Volume (K) Forecast, by Application 2020 & 2033
- Table 65: GCC Glass Erlenmeyer Flasks Revenue (million) Forecast, by Application 2020 & 2033
- Table 66: GCC Glass Erlenmeyer Flasks Volume (K) Forecast, by Application 2020 & 2033
- Table 67: North Africa Glass Erlenmeyer Flasks Revenue (million) Forecast, by Application 2020 & 2033
- Table 68: North Africa Glass Erlenmeyer Flasks Volume (K) Forecast, by Application 2020 & 2033
- Table 69: South Africa Glass Erlenmeyer Flasks Revenue (million) Forecast, by Application 2020 & 2033
- Table 70: South Africa Glass Erlenmeyer Flasks Volume (K) Forecast, by Application 2020 & 2033
- Table 71: Rest of Middle East & Africa Glass Erlenmeyer Flasks Revenue (million) Forecast, by Application 2020 & 2033
- Table 72: Rest of Middle East & Africa Glass Erlenmeyer Flasks Volume (K) Forecast, by Application 2020 & 2033
- Table 73: Global Glass Erlenmeyer Flasks Revenue million Forecast, by Application 2020 & 2033
- Table 74: Global Glass Erlenmeyer Flasks Volume K Forecast, by Application 2020 & 2033
- Table 75: Global Glass Erlenmeyer Flasks Revenue million Forecast, by Types 2020 & 2033
- Table 76: Global Glass Erlenmeyer Flasks Volume K Forecast, by Types 2020 & 2033
- Table 77: Global Glass Erlenmeyer Flasks Revenue million Forecast, by Country 2020 & 2033
- Table 78: Global Glass Erlenmeyer Flasks Volume K Forecast, by Country 2020 & 2033
- Table 79: China Glass Erlenmeyer Flasks Revenue (million) Forecast, by Application 2020 & 2033
- Table 80: China Glass Erlenmeyer Flasks Volume (K) Forecast, by Application 2020 & 2033
- Table 81: India Glass Erlenmeyer Flasks Revenue (million) Forecast, by Application 2020 & 2033
- Table 82: India Glass Erlenmeyer Flasks Volume (K) Forecast, by Application 2020 & 2033
- Table 83: Japan Glass Erlenmeyer Flasks Revenue (million) Forecast, by Application 2020 & 2033
- Table 84: Japan Glass Erlenmeyer Flasks Volume (K) Forecast, by Application 2020 & 2033
- Table 85: South Korea Glass Erlenmeyer Flasks Revenue (million) Forecast, by Application 2020 & 2033
- Table 86: South Korea Glass Erlenmeyer Flasks Volume (K) Forecast, by Application 2020 & 2033
- Table 87: ASEAN Glass Erlenmeyer Flasks Revenue (million) Forecast, by Application 2020 & 2033
- Table 88: ASEAN Glass Erlenmeyer Flasks Volume (K) Forecast, by Application 2020 & 2033
- Table 89: Oceania Glass Erlenmeyer Flasks Revenue (million) Forecast, by Application 2020 & 2033
- Table 90: Oceania Glass Erlenmeyer Flasks Volume (K) Forecast, by Application 2020 & 2033
- Table 91: Rest of Asia Pacific Glass Erlenmeyer Flasks Revenue (million) Forecast, by Application 2020 & 2033
- Table 92: Rest of Asia Pacific Glass Erlenmeyer Flasks Volume (K) Forecast, by Application 2020 & 2033
Frequently Asked Questions
1. What is the projected Compound Annual Growth Rate (CAGR) of the Glass Erlenmeyer Flasks?
The projected CAGR is approximately 4.1%.
2. Which companies are prominent players in the Glass Erlenmeyer Flasks?
Key companies in the market include DWK Life Sciences, Corning, Quark Enterprises, Bellco Glass, Glassco Group, Hamilton Laboratory Glass, Kavalierglass, BOROSIL, Hilgenberg, Hario, Pioneer Scientific Instrument, Jencons Glass Industries, Sibata Scientific Technology.
3. What are the main segments of the Glass Erlenmeyer Flasks?
The market segments include Application, Types.
4. Can you provide details about the market size?
The market size is estimated to be USD 262 million as of 2022.
5. What are some drivers contributing to market growth?
N/A
6. What are the notable trends driving market growth?
N/A
7. Are there any restraints impacting market growth?
N/A
8. Can you provide examples of recent developments in the market?
N/A
9. What pricing options are available for accessing the report?
Pricing options include single-user, multi-user, and enterprise licenses priced at USD 3350.00, USD 5025.00, and USD 6700.00 respectively.
10. Is the market size provided in terms of value or volume?
The market size is provided in terms of value, measured in million and volume, measured in K.
11. Are there any specific market keywords associated with the report?
Yes, the market keyword associated with the report is "Glass Erlenmeyer Flasks," which aids in identifying and referencing the specific market segment covered.
12. How do I determine which pricing option suits my needs best?
The pricing options vary based on user requirements and access needs. Individual users may opt for single-user licenses, while businesses requiring broader access may choose multi-user or enterprise licenses for cost-effective access to the report.
13. Are there any additional resources or data provided in the Glass Erlenmeyer Flasks report?
While the report offers comprehensive insights, it's advisable to review the specific contents or supplementary materials provided to ascertain if additional resources or data are available.
14. How can I stay updated on further developments or reports in the Glass Erlenmeyer Flasks?
To stay informed about further developments, trends, and reports in the Glass Erlenmeyer Flasks, consider subscribing to industry newsletters, following relevant companies and organizations, or regularly checking reputable industry news sources and publications.
Methodology
Step 1 - Identification of Relevant Samples Size from Population Database


Step 2 - Approaches for Defining Global Market Size (Value, Volume* & Price*)

Note*: In applicable scenarios
Step 3 - Data Sources
Primary Research
- Web Analytics
- Survey Reports
- Research Institute
- Latest Research Reports
- Opinion Leaders
Secondary Research
- Annual Reports
- White Paper
- Latest Press Release
- Industry Association
- Paid Database
- Investor Presentations

Step 4 - Data Triangulation
Involves using different sources of information in order to increase the validity of a study
These sources are likely to be stakeholders in a program - participants, other researchers, program staff, other community members, and so on.
Then we put all data in single framework & apply various statistical tools to find out the dynamic on the market.
During the analysis stage, feedback from the stakeholder groups would be compared to determine areas of agreement as well as areas of divergence