

Key Insights
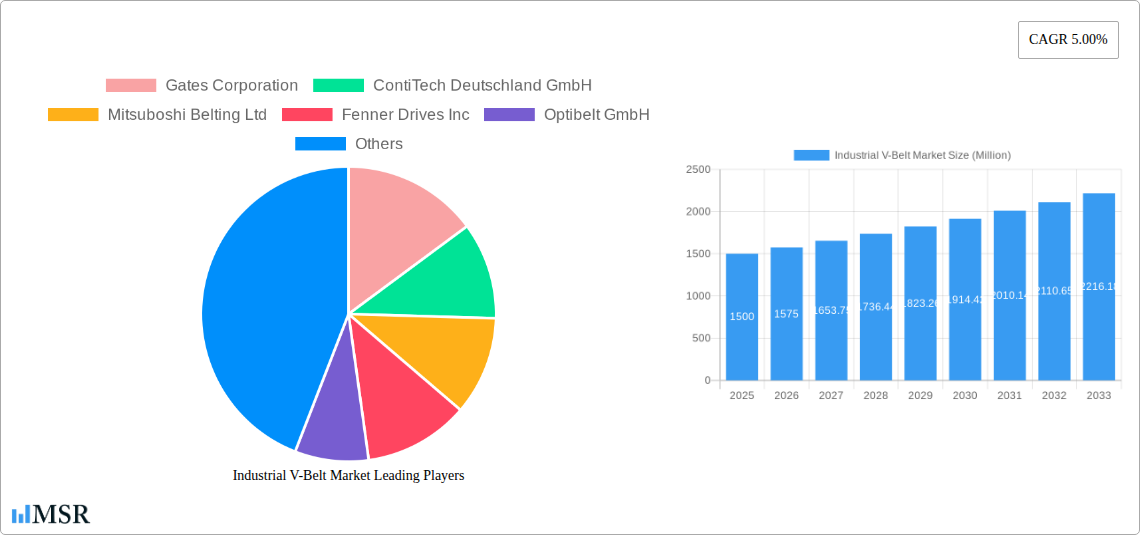
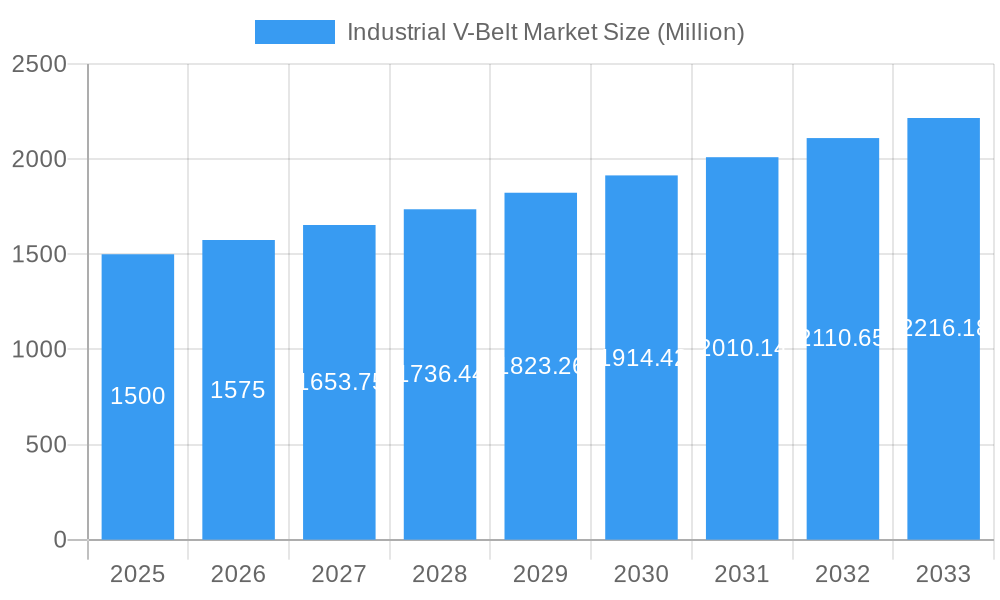
The global industrial V-belt market, currently valued at approximately $1.5 billion in 2025, is projected to experience robust growth, driven by the increasing demand across various industrial sectors. A Compound Annual Growth Rate (CAGR) of 5% from 2025 to 2033 indicates a significant expansion in market size over the forecast period. This growth is fueled by several key factors. The rising adoption of automation and advanced manufacturing processes across industries like automotive, food processing, and materials handling necessitates reliable power transmission systems, boosting demand for V-belts. Furthermore, the increasing focus on energy efficiency and improved operational productivity is prompting manufacturers to adopt high-performance V-belts offering enhanced durability and longevity. Technological advancements in V-belt materials and designs, such as the development of reinforced belts and specialized constructions for specific applications, contribute further to market expansion. However, factors such as fluctuating raw material prices and the increasing adoption of alternative power transmission technologies could pose challenges to market growth in the coming years.
Industrial V-Belt Market Market Size (In Billion)
The competitive landscape is characterized by the presence of several major players, including Gates Corporation, ContiTech, Mitsuboshi Belting, and others, each contributing to innovation and market penetration. The market is segmented based on factors such as material type (rubber, polyurethane, etc.), application (power transmission, conveying, etc.), and region. Regional variations in industrial growth, technological adoption, and regulatory environments significantly influence market dynamics. North America and Europe are expected to maintain significant market shares due to established industrial bases and high technological penetration. However, rapidly developing economies in Asia-Pacific are poised to witness substantial growth in demand for industrial V-belts, driven by increasing industrialization and infrastructure development. The forecast period will likely see a continued shift towards higher-performance, longer-lasting V-belts, aligning with the growing emphasis on efficiency and sustainability across diverse industrial applications.
Industrial V-Belt Market Company Market Share
Industrial V-Belt Market Report: A Comprehensive Analysis (2019-2033)
This comprehensive report provides an in-depth analysis of the global Industrial V-Belt market, offering invaluable insights for stakeholders across the value chain. With a study period spanning 2019-2033, a base year of 2025, and a forecast period of 2025-2033, this report meticulously examines market dynamics, trends, and opportunities. The report analyzes key players such as Gates Corporation, ContiTech Deutschland GmbH, Mitsuboshi Belting Ltd, and more, offering crucial data to inform strategic decision-making. The market is segmented by [insert segments here, e.g., type, application, end-user], providing a granular understanding of market behavior. The report’s value lies in its actionable insights, detailed analysis of recent industry developments (including Gates Corporation's advancements and Dayco Inc.'s new plant), and projections for future growth. This report is a crucial resource for industry professionals seeking to navigate the complexities of the Industrial V-Belt market and capitalize on its future potential. The estimated market size in 2025 is xx Million, with a projected CAGR of xx% during the forecast period.
Industrial V-Belt Market Concentration & Dynamics
The Industrial V-Belt market exhibits a moderately concentrated landscape, with a few major players holding significant market share. However, the presence of numerous smaller players fosters competition and innovation. Market share data for 2024 reveals that [insert market share data for top 3-5 players, e.g., Gates Corporation holds approximately 20%, ContiTech holds 15%, etc.]. The innovation ecosystem is driven by ongoing research into materials science, focusing on enhancing belt durability, efficiency, and longevity. Stringent regulatory frameworks regarding material safety and environmental impact influence manufacturing processes and product design. Substitute products, such as timing belts and gear systems, present competitive challenges, yet the robustness and cost-effectiveness of V-belts maintain their dominance in numerous applications. End-user trends favor energy efficiency and reduced maintenance costs, pushing manufacturers to develop advanced V-belt technologies. M&A activities within the last 5 years have been moderate, with approximately xx deals recorded [insert the exact number if available, otherwise use a reasonable estimate], primarily focused on expanding geographic reach and product portfolios. These activities contribute to market consolidation and influence the competitive landscape.
Industrial V-Belt Market Industry Insights & Trends
The global Industrial V-Belt market is poised for significant expansion, projected to witness robust growth throughout the forecast period (2025-2033). This upward trajectory is primarily fueled by the accelerating pace of industrial automation across various sectors, a growing emphasis on energy-efficient power transmission solutions, and the continuous expansion of diverse industrial footprints, particularly within emerging economies. Market analysts anticipate the global Industrial V-Belt market to reach an impressive valuation of xx Million USD by 2033, exhibiting a Compound Annual Growth Rate (CAGR) of approximately xx%. The landscape of product innovation is being significantly reshaped by technological advancements, including the adoption of cutting-edge materials and sophisticated manufacturing methodologies. Notably, Ethylene Elastomer (EE) compounds are increasingly favored over traditional Chloroprene Rubber (CR) materials due to their superior performance characteristics, enhanced durability, and extended service life. Consumers are placing a premium on V-belts that offer higher performance, greater longevity, and reduced maintenance requirements, compelling manufacturers to prioritize the development and integration of value-added features. Furthermore, the integration of advanced technologies such as smart sensors and sophisticated predictive maintenance solutions into V-belt systems is acting as a catalyst for market growth. These converging trends underscore a profound shift towards a more technologically advanced, efficient, and intelligent power transmission industry, thereby solidifying and intensifying the demand for high-performance Industrial V-belts.
Key Markets & Segments Leading Industrial V-Belt Market
The [insert dominant region, e.g., Asia-Pacific] region currently dominates the Industrial V-Belt market, accounting for approximately xx% of the global market share in 2024. This dominance is primarily attributed to the region's rapid industrialization, significant investments in infrastructure development, and the presence of major manufacturing hubs. Within the region, [insert dominant country, e.g., China] stands out due to its substantial industrial base and high demand for power transmission solutions.
- Drivers for the dominant region/country:
- Rapid industrialization and infrastructure development.
- Growing automotive and manufacturing sectors.
- Favorable government policies supporting industrial growth.
- Increasing adoption of automation in various industries.
The detailed dominance analysis indicates a strong correlation between economic growth and Industrial V-Belt market performance, particularly in developing economies. The burgeoning automotive and manufacturing sectors, coupled with substantial investments in infrastructure, are driving significant demand for reliable and efficient power transmission systems, strengthening the market position of Industrial V-belts in the region.
Industrial V-Belt Market Product Developments
Recent product innovations focus on enhanced durability, energy efficiency, and reduced noise levels. The shift from CR to EE compounds in V-belts, as exemplified by Gates Corporation's recent announcement, signifies a major advancement in material science, leading to superior performance characteristics. New designs, including molded tooth profiles, offer quieter operation and improved efficiency. These developments cater to evolving end-user preferences, enhancing the market competitiveness of advanced V-belt technologies. The focus on reducing maintenance downtime and improving overall system reliability highlights the industry’s commitment to meeting the growing demands of modern industrial applications.
Challenges in the Industrial V-Belt Market
The Industrial V-Belt market faces several challenges. Fluctuations in raw material prices, particularly rubber and synthetic materials, impact production costs and profitability. Supply chain disruptions, exacerbated by global events, can lead to production delays and shortages. Intense competition from substitute products and from manufacturers with lower production costs creates price pressures. The industry also faces environmental regulations regarding material disposal and manufacturing processes, demanding compliance measures that add to operational costs. These factors present obstacles to consistent market growth, affecting profitability and investment decisions.
Forces Driving Industrial V-Belt Market Growth
The burgeoning Industrial V-Belt market is propelled by a confluence of potent growth drivers. The substantial and ongoing expansion of the global manufacturing and automotive sectors serves as a cornerstone of demand. The pervasive trend of increasing automation within industrial processes, coupled with stringent mandates for energy efficiency in power transmission, is directly escalating the adoption of advanced and superior V-belt technologies. Government-led initiatives focused on infrastructure development and the promotion of industrial growth across numerous nations are providing a significant and sustained impetus to the market. Moreover, continuous technological breakthroughs in material science and manufacturing processes are consistently elevating the performance benchmarks of V-belts, solidifying their position as the preferred and most reliable power transmission solution across an ever-widening array of industrial applications.
Long-Term Growth Catalysts in the Industrial V-Belt Market
Long-term growth will be fueled by continued innovation in materials science, leading to even more durable, efficient, and environmentally friendly V-belts. Strategic partnerships between manufacturers and end-users will result in customized solutions for specific applications. The expansion into new markets, especially developing economies undergoing rapid industrialization, offers vast growth potential. These factors ensure sustained expansion of the Industrial V-Belt market throughout the forecast period.
Emerging Opportunities in Industrial V-Belt Market
The growing global consciousness surrounding sustainability is actively fostering the emergence of significant opportunities for the development of environmentally responsible V-belt designs. This includes the utilization of recycled materials and the engineering of products with a minimized ecological footprint. The widespread adoption of smart manufacturing technologies and the overarching principles of Industry 4.0 are generating increased demand for sophisticated V-belt systems that incorporate embedded sensors for advanced predictive maintenance capabilities. The dynamic growth observed in specialized industrial sectors, such as renewable energy generation and the burgeoning robotics industry, presents novel and lucrative application segments for V-belts. By adeptly addressing the unique and evolving needs of these burgeoning markets, innovative players are positioned to unlock substantial growth prospects and secure a competitive advantage.
Leading Players in the Industrial V-Belt Market Sector
- Gates Corporation
- ContiTech Deutschland GmbH
- Mitsuboshi Belting Ltd
- Fenner Drives Inc
- Optibelt GmbH
- Bando Chemical Industries Ltd
- SFK Group
- Hutchinson
- PIX Transmissions Ltd
- Timken Belts
- Zhejiang Sanlux Rubber Co Ltd
- PowerDrive LLC
- BEHA Innovation GmbH
- *List Not Exhaustive
Key Milestones in Industrial V-Belt Market Industry
- August 2024: Gates Corporation has announced a significant strategic transition, shifting the composition of its Super High Capacity (HC) Molded Notch (MN) V-belt from traditional CR materials to advanced EE compounds. This upgrade is designed to deliver enhanced performance and superior durability. Concurrently, the company has initiated the production of its EE Tri-Power V-belts within its European facilities, a move aimed at substantially reducing lead times and improving product availability for its European clientele.
- July 2024: Gates Corporation commenced the manufacturing of its highly anticipated EE Tri-Power V-belts at its European production sites, marking a crucial step in expanding its global supply chain and meeting regional demand.
- March 2024: Dayco Inc. celebrated the inauguration of its new state-of-the-art manufacturing plant located in San Luis Potosí, Mexico. This facility boasts an impressive annual production capacity of up to 4.2 million Poly-V belts, representing a substantial augmentation of their manufacturing capabilities and a strategic response to the escalating global demand for high-quality automotive belts.
Strategic Outlook for Industrial V-Belt Market
The Industrial V-Belt market is poised for sustained growth, driven by ongoing technological advancements, expansion into new markets, and increasing industrial automation. Strategic opportunities lie in developing eco-friendly products, leveraging smart manufacturing technologies, and forging partnerships to expand into emerging application sectors. Companies that invest in research and development, adapt to evolving market trends, and cultivate strong supply chains will be well-positioned to capitalize on the significant growth potential of the Industrial V-Belt market throughout the forecast period.
Industrial V-Belt Market Segmentation
-
1. Type
- 1.1. Classical V-belt
- 1.2. Narrow V-belt
- 1.3. Wedge V-belt
- 1.4. Banded V-belt
-
2. Material
- 2.1. Rubber Belt
- 2.2. Polyurethane V-belt
- 2.3. Neoprene V-belt
-
3. End-user Vertical
- 3.1. Automotive Industry
- 3.2. Agriculture
- 3.3. Mining and Quarrying
- 3.4. Manufacturing
- 3.5. Construction
- 3.6. HVAC Systems
Industrial V-Belt Market Segmentation By Geography
- 1. North America
- 2. Europe
- 3. Asia
- 4. Australia and New Zealand
- 5. Latin America
- 6. Middle East and Africa

Industrial V-Belt Market Regional Market Share
Geographic Coverage of Industrial V-Belt Market
Industrial V-Belt Market REPORT HIGHLIGHTS
| Aspects | Details |
|---|---|
| Study Period | 2020-2034 |
| Base Year | 2025 |
| Estimated Year | 2026 |
| Forecast Period | 2026-2034 |
| Historical Period | 2020-2025 |
| Growth Rate | CAGR of 5.00% from 2020-2034 |
| Segmentation |
|
Table of Contents
- 1. Introduction
- 1.1. Research Scope
- 1.2. Market Segmentation
- 1.3. Research Objective
- 1.4. Definitions and Assumptions
- 2. Executive Summary
- 2.1. Market Snapshot
- 3. Market Dynamics
- 3.1. Market Drivers
- 3.2. Market Restrains
- 3.3. Market Trends
- 3.4. Market Opportunities
- 4. Market Factor Analysis
- 4.1. Porters Five Forces
- 4.1.1. Bargaining Power of Suppliers
- 4.1.2. Bargaining Power of Buyers
- 4.1.3. Threat of New Entrants
- 4.1.4. Threat of Substitutes
- 4.1.5. Competitive Rivalry
- 4.2. PESTEL analysis
- 4.3. BCG Analysis
- 4.3.1. Stars (High Growth, High Market Share)
- 4.3.2. Cash Cows (Low Growth, High Market Share)
- 4.3.3. Question Mark (High Growth, Low Market Share)
- 4.3.4. Dogs (Low Growth, Low Market Share)
- 4.4. Ansoff Matrix Analysis
- 4.5. Supply Chain Analysis
- 4.6. Regulatory Landscape
- 4.7. Current Market Potential and Opportunity Assessment (TAM–SAM–SOM Framework)
- 4.8. MSR Analyst Note
- 4.1. Porters Five Forces
- 5. Market Analysis, Insights and Forecast 2021-2033
- 5.1. Market Analysis, Insights and Forecast - by Type
- 5.1.1. Classical V-belt
- 5.1.2. Narrow V-belt
- 5.1.3. Wedge V-belt
- 5.1.4. Banded V-belt
- 5.2. Market Analysis, Insights and Forecast - by Material
- 5.2.1. Rubber Belt
- 5.2.2. Polyurethane V-belt
- 5.2.3. Neoprene V-belt
- 5.3. Market Analysis, Insights and Forecast - by End-user Vertical
- 5.3.1. Automotive Industry
- 5.3.2. Agriculture
- 5.3.3. Mining and Quarrying
- 5.3.4. Manufacturing
- 5.3.5. Construction
- 5.3.6. HVAC Systems
- 5.4. Market Analysis, Insights and Forecast - by Region
- 5.4.1. North America
- 5.4.2. Europe
- 5.4.3. Asia
- 5.4.4. Australia and New Zealand
- 5.4.5. Latin America
- 5.4.6. Middle East and Africa
- 5.1. Market Analysis, Insights and Forecast - by Type
- 6. Global Industrial V-Belt Market Analysis, Insights and Forecast, 2021-2033
- 6.1. Market Analysis, Insights and Forecast - by Type
- 6.1.1. Classical V-belt
- 6.1.2. Narrow V-belt
- 6.1.3. Wedge V-belt
- 6.1.4. Banded V-belt
- 6.2. Market Analysis, Insights and Forecast - by Material
- 6.2.1. Rubber Belt
- 6.2.2. Polyurethane V-belt
- 6.2.3. Neoprene V-belt
- 6.3. Market Analysis, Insights and Forecast - by End-user Vertical
- 6.3.1. Automotive Industry
- 6.3.2. Agriculture
- 6.3.3. Mining and Quarrying
- 6.3.4. Manufacturing
- 6.3.5. Construction
- 6.3.6. HVAC Systems
- 6.1. Market Analysis, Insights and Forecast - by Type
- 7. North America Industrial V-Belt Market Analysis, Insights and Forecast, 2020-2032
- 7.1. Market Analysis, Insights and Forecast - by Type
- 7.1.1. Classical V-belt
- 7.1.2. Narrow V-belt
- 7.1.3. Wedge V-belt
- 7.1.4. Banded V-belt
- 7.2. Market Analysis, Insights and Forecast - by Material
- 7.2.1. Rubber Belt
- 7.2.2. Polyurethane V-belt
- 7.2.3. Neoprene V-belt
- 7.3. Market Analysis, Insights and Forecast - by End-user Vertical
- 7.3.1. Automotive Industry
- 7.3.2. Agriculture
- 7.3.3. Mining and Quarrying
- 7.3.4. Manufacturing
- 7.3.5. Construction
- 7.3.6. HVAC Systems
- 7.1. Market Analysis, Insights and Forecast - by Type
- 8. Europe Industrial V-Belt Market Analysis, Insights and Forecast, 2020-2032
- 8.1. Market Analysis, Insights and Forecast - by Type
- 8.1.1. Classical V-belt
- 8.1.2. Narrow V-belt
- 8.1.3. Wedge V-belt
- 8.1.4. Banded V-belt
- 8.2. Market Analysis, Insights and Forecast - by Material
- 8.2.1. Rubber Belt
- 8.2.2. Polyurethane V-belt
- 8.2.3. Neoprene V-belt
- 8.3. Market Analysis, Insights and Forecast - by End-user Vertical
- 8.3.1. Automotive Industry
- 8.3.2. Agriculture
- 8.3.3. Mining and Quarrying
- 8.3.4. Manufacturing
- 8.3.5. Construction
- 8.3.6. HVAC Systems
- 8.1. Market Analysis, Insights and Forecast - by Type
- 9. Asia Industrial V-Belt Market Analysis, Insights and Forecast, 2020-2032
- 9.1. Market Analysis, Insights and Forecast - by Type
- 9.1.1. Classical V-belt
- 9.1.2. Narrow V-belt
- 9.1.3. Wedge V-belt
- 9.1.4. Banded V-belt
- 9.2. Market Analysis, Insights and Forecast - by Material
- 9.2.1. Rubber Belt
- 9.2.2. Polyurethane V-belt
- 9.2.3. Neoprene V-belt
- 9.3. Market Analysis, Insights and Forecast - by End-user Vertical
- 9.3.1. Automotive Industry
- 9.3.2. Agriculture
- 9.3.3. Mining and Quarrying
- 9.3.4. Manufacturing
- 9.3.5. Construction
- 9.3.6. HVAC Systems
- 9.1. Market Analysis, Insights and Forecast - by Type
- 10. Australia and New Zealand Industrial V-Belt Market Analysis, Insights and Forecast, 2020-2032
- 10.1. Market Analysis, Insights and Forecast - by Type
- 10.1.1. Classical V-belt
- 10.1.2. Narrow V-belt
- 10.1.3. Wedge V-belt
- 10.1.4. Banded V-belt
- 10.2. Market Analysis, Insights and Forecast - by Material
- 10.2.1. Rubber Belt
- 10.2.2. Polyurethane V-belt
- 10.2.3. Neoprene V-belt
- 10.3. Market Analysis, Insights and Forecast - by End-user Vertical
- 10.3.1. Automotive Industry
- 10.3.2. Agriculture
- 10.3.3. Mining and Quarrying
- 10.3.4. Manufacturing
- 10.3.5. Construction
- 10.3.6. HVAC Systems
- 10.1. Market Analysis, Insights and Forecast - by Type
- 11. Latin America Industrial V-Belt Market Analysis, Insights and Forecast, 2020-2032
- 11.1. Market Analysis, Insights and Forecast - by Type
- 11.1.1. Classical V-belt
- 11.1.2. Narrow V-belt
- 11.1.3. Wedge V-belt
- 11.1.4. Banded V-belt
- 11.2. Market Analysis, Insights and Forecast - by Material
- 11.2.1. Rubber Belt
- 11.2.2. Polyurethane V-belt
- 11.2.3. Neoprene V-belt
- 11.3. Market Analysis, Insights and Forecast - by End-user Vertical
- 11.3.1. Automotive Industry
- 11.3.2. Agriculture
- 11.3.3. Mining and Quarrying
- 11.3.4. Manufacturing
- 11.3.5. Construction
- 11.3.6. HVAC Systems
- 11.1. Market Analysis, Insights and Forecast - by Type
- 12. Middle East and Africa Industrial V-Belt Market Analysis, Insights and Forecast, 2020-2032
- 12.1. Market Analysis, Insights and Forecast - by Type
- 12.1.1. Classical V-belt
- 12.1.2. Narrow V-belt
- 12.1.3. Wedge V-belt
- 12.1.4. Banded V-belt
- 12.2. Market Analysis, Insights and Forecast - by Material
- 12.2.1. Rubber Belt
- 12.2.2. Polyurethane V-belt
- 12.2.3. Neoprene V-belt
- 12.3. Market Analysis, Insights and Forecast - by End-user Vertical
- 12.3.1. Automotive Industry
- 12.3.2. Agriculture
- 12.3.3. Mining and Quarrying
- 12.3.4. Manufacturing
- 12.3.5. Construction
- 12.3.6. HVAC Systems
- 12.1. Market Analysis, Insights and Forecast - by Type
- 13. Competitive Analysis
- 13.1. Company Profiles
- 13.1.1 Gates Corporation
- 13.1.1.1. Company Overview
- 13.1.1.2. Products
- 13.1.1.3. Company Financials
- 13.1.1.4. SWOT Analysis
- 13.1.2 ContiTech Deutschland GmbH
- 13.1.2.1. Company Overview
- 13.1.2.2. Products
- 13.1.2.3. Company Financials
- 13.1.2.4. SWOT Analysis
- 13.1.3 Mitsuboshi Belting Ltd
- 13.1.3.1. Company Overview
- 13.1.3.2. Products
- 13.1.3.3. Company Financials
- 13.1.3.4. SWOT Analysis
- 13.1.4 Fenner Drives Inc
- 13.1.4.1. Company Overview
- 13.1.4.2. Products
- 13.1.4.3. Company Financials
- 13.1.4.4. SWOT Analysis
- 13.1.5 Optibelt GmbH
- 13.1.5.1. Company Overview
- 13.1.5.2. Products
- 13.1.5.3. Company Financials
- 13.1.5.4. SWOT Analysis
- 13.1.6 Bando Chemical Industries Ltd
- 13.1.6.1. Company Overview
- 13.1.6.2. Products
- 13.1.6.3. Company Financials
- 13.1.6.4. SWOT Analysis
- 13.1.7 SFK Group
- 13.1.7.1. Company Overview
- 13.1.7.2. Products
- 13.1.7.3. Company Financials
- 13.1.7.4. SWOT Analysis
- 13.1.8 Hutchinson
- 13.1.8.1. Company Overview
- 13.1.8.2. Products
- 13.1.8.3. Company Financials
- 13.1.8.4. SWOT Analysis
- 13.1.9 PIX Transmissions Ltd
- 13.1.9.1. Company Overview
- 13.1.9.2. Products
- 13.1.9.3. Company Financials
- 13.1.9.4. SWOT Analysis
- 13.1.10 Timken Belts
- 13.1.10.1. Company Overview
- 13.1.10.2. Products
- 13.1.10.3. Company Financials
- 13.1.10.4. SWOT Analysis
- 13.1.11 Zhejiang Sanlux Rubber Co Ltd
- 13.1.11.1. Company Overview
- 13.1.11.2. Products
- 13.1.11.3. Company Financials
- 13.1.11.4. SWOT Analysis
- 13.1.12 PowerDrive LLC
- 13.1.12.1. Company Overview
- 13.1.12.2. Products
- 13.1.12.3. Company Financials
- 13.1.12.4. SWOT Analysis
- 13.1.13 BEHA Innovation GmbH*List Not Exhaustive
- 13.1.13.1. Company Overview
- 13.1.13.2. Products
- 13.1.13.3. Company Financials
- 13.1.13.4. SWOT Analysis
- 13.1.1 Gates Corporation
- 13.2. Market Entropy
- 13.2.1 Company's Key Areas Served
- 13.2.2 Recent Developments
- 13.3. Company Market Share Analysis 2025
- 13.3.1 Top 5 Companies Market Share Analysis
- 13.3.2 Top 3 Companies Market Share Analysis
- 13.4. List of Potential Customers
- 14. Research Methodology
List of Figures
- Figure 1: Global Industrial V-Belt Market Revenue Breakdown (Million, %) by Region 2025 & 2033
- Figure 2: Global Industrial V-Belt Market Volume Breakdown (Billion, %) by Region 2025 & 2033
- Figure 3: North America Industrial V-Belt Market Revenue (Million), by Type 2025 & 2033
- Figure 4: North America Industrial V-Belt Market Volume (Billion), by Type 2025 & 2033
- Figure 5: North America Industrial V-Belt Market Revenue Share (%), by Type 2025 & 2033
- Figure 6: North America Industrial V-Belt Market Volume Share (%), by Type 2025 & 2033
- Figure 7: North America Industrial V-Belt Market Revenue (Million), by Material 2025 & 2033
- Figure 8: North America Industrial V-Belt Market Volume (Billion), by Material 2025 & 2033
- Figure 9: North America Industrial V-Belt Market Revenue Share (%), by Material 2025 & 2033
- Figure 10: North America Industrial V-Belt Market Volume Share (%), by Material 2025 & 2033
- Figure 11: North America Industrial V-Belt Market Revenue (Million), by End-user Vertical 2025 & 2033
- Figure 12: North America Industrial V-Belt Market Volume (Billion), by End-user Vertical 2025 & 2033
- Figure 13: North America Industrial V-Belt Market Revenue Share (%), by End-user Vertical 2025 & 2033
- Figure 14: North America Industrial V-Belt Market Volume Share (%), by End-user Vertical 2025 & 2033
- Figure 15: North America Industrial V-Belt Market Revenue (Million), by Country 2025 & 2033
- Figure 16: North America Industrial V-Belt Market Volume (Billion), by Country 2025 & 2033
- Figure 17: North America Industrial V-Belt Market Revenue Share (%), by Country 2025 & 2033
- Figure 18: North America Industrial V-Belt Market Volume Share (%), by Country 2025 & 2033
- Figure 19: Europe Industrial V-Belt Market Revenue (Million), by Type 2025 & 2033
- Figure 20: Europe Industrial V-Belt Market Volume (Billion), by Type 2025 & 2033
- Figure 21: Europe Industrial V-Belt Market Revenue Share (%), by Type 2025 & 2033
- Figure 22: Europe Industrial V-Belt Market Volume Share (%), by Type 2025 & 2033
- Figure 23: Europe Industrial V-Belt Market Revenue (Million), by Material 2025 & 2033
- Figure 24: Europe Industrial V-Belt Market Volume (Billion), by Material 2025 & 2033
- Figure 25: Europe Industrial V-Belt Market Revenue Share (%), by Material 2025 & 2033
- Figure 26: Europe Industrial V-Belt Market Volume Share (%), by Material 2025 & 2033
- Figure 27: Europe Industrial V-Belt Market Revenue (Million), by End-user Vertical 2025 & 2033
- Figure 28: Europe Industrial V-Belt Market Volume (Billion), by End-user Vertical 2025 & 2033
- Figure 29: Europe Industrial V-Belt Market Revenue Share (%), by End-user Vertical 2025 & 2033
- Figure 30: Europe Industrial V-Belt Market Volume Share (%), by End-user Vertical 2025 & 2033
- Figure 31: Europe Industrial V-Belt Market Revenue (Million), by Country 2025 & 2033
- Figure 32: Europe Industrial V-Belt Market Volume (Billion), by Country 2025 & 2033
- Figure 33: Europe Industrial V-Belt Market Revenue Share (%), by Country 2025 & 2033
- Figure 34: Europe Industrial V-Belt Market Volume Share (%), by Country 2025 & 2033
- Figure 35: Asia Industrial V-Belt Market Revenue (Million), by Type 2025 & 2033
- Figure 36: Asia Industrial V-Belt Market Volume (Billion), by Type 2025 & 2033
- Figure 37: Asia Industrial V-Belt Market Revenue Share (%), by Type 2025 & 2033
- Figure 38: Asia Industrial V-Belt Market Volume Share (%), by Type 2025 & 2033
- Figure 39: Asia Industrial V-Belt Market Revenue (Million), by Material 2025 & 2033
- Figure 40: Asia Industrial V-Belt Market Volume (Billion), by Material 2025 & 2033
- Figure 41: Asia Industrial V-Belt Market Revenue Share (%), by Material 2025 & 2033
- Figure 42: Asia Industrial V-Belt Market Volume Share (%), by Material 2025 & 2033
- Figure 43: Asia Industrial V-Belt Market Revenue (Million), by End-user Vertical 2025 & 2033
- Figure 44: Asia Industrial V-Belt Market Volume (Billion), by End-user Vertical 2025 & 2033
- Figure 45: Asia Industrial V-Belt Market Revenue Share (%), by End-user Vertical 2025 & 2033
- Figure 46: Asia Industrial V-Belt Market Volume Share (%), by End-user Vertical 2025 & 2033
- Figure 47: Asia Industrial V-Belt Market Revenue (Million), by Country 2025 & 2033
- Figure 48: Asia Industrial V-Belt Market Volume (Billion), by Country 2025 & 2033
- Figure 49: Asia Industrial V-Belt Market Revenue Share (%), by Country 2025 & 2033
- Figure 50: Asia Industrial V-Belt Market Volume Share (%), by Country 2025 & 2033
- Figure 51: Australia and New Zealand Industrial V-Belt Market Revenue (Million), by Type 2025 & 2033
- Figure 52: Australia and New Zealand Industrial V-Belt Market Volume (Billion), by Type 2025 & 2033
- Figure 53: Australia and New Zealand Industrial V-Belt Market Revenue Share (%), by Type 2025 & 2033
- Figure 54: Australia and New Zealand Industrial V-Belt Market Volume Share (%), by Type 2025 & 2033
- Figure 55: Australia and New Zealand Industrial V-Belt Market Revenue (Million), by Material 2025 & 2033
- Figure 56: Australia and New Zealand Industrial V-Belt Market Volume (Billion), by Material 2025 & 2033
- Figure 57: Australia and New Zealand Industrial V-Belt Market Revenue Share (%), by Material 2025 & 2033
- Figure 58: Australia and New Zealand Industrial V-Belt Market Volume Share (%), by Material 2025 & 2033
- Figure 59: Australia and New Zealand Industrial V-Belt Market Revenue (Million), by End-user Vertical 2025 & 2033
- Figure 60: Australia and New Zealand Industrial V-Belt Market Volume (Billion), by End-user Vertical 2025 & 2033
- Figure 61: Australia and New Zealand Industrial V-Belt Market Revenue Share (%), by End-user Vertical 2025 & 2033
- Figure 62: Australia and New Zealand Industrial V-Belt Market Volume Share (%), by End-user Vertical 2025 & 2033
- Figure 63: Australia and New Zealand Industrial V-Belt Market Revenue (Million), by Country 2025 & 2033
- Figure 64: Australia and New Zealand Industrial V-Belt Market Volume (Billion), by Country 2025 & 2033
- Figure 65: Australia and New Zealand Industrial V-Belt Market Revenue Share (%), by Country 2025 & 2033
- Figure 66: Australia and New Zealand Industrial V-Belt Market Volume Share (%), by Country 2025 & 2033
- Figure 67: Latin America Industrial V-Belt Market Revenue (Million), by Type 2025 & 2033
- Figure 68: Latin America Industrial V-Belt Market Volume (Billion), by Type 2025 & 2033
- Figure 69: Latin America Industrial V-Belt Market Revenue Share (%), by Type 2025 & 2033
- Figure 70: Latin America Industrial V-Belt Market Volume Share (%), by Type 2025 & 2033
- Figure 71: Latin America Industrial V-Belt Market Revenue (Million), by Material 2025 & 2033
- Figure 72: Latin America Industrial V-Belt Market Volume (Billion), by Material 2025 & 2033
- Figure 73: Latin America Industrial V-Belt Market Revenue Share (%), by Material 2025 & 2033
- Figure 74: Latin America Industrial V-Belt Market Volume Share (%), by Material 2025 & 2033
- Figure 75: Latin America Industrial V-Belt Market Revenue (Million), by End-user Vertical 2025 & 2033
- Figure 76: Latin America Industrial V-Belt Market Volume (Billion), by End-user Vertical 2025 & 2033
- Figure 77: Latin America Industrial V-Belt Market Revenue Share (%), by End-user Vertical 2025 & 2033
- Figure 78: Latin America Industrial V-Belt Market Volume Share (%), by End-user Vertical 2025 & 2033
- Figure 79: Latin America Industrial V-Belt Market Revenue (Million), by Country 2025 & 2033
- Figure 80: Latin America Industrial V-Belt Market Volume (Billion), by Country 2025 & 2033
- Figure 81: Latin America Industrial V-Belt Market Revenue Share (%), by Country 2025 & 2033
- Figure 82: Latin America Industrial V-Belt Market Volume Share (%), by Country 2025 & 2033
- Figure 83: Middle East and Africa Industrial V-Belt Market Revenue (Million), by Type 2025 & 2033
- Figure 84: Middle East and Africa Industrial V-Belt Market Volume (Billion), by Type 2025 & 2033
- Figure 85: Middle East and Africa Industrial V-Belt Market Revenue Share (%), by Type 2025 & 2033
- Figure 86: Middle East and Africa Industrial V-Belt Market Volume Share (%), by Type 2025 & 2033
- Figure 87: Middle East and Africa Industrial V-Belt Market Revenue (Million), by Material 2025 & 2033
- Figure 88: Middle East and Africa Industrial V-Belt Market Volume (Billion), by Material 2025 & 2033
- Figure 89: Middle East and Africa Industrial V-Belt Market Revenue Share (%), by Material 2025 & 2033
- Figure 90: Middle East and Africa Industrial V-Belt Market Volume Share (%), by Material 2025 & 2033
- Figure 91: Middle East and Africa Industrial V-Belt Market Revenue (Million), by End-user Vertical 2025 & 2033
- Figure 92: Middle East and Africa Industrial V-Belt Market Volume (Billion), by End-user Vertical 2025 & 2033
- Figure 93: Middle East and Africa Industrial V-Belt Market Revenue Share (%), by End-user Vertical 2025 & 2033
- Figure 94: Middle East and Africa Industrial V-Belt Market Volume Share (%), by End-user Vertical 2025 & 2033
- Figure 95: Middle East and Africa Industrial V-Belt Market Revenue (Million), by Country 2025 & 2033
- Figure 96: Middle East and Africa Industrial V-Belt Market Volume (Billion), by Country 2025 & 2033
- Figure 97: Middle East and Africa Industrial V-Belt Market Revenue Share (%), by Country 2025 & 2033
- Figure 98: Middle East and Africa Industrial V-Belt Market Volume Share (%), by Country 2025 & 2033
List of Tables
- Table 1: Global Industrial V-Belt Market Revenue Million Forecast, by Type 2020 & 2033
- Table 2: Global Industrial V-Belt Market Volume Billion Forecast, by Type 2020 & 2033
- Table 3: Global Industrial V-Belt Market Revenue Million Forecast, by Material 2020 & 2033
- Table 4: Global Industrial V-Belt Market Volume Billion Forecast, by Material 2020 & 2033
- Table 5: Global Industrial V-Belt Market Revenue Million Forecast, by End-user Vertical 2020 & 2033
- Table 6: Global Industrial V-Belt Market Volume Billion Forecast, by End-user Vertical 2020 & 2033
- Table 7: Global Industrial V-Belt Market Revenue Million Forecast, by Region 2020 & 2033
- Table 8: Global Industrial V-Belt Market Volume Billion Forecast, by Region 2020 & 2033
- Table 9: Global Industrial V-Belt Market Revenue Million Forecast, by Type 2020 & 2033
- Table 10: Global Industrial V-Belt Market Volume Billion Forecast, by Type 2020 & 2033
- Table 11: Global Industrial V-Belt Market Revenue Million Forecast, by Material 2020 & 2033
- Table 12: Global Industrial V-Belt Market Volume Billion Forecast, by Material 2020 & 2033
- Table 13: Global Industrial V-Belt Market Revenue Million Forecast, by End-user Vertical 2020 & 2033
- Table 14: Global Industrial V-Belt Market Volume Billion Forecast, by End-user Vertical 2020 & 2033
- Table 15: Global Industrial V-Belt Market Revenue Million Forecast, by Country 2020 & 2033
- Table 16: Global Industrial V-Belt Market Volume Billion Forecast, by Country 2020 & 2033
- Table 17: Global Industrial V-Belt Market Revenue Million Forecast, by Type 2020 & 2033
- Table 18: Global Industrial V-Belt Market Volume Billion Forecast, by Type 2020 & 2033
- Table 19: Global Industrial V-Belt Market Revenue Million Forecast, by Material 2020 & 2033
- Table 20: Global Industrial V-Belt Market Volume Billion Forecast, by Material 2020 & 2033
- Table 21: Global Industrial V-Belt Market Revenue Million Forecast, by End-user Vertical 2020 & 2033
- Table 22: Global Industrial V-Belt Market Volume Billion Forecast, by End-user Vertical 2020 & 2033
- Table 23: Global Industrial V-Belt Market Revenue Million Forecast, by Country 2020 & 2033
- Table 24: Global Industrial V-Belt Market Volume Billion Forecast, by Country 2020 & 2033
- Table 25: Global Industrial V-Belt Market Revenue Million Forecast, by Type 2020 & 2033
- Table 26: Global Industrial V-Belt Market Volume Billion Forecast, by Type 2020 & 2033
- Table 27: Global Industrial V-Belt Market Revenue Million Forecast, by Material 2020 & 2033
- Table 28: Global Industrial V-Belt Market Volume Billion Forecast, by Material 2020 & 2033
- Table 29: Global Industrial V-Belt Market Revenue Million Forecast, by End-user Vertical 2020 & 2033
- Table 30: Global Industrial V-Belt Market Volume Billion Forecast, by End-user Vertical 2020 & 2033
- Table 31: Global Industrial V-Belt Market Revenue Million Forecast, by Country 2020 & 2033
- Table 32: Global Industrial V-Belt Market Volume Billion Forecast, by Country 2020 & 2033
- Table 33: Global Industrial V-Belt Market Revenue Million Forecast, by Type 2020 & 2033
- Table 34: Global Industrial V-Belt Market Volume Billion Forecast, by Type 2020 & 2033
- Table 35: Global Industrial V-Belt Market Revenue Million Forecast, by Material 2020 & 2033
- Table 36: Global Industrial V-Belt Market Volume Billion Forecast, by Material 2020 & 2033
- Table 37: Global Industrial V-Belt Market Revenue Million Forecast, by End-user Vertical 2020 & 2033
- Table 38: Global Industrial V-Belt Market Volume Billion Forecast, by End-user Vertical 2020 & 2033
- Table 39: Global Industrial V-Belt Market Revenue Million Forecast, by Country 2020 & 2033
- Table 40: Global Industrial V-Belt Market Volume Billion Forecast, by Country 2020 & 2033
- Table 41: Global Industrial V-Belt Market Revenue Million Forecast, by Type 2020 & 2033
- Table 42: Global Industrial V-Belt Market Volume Billion Forecast, by Type 2020 & 2033
- Table 43: Global Industrial V-Belt Market Revenue Million Forecast, by Material 2020 & 2033
- Table 44: Global Industrial V-Belt Market Volume Billion Forecast, by Material 2020 & 2033
- Table 45: Global Industrial V-Belt Market Revenue Million Forecast, by End-user Vertical 2020 & 2033
- Table 46: Global Industrial V-Belt Market Volume Billion Forecast, by End-user Vertical 2020 & 2033
- Table 47: Global Industrial V-Belt Market Revenue Million Forecast, by Country 2020 & 2033
- Table 48: Global Industrial V-Belt Market Volume Billion Forecast, by Country 2020 & 2033
- Table 49: Global Industrial V-Belt Market Revenue Million Forecast, by Type 2020 & 2033
- Table 50: Global Industrial V-Belt Market Volume Billion Forecast, by Type 2020 & 2033
- Table 51: Global Industrial V-Belt Market Revenue Million Forecast, by Material 2020 & 2033
- Table 52: Global Industrial V-Belt Market Volume Billion Forecast, by Material 2020 & 2033
- Table 53: Global Industrial V-Belt Market Revenue Million Forecast, by End-user Vertical 2020 & 2033
- Table 54: Global Industrial V-Belt Market Volume Billion Forecast, by End-user Vertical 2020 & 2033
- Table 55: Global Industrial V-Belt Market Revenue Million Forecast, by Country 2020 & 2033
- Table 56: Global Industrial V-Belt Market Volume Billion Forecast, by Country 2020 & 2033
Frequently Asked Questions
1. What is the projected Compound Annual Growth Rate (CAGR) of the Industrial V-Belt Market?
The projected CAGR is approximately 5.00%.
2. Which companies are prominent players in the Industrial V-Belt Market?
Key companies in the market include Gates Corporation, ContiTech Deutschland GmbH, Mitsuboshi Belting Ltd, Fenner Drives Inc, Optibelt GmbH, Bando Chemical Industries Ltd, SFK Group, Hutchinson, PIX Transmissions Ltd, Timken Belts, Zhejiang Sanlux Rubber Co Ltd, PowerDrive LLC, BEHA Innovation GmbH*List Not Exhaustive.
3. What are the main segments of the Industrial V-Belt Market?
The market segments include Type, Material, End-user Vertical.
4. Can you provide details about the market size?
The market size is estimated to be USD 1.5 Million as of 2022.
5. What are some drivers contributing to market growth?
Industrial Automation Growth; Maintenance and Replacement Demand.
6. What are the notable trends driving market growth?
The Automotive Industry is Projected to Witness Strong Demand.
7. Are there any restraints impacting market growth?
Industrial Automation Growth; Maintenance and Replacement Demand.
8. Can you provide examples of recent developments in the market?
August 2024: Gates Corporation is enhancing its bandless V-belt lineup. The composition of the Super High Capacity (HC) Molded Notch (MN) V-belt will transition from standard chloroprene rubber (CR) materials to advanced ethylene elastomer (EE) compounds. Furthermore, in July 2024, the company began producing its EE Tri-Power V-belts in Europe, ensuring reduced lead times and improved availability.March 2024: V-Belt manufacturer Dayco Inc. inaugurated its new plant in San Luis Potosí, Mexico, located in the Tres Naciones Park, in the Industrial Zone of the state. The new plant will be used to produce belts for light combustion cars, with its molded tooth design that operates more quietly and efficiently. In terms of its scale and capacity, the facility covers 73,000 sq. ft and is equipped with state-of-the-art machinery that can produce up to 4.2 million Poly-V belts annually,
9. What pricing options are available for accessing the report?
Pricing options include single-user, multi-user, and enterprise licenses priced at USD 4750, USD 5250, and USD 8750 respectively.
10. Is the market size provided in terms of value or volume?
The market size is provided in terms of value, measured in Million and volume, measured in Billion.
11. Are there any specific market keywords associated with the report?
Yes, the market keyword associated with the report is "Industrial V-Belt Market," which aids in identifying and referencing the specific market segment covered.
12. How do I determine which pricing option suits my needs best?
The pricing options vary based on user requirements and access needs. Individual users may opt for single-user licenses, while businesses requiring broader access may choose multi-user or enterprise licenses for cost-effective access to the report.
13. Are there any additional resources or data provided in the Industrial V-Belt Market report?
While the report offers comprehensive insights, it's advisable to review the specific contents or supplementary materials provided to ascertain if additional resources or data are available.
14. How can I stay updated on further developments or reports in the Industrial V-Belt Market?
To stay informed about further developments, trends, and reports in the Industrial V-Belt Market, consider subscribing to industry newsletters, following relevant companies and organizations, or regularly checking reputable industry news sources and publications.
Methodology
Step 1 - Identification of Relevant Samples Size from Population Database


Step 2 - Approaches for Defining Global Market Size (Value, Volume* & Price*)

Note*: In applicable scenarios
Step 3 - Data Sources
Primary Research
- Web Analytics
- Survey Reports
- Research Institute
- Latest Research Reports
- Opinion Leaders
Secondary Research
- Annual Reports
- White Paper
- Latest Press Release
- Industry Association
- Paid Database
- Investor Presentations

Step 4 - Data Triangulation
Involves using different sources of information in order to increase the validity of a study
These sources are likely to be stakeholders in a program - participants, other researchers, program staff, other community members, and so on.
Then we put all data in single framework & apply various statistical tools to find out the dynamic on the market.
During the analysis stage, feedback from the stakeholder groups would be compared to determine areas of agreement as well as areas of divergence