

Key Insights
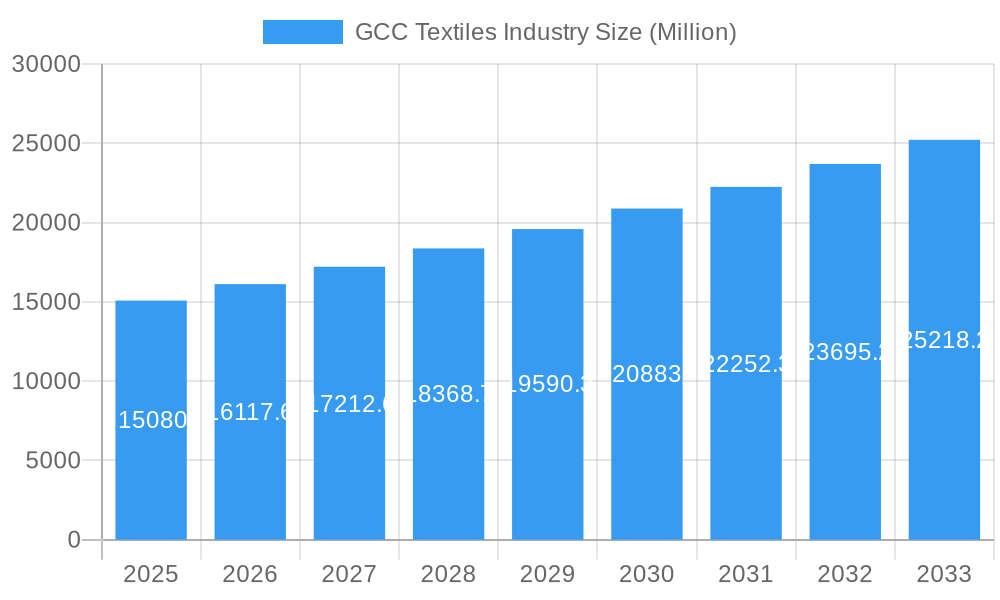
The GCC textiles industry, valued at $15.08 billion in 2025, is projected to experience robust growth, driven by a Compound Annual Growth Rate (CAGR) of 6.78% from 2025 to 2033. This expansion is fueled by several key factors. Firstly, increasing tourism and population growth within the GCC region are boosting demand for apparel and home textiles. Secondly, significant investments in infrastructure development and mega-projects are creating substantial opportunities for the textile sector, particularly in areas like hospitality and construction, requiring large quantities of textiles for furnishings and uniforms. Furthermore, the growing adoption of sustainable and technologically advanced textile manufacturing practices enhances the industry's competitiveness and appeal to environmentally conscious consumers. The presence of established players like Unirab & Polvara Spinning Weaving & Silk, Misr Amreya, and AMCO, alongside emerging companies, indicates a dynamic and competitive market landscape. However, challenges remain. Fluctuations in global cotton prices and increased competition from international textile producers could pose constraints on growth. Government initiatives promoting local textile production and diversification into niche segments like technical textiles are expected to mitigate some of these challenges.
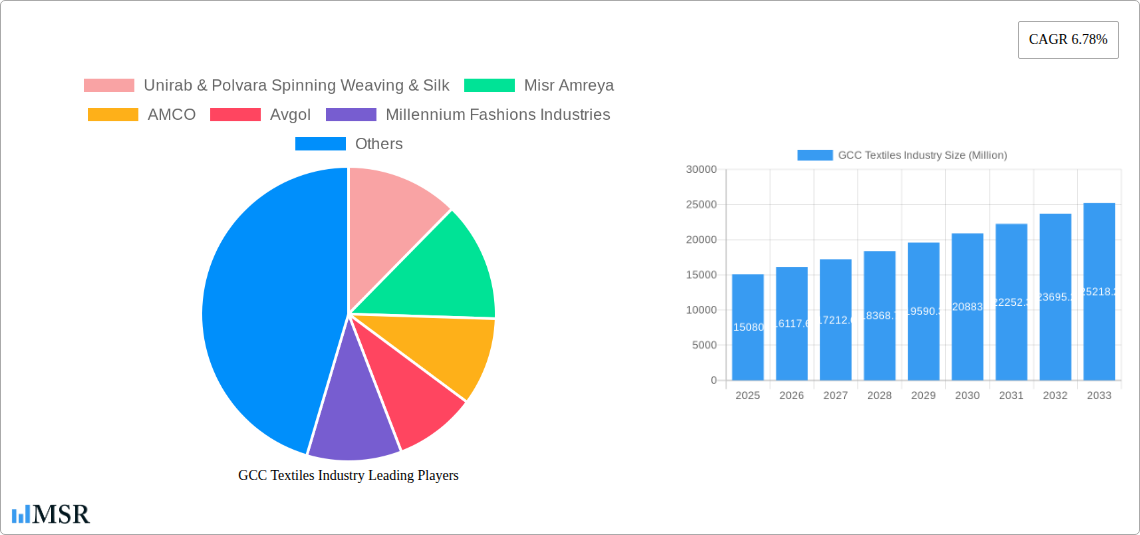
GCC Textiles Industry Market Size (In Billion)
The segmentation of the GCC textiles market likely includes diverse categories such as apparel (ready-made garments, traditional wear), home textiles (bedding, upholstery), technical textiles (industrial fabrics, protective gear), and yarn/fiber production. Analysis of company profiles reveals a mix of large-scale integrated manufacturers and specialized producers catering to different segments. Regional variations within the GCC are anticipated, with some countries experiencing higher growth rates than others, based on their individual economic development strategies and consumer preferences. The forecast period (2025-2033) promises continued expansion, albeit at a potentially fluctuating pace due to external economic factors. Strategic partnerships, technological upgrades, and diversification into value-added products will be crucial for companies to maintain a competitive edge in this evolving market.
GCC Textiles Industry Company Market Share
GCC Textiles Industry: Market Analysis & Forecast 2019-2033
This comprehensive report provides a detailed analysis of the GCC textiles industry, covering market size, growth drivers, key players, and future trends. With a study period spanning 2019-2033, a base year of 2025, and a forecast period of 2025-2033, this report offers invaluable insights for industry stakeholders, investors, and strategists. The report analyzes the market dynamics of over $xx Million and provides actionable recommendations for navigating the evolving landscape of this dynamic sector.
GCC Textiles Industry Market Concentration & Dynamics
The GCC textiles industry exhibits a moderately concentrated market structure, with a few dominant players and a large number of smaller firms. Market share data for 2024 reveals that the top five players account for approximately xx% of the total market value ($xx Million). Innovation within the GCC textile sector is driven by investments in advanced technologies like automation and sustainable materials, primarily concentrated in the UAE and Saudi Arabia. These ecosystems are further strengthened by governmental support for R&D and industry clusters.
The regulatory framework varies across GCC nations, impacting manufacturing processes, labor practices, and environmental compliance. Existing regulations and potential policy changes are significant factors in determining investment decisions and market competitiveness. The industry faces competition from substitutes such as synthetic fabrics and imported textiles, placing pressure on pricing and product differentiation.
End-user trends indicate a growing preference for sustainable, high-quality, and technologically advanced textiles. This shift is fueling demand for innovative products and sustainable manufacturing practices. Recent years have witnessed significant M&A activity in the sector, with xx M&A deals recorded between 2019 and 2024, indicating consolidation and strategic expansion.
GCC Textiles Industry Industry Insights & Trends
The GCC textiles market is projected to reach $xx Million by 2025, exhibiting a CAGR of xx% during the forecast period (2025-2033). Several factors contribute to this robust growth, including: rising disposable incomes; increasing urbanization leading to higher fashion apparel consumption; and ongoing government investments to diversify economies away from oil and towards manufacturing and export-oriented industries.
Technological disruptions are transforming the industry. The integration of automation, AI-powered design, and advanced manufacturing techniques is boosting efficiency and improving product quality. Consumer preferences are shifting towards eco-friendly textiles, prompting manufacturers to adopt sustainable practices and explore innovative materials. This includes a rise in demand for recycled fabrics and materials with reduced environmental impact.
Key Markets & Segments Leading GCC Textiles Industry
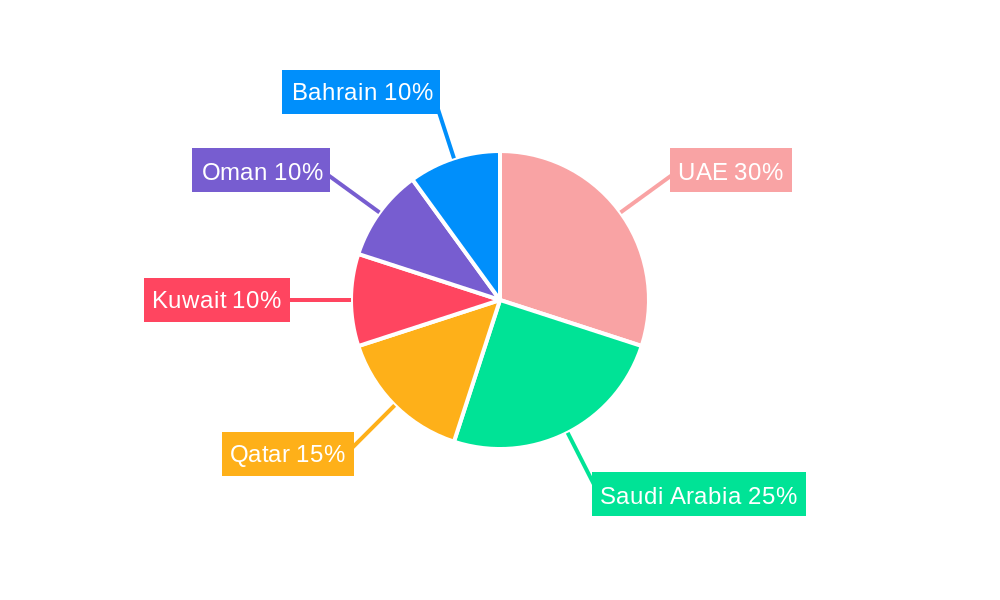
The UAE and Saudi Arabia represent the most dominant markets within the GCC, driving over xx% of the total market value ($xx Million). This dominance is attributed to various factors:
- Economic Growth: Strong GDP growth and high consumer spending power in both nations fuel demand for textiles.
- Infrastructure Development: Well-established infrastructure, including port facilities and logistics networks, supports the efficient import and export of textile products.
- Government Support: Government initiatives promoting industrial diversification and economic development create a favorable environment for textile businesses.
- Tourism: The robust tourism sectors in both countries drive demand for textiles in hospitality and tourism-related businesses.
Detailed analysis indicates that the apparel segment is the largest contributor to the overall market value, closely followed by the home textiles segment. This trend is expected to persist due to the growing urban population and rising living standards within the GCC region.
GCC Textiles Industry Product Developments
Recent product innovations focus on performance-enhancing textiles, sustainable materials, and customized products. The integration of nanotechnology and smart fabrics is revolutionizing textile applications in areas such as sportswear and healthcare. These advancements provide competitive edges by catering to niche markets and enhancing product value propositions.
Challenges in the GCC Textiles Industry Market
The GCC textiles industry faces several challenges, including:
- High labor costs: A significant portion of production costs are attributed to labor, impacting profitability.
- Competition from imports: The influx of cheaper textiles from other countries poses a considerable challenge to local manufacturers.
- Supply chain disruptions: Global supply chain volatility, exacerbated by recent geopolitical events, can affect raw material availability and production schedules.
These factors, if not addressed strategically, could impede the long-term growth of the industry. Furthermore, environmental regulations are increasingly stringent, placing pressure on manufacturers to adopt eco-friendly practices.
Forces Driving GCC Textiles Industry Growth
Key growth drivers include:
- Government support for the textile sector: Significant investments and initiatives are propelling industry development.
- Technological advancements: Automation and innovation are boosting efficiency and product quality.
- Rising disposable incomes: Increased consumer spending fuels demand for textiles.
Challenges in the GCC Textiles Industry Market
Long-term growth hinges on strategic partnerships, technological innovation, and the adoption of sustainable practices. Further investment in research and development, combined with collaborations with international companies, will be key to unlocking the industry's full potential.
Emerging Opportunities in GCC Textiles Industry
Emerging opportunities include:
- Growing demand for sustainable and eco-friendly textiles: This presents a significant opportunity for manufacturers to innovate and cater to environmentally conscious consumers.
- Expansion into niche markets: Specialization in high-value textile products, like technical textiles, offers considerable growth potential.
- Adoption of e-commerce and digital marketing: Leveraging online platforms to reach a broader customer base is crucial for market penetration.
Leading Players in the GCC Textiles Industry Sector
- Unirab & Polvara Spinning Weaving & Silk
- Misr Amreya
- AMCO
- Avgol
- Millennium Fashions Industries
- Embee Group
- Kabale
- FPC Coated Technical Textiles
- Alyaf Industrial Company Ltd
- Aratex Group
- Lomar Selection
- Valleystar Uniforms
List Not Exhaustive
Key Milestones in GCC Textiles Industry Industry
- February 2023: Saudi’s MODON announces USD 1.1bn textile investments across 125 contracts in 19 industrial cities, covering over one million square meters. This signifies a major boost to the Saudi Arabian textile industry and demonstrates government commitment to expanding the sector.
- October 2022: Nykaa's partnership with Apparel Group marks a significant entry into the GCC market, expanding the reach of fashion and cosmetics within the region. This collaboration is expected to increase competition and drive innovation.
Strategic Outlook for GCC Textiles Industry Market
The GCC textiles industry presents a robust growth trajectory, driven by increasing demand, government support, and technological advancements. Strategic investments in sustainability, innovation, and digitalization will be crucial for companies to capitalize on emerging opportunities and maintain competitiveness in the global textile market. The focus on value-added products and strategic partnerships will be pivotal to the sector's continued success.
GCC Textiles Industry Segmentation
-
1. Application
- 1.1. Clothing
- 1.2. Industrial/Technical Applications
- 1.3. Household Applications
-
2. Material Type
- 2.1. Cotton
- 2.2. Jute
- 2.3. Silk
- 2.4. Synthetics
- 2.5. Wool
-
3. Process
- 3.1. Woven
- 3.2. Non-woven
GCC Textiles Industry Segmentation By Geography
-
1. North America
- 1.1. United States
- 1.2. Canada
- 1.3. Mexico
-
2. South America
- 2.1. Brazil
- 2.2. Argentina
- 2.3. Rest of South America
-
3. Europe
- 3.1. United Kingdom
- 3.2. Germany
- 3.3. France
- 3.4. Italy
- 3.5. Spain
- 3.6. Russia
- 3.7. Benelux
- 3.8. Nordics
- 3.9. Rest of Europe
-
4. Middle East & Africa
- 4.1. Turkey
- 4.2. Israel
- 4.3. GCC
- 4.4. North Africa
- 4.5. South Africa
- 4.6. Rest of Middle East & Africa
-
5. Asia Pacific
- 5.1. China
- 5.2. India
- 5.3. Japan
- 5.4. South Korea
- 5.5. ASEAN
- 5.6. Oceania
- 5.7. Rest of Asia Pacific
GCC Textiles Industry Regional Market Share
Geographic Coverage of GCC Textiles Industry
GCC Textiles Industry REPORT HIGHLIGHTS
| Aspects | Details |
|---|---|
| Study Period | 2020-2034 |
| Base Year | 2025 |
| Estimated Year | 2026 |
| Forecast Period | 2026-2034 |
| Historical Period | 2020-2025 |
| Growth Rate | CAGR of 6.78% from 2020-2034 |
| Segmentation |
|
Table of Contents
- 1. Introduction
- 1.1. Research Scope
- 1.2. Market Segmentation
- 1.3. Research Objective
- 1.4. Definitions and Assumptions
- 2. Executive Summary
- 2.1. Market Snapshot
- 3. Market Dynamics
- 3.1. Market Drivers
- 3.2. Market Restrains
- 3.3. Market Trends
- 3.4. Market Opportunities
- 4. Market Factor Analysis
- 4.1. Porters Five Forces
- 4.1.1. Bargaining Power of Suppliers
- 4.1.2. Bargaining Power of Buyers
- 4.1.3. Threat of New Entrants
- 4.1.4. Threat of Substitutes
- 4.1.5. Competitive Rivalry
- 4.2. PESTEL analysis
- 4.3. BCG Analysis
- 4.3.1. Stars (High Growth, High Market Share)
- 4.3.2. Cash Cows (Low Growth, High Market Share)
- 4.3.3. Question Mark (High Growth, Low Market Share)
- 4.3.4. Dogs (Low Growth, Low Market Share)
- 4.4. Ansoff Matrix Analysis
- 4.5. Supply Chain Analysis
- 4.6. Regulatory Landscape
- 4.7. Current Market Potential and Opportunity Assessment (TAM–SAM–SOM Framework)
- 4.8. MSR Analyst Note
- 4.1. Porters Five Forces
- 5. Market Analysis, Insights and Forecast 2021-2033
- 5.1. Market Analysis, Insights and Forecast - by Application
- 5.1.1. Clothing
- 5.1.2. Industrial/Technical Applications
- 5.1.3. Household Applications
- 5.2. Market Analysis, Insights and Forecast - by Material Type
- 5.2.1. Cotton
- 5.2.2. Jute
- 5.2.3. Silk
- 5.2.4. Synthetics
- 5.2.5. Wool
- 5.3. Market Analysis, Insights and Forecast - by Process
- 5.3.1. Woven
- 5.3.2. Non-woven
- 5.4. Market Analysis, Insights and Forecast - by Region
- 5.4.1. North America
- 5.4.2. South America
- 5.4.3. Europe
- 5.4.4. Middle East & Africa
- 5.4.5. Asia Pacific
- 5.1. Market Analysis, Insights and Forecast - by Application
- 6. Global GCC Textiles Industry Analysis, Insights and Forecast, 2021-2033
- 6.1. Market Analysis, Insights and Forecast - by Application
- 6.1.1. Clothing
- 6.1.2. Industrial/Technical Applications
- 6.1.3. Household Applications
- 6.2. Market Analysis, Insights and Forecast - by Material Type
- 6.2.1. Cotton
- 6.2.2. Jute
- 6.2.3. Silk
- 6.2.4. Synthetics
- 6.2.5. Wool
- 6.3. Market Analysis, Insights and Forecast - by Process
- 6.3.1. Woven
- 6.3.2. Non-woven
- 6.1. Market Analysis, Insights and Forecast - by Application
- 7. North America GCC Textiles Industry Analysis, Insights and Forecast, 2020-2032
- 7.1. Market Analysis, Insights and Forecast - by Application
- 7.1.1. Clothing
- 7.1.2. Industrial/Technical Applications
- 7.1.3. Household Applications
- 7.2. Market Analysis, Insights and Forecast - by Material Type
- 7.2.1. Cotton
- 7.2.2. Jute
- 7.2.3. Silk
- 7.2.4. Synthetics
- 7.2.5. Wool
- 7.3. Market Analysis, Insights and Forecast - by Process
- 7.3.1. Woven
- 7.3.2. Non-woven
- 7.1. Market Analysis, Insights and Forecast - by Application
- 8. South America GCC Textiles Industry Analysis, Insights and Forecast, 2020-2032
- 8.1. Market Analysis, Insights and Forecast - by Application
- 8.1.1. Clothing
- 8.1.2. Industrial/Technical Applications
- 8.1.3. Household Applications
- 8.2. Market Analysis, Insights and Forecast - by Material Type
- 8.2.1. Cotton
- 8.2.2. Jute
- 8.2.3. Silk
- 8.2.4. Synthetics
- 8.2.5. Wool
- 8.3. Market Analysis, Insights and Forecast - by Process
- 8.3.1. Woven
- 8.3.2. Non-woven
- 8.1. Market Analysis, Insights and Forecast - by Application
- 9. Europe GCC Textiles Industry Analysis, Insights and Forecast, 2020-2032
- 9.1. Market Analysis, Insights and Forecast - by Application
- 9.1.1. Clothing
- 9.1.2. Industrial/Technical Applications
- 9.1.3. Household Applications
- 9.2. Market Analysis, Insights and Forecast - by Material Type
- 9.2.1. Cotton
- 9.2.2. Jute
- 9.2.3. Silk
- 9.2.4. Synthetics
- 9.2.5. Wool
- 9.3. Market Analysis, Insights and Forecast - by Process
- 9.3.1. Woven
- 9.3.2. Non-woven
- 9.1. Market Analysis, Insights and Forecast - by Application
- 10. Middle East & Africa GCC Textiles Industry Analysis, Insights and Forecast, 2020-2032
- 10.1. Market Analysis, Insights and Forecast - by Application
- 10.1.1. Clothing
- 10.1.2. Industrial/Technical Applications
- 10.1.3. Household Applications
- 10.2. Market Analysis, Insights and Forecast - by Material Type
- 10.2.1. Cotton
- 10.2.2. Jute
- 10.2.3. Silk
- 10.2.4. Synthetics
- 10.2.5. Wool
- 10.3. Market Analysis, Insights and Forecast - by Process
- 10.3.1. Woven
- 10.3.2. Non-woven
- 10.1. Market Analysis, Insights and Forecast - by Application
- 11. Asia Pacific GCC Textiles Industry Analysis, Insights and Forecast, 2020-2032
- 11.1. Market Analysis, Insights and Forecast - by Application
- 11.1.1. Clothing
- 11.1.2. Industrial/Technical Applications
- 11.1.3. Household Applications
- 11.2. Market Analysis, Insights and Forecast - by Material Type
- 11.2.1. Cotton
- 11.2.2. Jute
- 11.2.3. Silk
- 11.2.4. Synthetics
- 11.2.5. Wool
- 11.3. Market Analysis, Insights and Forecast - by Process
- 11.3.1. Woven
- 11.3.2. Non-woven
- 11.1. Market Analysis, Insights and Forecast - by Application
- 12. Competitive Analysis
- 12.1. Company Profiles
- 12.1.1 Unirab & Polvara Spinning Weaving & Silk
- 12.1.1.1. Company Overview
- 12.1.1.2. Products
- 12.1.1.3. Company Financials
- 12.1.1.4. SWOT Analysis
- 12.1.2 Misr Amreya
- 12.1.2.1. Company Overview
- 12.1.2.2. Products
- 12.1.2.3. Company Financials
- 12.1.2.4. SWOT Analysis
- 12.1.3 AMCO
- 12.1.3.1. Company Overview
- 12.1.3.2. Products
- 12.1.3.3. Company Financials
- 12.1.3.4. SWOT Analysis
- 12.1.4 Avgol
- 12.1.4.1. Company Overview
- 12.1.4.2. Products
- 12.1.4.3. Company Financials
- 12.1.4.4. SWOT Analysis
- 12.1.5 Millennium Fashions Industries
- 12.1.5.1. Company Overview
- 12.1.5.2. Products
- 12.1.5.3. Company Financials
- 12.1.5.4. SWOT Analysis
- 12.1.6 Embee Group
- 12.1.6.1. Company Overview
- 12.1.6.2. Products
- 12.1.6.3. Company Financials
- 12.1.6.4. SWOT Analysis
- 12.1.7 Kabale
- 12.1.7.1. Company Overview
- 12.1.7.2. Products
- 12.1.7.3. Company Financials
- 12.1.7.4. SWOT Analysis
- 12.1.8 FPC Coated Technical Textiles
- 12.1.8.1. Company Overview
- 12.1.8.2. Products
- 12.1.8.3. Company Financials
- 12.1.8.4. SWOT Analysis
- 12.1.9 Alyaf Industrial Company Ltd
- 12.1.9.1. Company Overview
- 12.1.9.2. Products
- 12.1.9.3. Company Financials
- 12.1.9.4. SWOT Analysis
- 12.1.10 Aratex Group
- 12.1.10.1. Company Overview
- 12.1.10.2. Products
- 12.1.10.3. Company Financials
- 12.1.10.4. SWOT Analysis
- 12.1.11 Lomar Selection
- 12.1.11.1. Company Overview
- 12.1.11.2. Products
- 12.1.11.3. Company Financials
- 12.1.11.4. SWOT Analysis
- 12.1.12 Valleystar Uniforms**List Not Exhaustive
- 12.1.12.1. Company Overview
- 12.1.12.2. Products
- 12.1.12.3. Company Financials
- 12.1.12.4. SWOT Analysis
- 12.1.1 Unirab & Polvara Spinning Weaving & Silk
- 12.2. Market Entropy
- 12.2.1 Company's Key Areas Served
- 12.2.2 Recent Developments
- 12.3. Company Market Share Analysis 2025
- 12.3.1 Top 5 Companies Market Share Analysis
- 12.3.2 Top 3 Companies Market Share Analysis
- 12.4. List of Potential Customers
- 13. Research Methodology
List of Figures
- Figure 1: Global GCC Textiles Industry Revenue Breakdown (Million, %) by Region 2025 & 2033
- Figure 2: Global GCC Textiles Industry Volume Breakdown (Billion, %) by Region 2025 & 2033
- Figure 3: North America GCC Textiles Industry Revenue (Million), by Application 2025 & 2033
- Figure 4: North America GCC Textiles Industry Volume (Billion), by Application 2025 & 2033
- Figure 5: North America GCC Textiles Industry Revenue Share (%), by Application 2025 & 2033
- Figure 6: North America GCC Textiles Industry Volume Share (%), by Application 2025 & 2033
- Figure 7: North America GCC Textiles Industry Revenue (Million), by Material Type 2025 & 2033
- Figure 8: North America GCC Textiles Industry Volume (Billion), by Material Type 2025 & 2033
- Figure 9: North America GCC Textiles Industry Revenue Share (%), by Material Type 2025 & 2033
- Figure 10: North America GCC Textiles Industry Volume Share (%), by Material Type 2025 & 2033
- Figure 11: North America GCC Textiles Industry Revenue (Million), by Process 2025 & 2033
- Figure 12: North America GCC Textiles Industry Volume (Billion), by Process 2025 & 2033
- Figure 13: North America GCC Textiles Industry Revenue Share (%), by Process 2025 & 2033
- Figure 14: North America GCC Textiles Industry Volume Share (%), by Process 2025 & 2033
- Figure 15: North America GCC Textiles Industry Revenue (Million), by Country 2025 & 2033
- Figure 16: North America GCC Textiles Industry Volume (Billion), by Country 2025 & 2033
- Figure 17: North America GCC Textiles Industry Revenue Share (%), by Country 2025 & 2033
- Figure 18: North America GCC Textiles Industry Volume Share (%), by Country 2025 & 2033
- Figure 19: South America GCC Textiles Industry Revenue (Million), by Application 2025 & 2033
- Figure 20: South America GCC Textiles Industry Volume (Billion), by Application 2025 & 2033
- Figure 21: South America GCC Textiles Industry Revenue Share (%), by Application 2025 & 2033
- Figure 22: South America GCC Textiles Industry Volume Share (%), by Application 2025 & 2033
- Figure 23: South America GCC Textiles Industry Revenue (Million), by Material Type 2025 & 2033
- Figure 24: South America GCC Textiles Industry Volume (Billion), by Material Type 2025 & 2033
- Figure 25: South America GCC Textiles Industry Revenue Share (%), by Material Type 2025 & 2033
- Figure 26: South America GCC Textiles Industry Volume Share (%), by Material Type 2025 & 2033
- Figure 27: South America GCC Textiles Industry Revenue (Million), by Process 2025 & 2033
- Figure 28: South America GCC Textiles Industry Volume (Billion), by Process 2025 & 2033
- Figure 29: South America GCC Textiles Industry Revenue Share (%), by Process 2025 & 2033
- Figure 30: South America GCC Textiles Industry Volume Share (%), by Process 2025 & 2033
- Figure 31: South America GCC Textiles Industry Revenue (Million), by Country 2025 & 2033
- Figure 32: South America GCC Textiles Industry Volume (Billion), by Country 2025 & 2033
- Figure 33: South America GCC Textiles Industry Revenue Share (%), by Country 2025 & 2033
- Figure 34: South America GCC Textiles Industry Volume Share (%), by Country 2025 & 2033
- Figure 35: Europe GCC Textiles Industry Revenue (Million), by Application 2025 & 2033
- Figure 36: Europe GCC Textiles Industry Volume (Billion), by Application 2025 & 2033
- Figure 37: Europe GCC Textiles Industry Revenue Share (%), by Application 2025 & 2033
- Figure 38: Europe GCC Textiles Industry Volume Share (%), by Application 2025 & 2033
- Figure 39: Europe GCC Textiles Industry Revenue (Million), by Material Type 2025 & 2033
- Figure 40: Europe GCC Textiles Industry Volume (Billion), by Material Type 2025 & 2033
- Figure 41: Europe GCC Textiles Industry Revenue Share (%), by Material Type 2025 & 2033
- Figure 42: Europe GCC Textiles Industry Volume Share (%), by Material Type 2025 & 2033
- Figure 43: Europe GCC Textiles Industry Revenue (Million), by Process 2025 & 2033
- Figure 44: Europe GCC Textiles Industry Volume (Billion), by Process 2025 & 2033
- Figure 45: Europe GCC Textiles Industry Revenue Share (%), by Process 2025 & 2033
- Figure 46: Europe GCC Textiles Industry Volume Share (%), by Process 2025 & 2033
- Figure 47: Europe GCC Textiles Industry Revenue (Million), by Country 2025 & 2033
- Figure 48: Europe GCC Textiles Industry Volume (Billion), by Country 2025 & 2033
- Figure 49: Europe GCC Textiles Industry Revenue Share (%), by Country 2025 & 2033
- Figure 50: Europe GCC Textiles Industry Volume Share (%), by Country 2025 & 2033
- Figure 51: Middle East & Africa GCC Textiles Industry Revenue (Million), by Application 2025 & 2033
- Figure 52: Middle East & Africa GCC Textiles Industry Volume (Billion), by Application 2025 & 2033
- Figure 53: Middle East & Africa GCC Textiles Industry Revenue Share (%), by Application 2025 & 2033
- Figure 54: Middle East & Africa GCC Textiles Industry Volume Share (%), by Application 2025 & 2033
- Figure 55: Middle East & Africa GCC Textiles Industry Revenue (Million), by Material Type 2025 & 2033
- Figure 56: Middle East & Africa GCC Textiles Industry Volume (Billion), by Material Type 2025 & 2033
- Figure 57: Middle East & Africa GCC Textiles Industry Revenue Share (%), by Material Type 2025 & 2033
- Figure 58: Middle East & Africa GCC Textiles Industry Volume Share (%), by Material Type 2025 & 2033
- Figure 59: Middle East & Africa GCC Textiles Industry Revenue (Million), by Process 2025 & 2033
- Figure 60: Middle East & Africa GCC Textiles Industry Volume (Billion), by Process 2025 & 2033
- Figure 61: Middle East & Africa GCC Textiles Industry Revenue Share (%), by Process 2025 & 2033
- Figure 62: Middle East & Africa GCC Textiles Industry Volume Share (%), by Process 2025 & 2033
- Figure 63: Middle East & Africa GCC Textiles Industry Revenue (Million), by Country 2025 & 2033
- Figure 64: Middle East & Africa GCC Textiles Industry Volume (Billion), by Country 2025 & 2033
- Figure 65: Middle East & Africa GCC Textiles Industry Revenue Share (%), by Country 2025 & 2033
- Figure 66: Middle East & Africa GCC Textiles Industry Volume Share (%), by Country 2025 & 2033
- Figure 67: Asia Pacific GCC Textiles Industry Revenue (Million), by Application 2025 & 2033
- Figure 68: Asia Pacific GCC Textiles Industry Volume (Billion), by Application 2025 & 2033
- Figure 69: Asia Pacific GCC Textiles Industry Revenue Share (%), by Application 2025 & 2033
- Figure 70: Asia Pacific GCC Textiles Industry Volume Share (%), by Application 2025 & 2033
- Figure 71: Asia Pacific GCC Textiles Industry Revenue (Million), by Material Type 2025 & 2033
- Figure 72: Asia Pacific GCC Textiles Industry Volume (Billion), by Material Type 2025 & 2033
- Figure 73: Asia Pacific GCC Textiles Industry Revenue Share (%), by Material Type 2025 & 2033
- Figure 74: Asia Pacific GCC Textiles Industry Volume Share (%), by Material Type 2025 & 2033
- Figure 75: Asia Pacific GCC Textiles Industry Revenue (Million), by Process 2025 & 2033
- Figure 76: Asia Pacific GCC Textiles Industry Volume (Billion), by Process 2025 & 2033
- Figure 77: Asia Pacific GCC Textiles Industry Revenue Share (%), by Process 2025 & 2033
- Figure 78: Asia Pacific GCC Textiles Industry Volume Share (%), by Process 2025 & 2033
- Figure 79: Asia Pacific GCC Textiles Industry Revenue (Million), by Country 2025 & 2033
- Figure 80: Asia Pacific GCC Textiles Industry Volume (Billion), by Country 2025 & 2033
- Figure 81: Asia Pacific GCC Textiles Industry Revenue Share (%), by Country 2025 & 2033
- Figure 82: Asia Pacific GCC Textiles Industry Volume Share (%), by Country 2025 & 2033
List of Tables
- Table 1: Global GCC Textiles Industry Revenue Million Forecast, by Application 2020 & 2033
- Table 2: Global GCC Textiles Industry Volume Billion Forecast, by Application 2020 & 2033
- Table 3: Global GCC Textiles Industry Revenue Million Forecast, by Material Type 2020 & 2033
- Table 4: Global GCC Textiles Industry Volume Billion Forecast, by Material Type 2020 & 2033
- Table 5: Global GCC Textiles Industry Revenue Million Forecast, by Process 2020 & 2033
- Table 6: Global GCC Textiles Industry Volume Billion Forecast, by Process 2020 & 2033
- Table 7: Global GCC Textiles Industry Revenue Million Forecast, by Region 2020 & 2033
- Table 8: Global GCC Textiles Industry Volume Billion Forecast, by Region 2020 & 2033
- Table 9: Global GCC Textiles Industry Revenue Million Forecast, by Application 2020 & 2033
- Table 10: Global GCC Textiles Industry Volume Billion Forecast, by Application 2020 & 2033
- Table 11: Global GCC Textiles Industry Revenue Million Forecast, by Material Type 2020 & 2033
- Table 12: Global GCC Textiles Industry Volume Billion Forecast, by Material Type 2020 & 2033
- Table 13: Global GCC Textiles Industry Revenue Million Forecast, by Process 2020 & 2033
- Table 14: Global GCC Textiles Industry Volume Billion Forecast, by Process 2020 & 2033
- Table 15: Global GCC Textiles Industry Revenue Million Forecast, by Country 2020 & 2033
- Table 16: Global GCC Textiles Industry Volume Billion Forecast, by Country 2020 & 2033
- Table 17: United States GCC Textiles Industry Revenue (Million) Forecast, by Application 2020 & 2033
- Table 18: United States GCC Textiles Industry Volume (Billion) Forecast, by Application 2020 & 2033
- Table 19: Canada GCC Textiles Industry Revenue (Million) Forecast, by Application 2020 & 2033
- Table 20: Canada GCC Textiles Industry Volume (Billion) Forecast, by Application 2020 & 2033
- Table 21: Mexico GCC Textiles Industry Revenue (Million) Forecast, by Application 2020 & 2033
- Table 22: Mexico GCC Textiles Industry Volume (Billion) Forecast, by Application 2020 & 2033
- Table 23: Global GCC Textiles Industry Revenue Million Forecast, by Application 2020 & 2033
- Table 24: Global GCC Textiles Industry Volume Billion Forecast, by Application 2020 & 2033
- Table 25: Global GCC Textiles Industry Revenue Million Forecast, by Material Type 2020 & 2033
- Table 26: Global GCC Textiles Industry Volume Billion Forecast, by Material Type 2020 & 2033
- Table 27: Global GCC Textiles Industry Revenue Million Forecast, by Process 2020 & 2033
- Table 28: Global GCC Textiles Industry Volume Billion Forecast, by Process 2020 & 2033
- Table 29: Global GCC Textiles Industry Revenue Million Forecast, by Country 2020 & 2033
- Table 30: Global GCC Textiles Industry Volume Billion Forecast, by Country 2020 & 2033
- Table 31: Brazil GCC Textiles Industry Revenue (Million) Forecast, by Application 2020 & 2033
- Table 32: Brazil GCC Textiles Industry Volume (Billion) Forecast, by Application 2020 & 2033
- Table 33: Argentina GCC Textiles Industry Revenue (Million) Forecast, by Application 2020 & 2033
- Table 34: Argentina GCC Textiles Industry Volume (Billion) Forecast, by Application 2020 & 2033
- Table 35: Rest of South America GCC Textiles Industry Revenue (Million) Forecast, by Application 2020 & 2033
- Table 36: Rest of South America GCC Textiles Industry Volume (Billion) Forecast, by Application 2020 & 2033
- Table 37: Global GCC Textiles Industry Revenue Million Forecast, by Application 2020 & 2033
- Table 38: Global GCC Textiles Industry Volume Billion Forecast, by Application 2020 & 2033
- Table 39: Global GCC Textiles Industry Revenue Million Forecast, by Material Type 2020 & 2033
- Table 40: Global GCC Textiles Industry Volume Billion Forecast, by Material Type 2020 & 2033
- Table 41: Global GCC Textiles Industry Revenue Million Forecast, by Process 2020 & 2033
- Table 42: Global GCC Textiles Industry Volume Billion Forecast, by Process 2020 & 2033
- Table 43: Global GCC Textiles Industry Revenue Million Forecast, by Country 2020 & 2033
- Table 44: Global GCC Textiles Industry Volume Billion Forecast, by Country 2020 & 2033
- Table 45: United Kingdom GCC Textiles Industry Revenue (Million) Forecast, by Application 2020 & 2033
- Table 46: United Kingdom GCC Textiles Industry Volume (Billion) Forecast, by Application 2020 & 2033
- Table 47: Germany GCC Textiles Industry Revenue (Million) Forecast, by Application 2020 & 2033
- Table 48: Germany GCC Textiles Industry Volume (Billion) Forecast, by Application 2020 & 2033
- Table 49: France GCC Textiles Industry Revenue (Million) Forecast, by Application 2020 & 2033
- Table 50: France GCC Textiles Industry Volume (Billion) Forecast, by Application 2020 & 2033
- Table 51: Italy GCC Textiles Industry Revenue (Million) Forecast, by Application 2020 & 2033
- Table 52: Italy GCC Textiles Industry Volume (Billion) Forecast, by Application 2020 & 2033
- Table 53: Spain GCC Textiles Industry Revenue (Million) Forecast, by Application 2020 & 2033
- Table 54: Spain GCC Textiles Industry Volume (Billion) Forecast, by Application 2020 & 2033
- Table 55: Russia GCC Textiles Industry Revenue (Million) Forecast, by Application 2020 & 2033
- Table 56: Russia GCC Textiles Industry Volume (Billion) Forecast, by Application 2020 & 2033
- Table 57: Benelux GCC Textiles Industry Revenue (Million) Forecast, by Application 2020 & 2033
- Table 58: Benelux GCC Textiles Industry Volume (Billion) Forecast, by Application 2020 & 2033
- Table 59: Nordics GCC Textiles Industry Revenue (Million) Forecast, by Application 2020 & 2033
- Table 60: Nordics GCC Textiles Industry Volume (Billion) Forecast, by Application 2020 & 2033
- Table 61: Rest of Europe GCC Textiles Industry Revenue (Million) Forecast, by Application 2020 & 2033
- Table 62: Rest of Europe GCC Textiles Industry Volume (Billion) Forecast, by Application 2020 & 2033
- Table 63: Global GCC Textiles Industry Revenue Million Forecast, by Application 2020 & 2033
- Table 64: Global GCC Textiles Industry Volume Billion Forecast, by Application 2020 & 2033
- Table 65: Global GCC Textiles Industry Revenue Million Forecast, by Material Type 2020 & 2033
- Table 66: Global GCC Textiles Industry Volume Billion Forecast, by Material Type 2020 & 2033
- Table 67: Global GCC Textiles Industry Revenue Million Forecast, by Process 2020 & 2033
- Table 68: Global GCC Textiles Industry Volume Billion Forecast, by Process 2020 & 2033
- Table 69: Global GCC Textiles Industry Revenue Million Forecast, by Country 2020 & 2033
- Table 70: Global GCC Textiles Industry Volume Billion Forecast, by Country 2020 & 2033
- Table 71: Turkey GCC Textiles Industry Revenue (Million) Forecast, by Application 2020 & 2033
- Table 72: Turkey GCC Textiles Industry Volume (Billion) Forecast, by Application 2020 & 2033
- Table 73: Israel GCC Textiles Industry Revenue (Million) Forecast, by Application 2020 & 2033
- Table 74: Israel GCC Textiles Industry Volume (Billion) Forecast, by Application 2020 & 2033
- Table 75: GCC GCC Textiles Industry Revenue (Million) Forecast, by Application 2020 & 2033
- Table 76: GCC GCC Textiles Industry Volume (Billion) Forecast, by Application 2020 & 2033
- Table 77: North Africa GCC Textiles Industry Revenue (Million) Forecast, by Application 2020 & 2033
- Table 78: North Africa GCC Textiles Industry Volume (Billion) Forecast, by Application 2020 & 2033
- Table 79: South Africa GCC Textiles Industry Revenue (Million) Forecast, by Application 2020 & 2033
- Table 80: South Africa GCC Textiles Industry Volume (Billion) Forecast, by Application 2020 & 2033
- Table 81: Rest of Middle East & Africa GCC Textiles Industry Revenue (Million) Forecast, by Application 2020 & 2033
- Table 82: Rest of Middle East & Africa GCC Textiles Industry Volume (Billion) Forecast, by Application 2020 & 2033
- Table 83: Global GCC Textiles Industry Revenue Million Forecast, by Application 2020 & 2033
- Table 84: Global GCC Textiles Industry Volume Billion Forecast, by Application 2020 & 2033
- Table 85: Global GCC Textiles Industry Revenue Million Forecast, by Material Type 2020 & 2033
- Table 86: Global GCC Textiles Industry Volume Billion Forecast, by Material Type 2020 & 2033
- Table 87: Global GCC Textiles Industry Revenue Million Forecast, by Process 2020 & 2033
- Table 88: Global GCC Textiles Industry Volume Billion Forecast, by Process 2020 & 2033
- Table 89: Global GCC Textiles Industry Revenue Million Forecast, by Country 2020 & 2033
- Table 90: Global GCC Textiles Industry Volume Billion Forecast, by Country 2020 & 2033
- Table 91: China GCC Textiles Industry Revenue (Million) Forecast, by Application 2020 & 2033
- Table 92: China GCC Textiles Industry Volume (Billion) Forecast, by Application 2020 & 2033
- Table 93: India GCC Textiles Industry Revenue (Million) Forecast, by Application 2020 & 2033
- Table 94: India GCC Textiles Industry Volume (Billion) Forecast, by Application 2020 & 2033
- Table 95: Japan GCC Textiles Industry Revenue (Million) Forecast, by Application 2020 & 2033
- Table 96: Japan GCC Textiles Industry Volume (Billion) Forecast, by Application 2020 & 2033
- Table 97: South Korea GCC Textiles Industry Revenue (Million) Forecast, by Application 2020 & 2033
- Table 98: South Korea GCC Textiles Industry Volume (Billion) Forecast, by Application 2020 & 2033
- Table 99: ASEAN GCC Textiles Industry Revenue (Million) Forecast, by Application 2020 & 2033
- Table 100: ASEAN GCC Textiles Industry Volume (Billion) Forecast, by Application 2020 & 2033
- Table 101: Oceania GCC Textiles Industry Revenue (Million) Forecast, by Application 2020 & 2033
- Table 102: Oceania GCC Textiles Industry Volume (Billion) Forecast, by Application 2020 & 2033
- Table 103: Rest of Asia Pacific GCC Textiles Industry Revenue (Million) Forecast, by Application 2020 & 2033
- Table 104: Rest of Asia Pacific GCC Textiles Industry Volume (Billion) Forecast, by Application 2020 & 2033
Frequently Asked Questions
1. What is the projected Compound Annual Growth Rate (CAGR) of the GCC Textiles Industry?
The projected CAGR is approximately 6.78%.
2. Which companies are prominent players in the GCC Textiles Industry?
Key companies in the market include Unirab & Polvara Spinning Weaving & Silk, Misr Amreya, AMCO, Avgol, Millennium Fashions Industries, Embee Group, Kabale, FPC Coated Technical Textiles, Alyaf Industrial Company Ltd, Aratex Group, Lomar Selection, Valleystar Uniforms**List Not Exhaustive.
3. What are the main segments of the GCC Textiles Industry?
The market segments include Application, Material Type, Process.
4. Can you provide details about the market size?
The market size is estimated to be USD 15.08 Million as of 2022.
5. What are some drivers contributing to market growth?
3.; Growing fashion consciousness3.; Export Opportunities.
6. What are the notable trends driving market growth?
Rising Textile and Apparels Demand in UAE.
7. Are there any restraints impacting market growth?
3.; Growing fashion consciousness3.; Export Opportunities.
8. Can you provide examples of recent developments in the market?
Febuary 2023, Saudi’s MODON announces USD 1.1bn textile investments. These investments are distributed over 125 industrial contracts in 19 industrial cities, covering a total area of more than one million square meters. According to Al-Argoubi, the textiles and men’s supplies sector is experiencing high growth in the Kingdom.
9. What pricing options are available for accessing the report?
Pricing options include single-user, multi-user, and enterprise licenses priced at USD 3800, USD 4500, and USD 5800 respectively.
10. Is the market size provided in terms of value or volume?
The market size is provided in terms of value, measured in Million and volume, measured in Billion.
11. Are there any specific market keywords associated with the report?
Yes, the market keyword associated with the report is "GCC Textiles Industry," which aids in identifying and referencing the specific market segment covered.
12. How do I determine which pricing option suits my needs best?
The pricing options vary based on user requirements and access needs. Individual users may opt for single-user licenses, while businesses requiring broader access may choose multi-user or enterprise licenses for cost-effective access to the report.
13. Are there any additional resources or data provided in the GCC Textiles Industry report?
While the report offers comprehensive insights, it's advisable to review the specific contents or supplementary materials provided to ascertain if additional resources or data are available.
14. How can I stay updated on further developments or reports in the GCC Textiles Industry?
To stay informed about further developments, trends, and reports in the GCC Textiles Industry, consider subscribing to industry newsletters, following relevant companies and organizations, or regularly checking reputable industry news sources and publications.
Methodology
Step 1 - Identification of Relevant Samples Size from Population Database


Step 2 - Approaches for Defining Global Market Size (Value, Volume* & Price*)

Note*: In applicable scenarios
Step 3 - Data Sources
Primary Research
- Web Analytics
- Survey Reports
- Research Institute
- Latest Research Reports
- Opinion Leaders
Secondary Research
- Annual Reports
- White Paper
- Latest Press Release
- Industry Association
- Paid Database
- Investor Presentations

Step 4 - Data Triangulation
Involves using different sources of information in order to increase the validity of a study
These sources are likely to be stakeholders in a program - participants, other researchers, program staff, other community members, and so on.
Then we put all data in single framework & apply various statistical tools to find out the dynamic on the market.
During the analysis stage, feedback from the stakeholder groups would be compared to determine areas of agreement as well as areas of divergence