

Key Insights
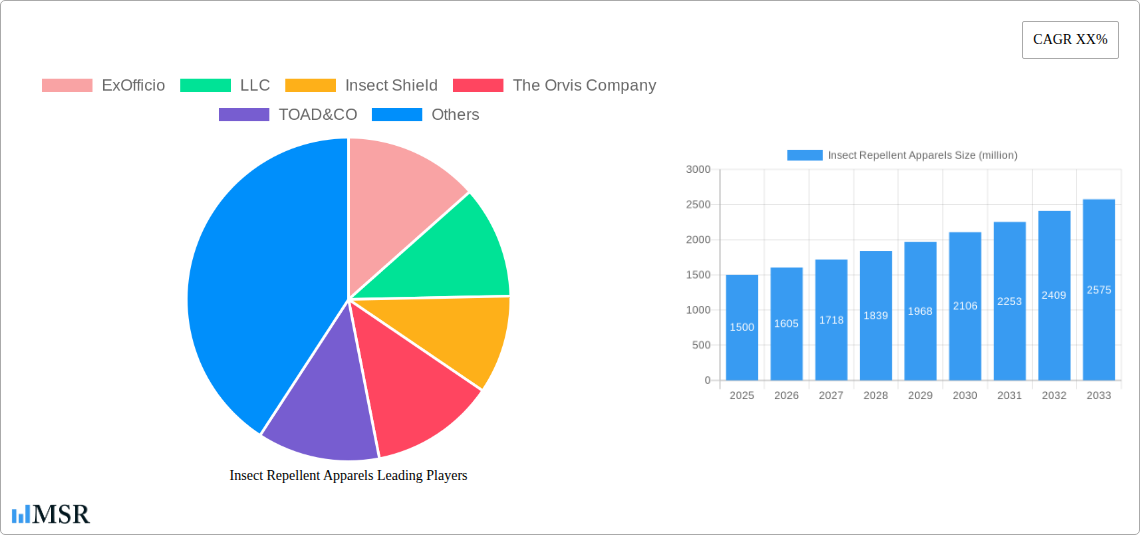
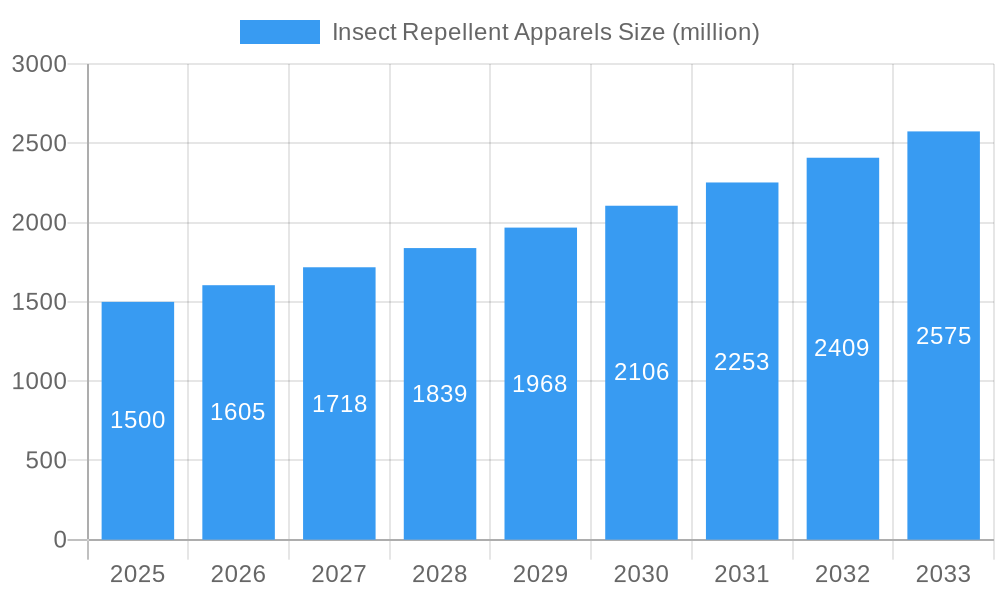
The insect repellent apparel market is experiencing robust growth, driven by increasing consumer awareness of insect-borne diseases and the rising popularity of outdoor recreational activities. The market, valued at approximately $1.5 billion in 2025, is projected to exhibit a Compound Annual Growth Rate (CAGR) of 7% from 2025 to 2033, reaching an estimated market value of $2.8 billion by 2033. This growth is fueled by several key factors. Firstly, advancements in fabric technology and treatment methods are leading to more effective and comfortable insect repellent clothing. Secondly, the increasing prevalence of diseases like Zika, Lyme disease, and West Nile virus is driving demand for protective apparel. Thirdly, the expansion of eco-tourism and outdoor adventures, particularly among millennials and Gen Z, further contributes to market expansion. Leading brands like ExOfficio, Insect Shield, and Craghoppers are capitalizing on these trends through innovative product development and effective marketing strategies. However, the market faces some challenges, including potential concerns regarding the long-term effects of certain insect repellents on human health and the environment, which is driving interest in more sustainable and naturally derived alternatives. This necessitates a balanced approach that prioritizes efficacy while minimizing environmental impact.
Insect Repellent Apparels Market Size (In Billion)
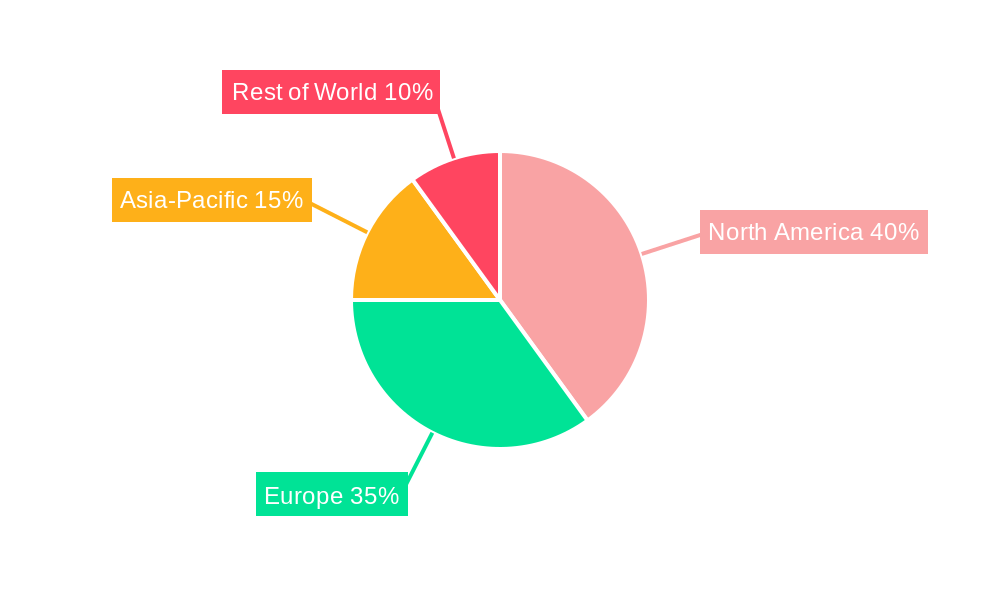
Geographic segmentation reveals a strong presence in North America and Europe, driven by high disposable incomes and established outdoor recreational culture. However, Asia-Pacific presents a significant growth opportunity due to rapid urbanization, increasing tourism, and rising awareness of insect-borne diseases. The market is segmented by apparel type (shirts, pants, jackets, etc.), insect repellent technology (permethrin, DEET, natural repellents), and price point. The premium segment, offering advanced technologies and higher comfort levels, is expected to see faster growth compared to the budget segment. Competition is intensifying, with both established players and new entrants vying for market share through product innovation, strategic partnerships, and expanding distribution networks. This competitive landscape presents opportunities for strategic acquisitions and alliances to gain a competitive edge in a rapidly growing market.
Insect Repellent Apparels Company Market Share
Insect Repellent Apparels Market Report: 2019-2033 – A Comprehensive Analysis of a $XX Billion Industry
This comprehensive report provides an in-depth analysis of the global Insect Repellent Apparels market, projecting a market value of $XX billion by 2033. The study period covers 2019-2033, with 2025 as the base and estimated year. This report is essential for industry stakeholders, investors, and businesses seeking to understand market dynamics, growth drivers, and future opportunities within this rapidly evolving sector. We analyze market concentration, innovation, key players like ExOfficio, LLC, Insect Shield, and The Orvis Company, and emerging trends to provide actionable insights for strategic decision-making.
Insect Repellent Apparels Market Concentration & Dynamics
The global insect repellent apparel market is characterized by a moderately concentrated landscape, with a few major players holding significant market share. ExOfficio, LLC, Insect Shield, and The Orvis Company are among the leading brands, collectively accounting for approximately xx% of the market in 2025. However, the market also exhibits a significant presence of smaller players, particularly in niche segments.
Market Concentration Metrics (2025):
- Top 3 Players Market Share: xx%
- Top 5 Players Market Share: xx%
- Number of M&A Deals (2019-2024): xx
Market Dynamics:
- Innovation Ecosystem: The market is witnessing continuous innovation in fabric technology, repellent formulations, and garment design, leading to improved efficacy and wearer comfort. This includes the development of more sustainable and environmentally friendly repellents.
- Regulatory Frameworks: Government regulations regarding the use of insect repellents in apparel vary across regions, influencing market growth and product development. Compliance with these regulations is a key challenge for manufacturers.
- Substitute Products: Traditional insect repellents (sprays, lotions) and other protective measures (mosquito nets, screens) remain significant substitutes. However, the convenience and extended protection offered by repellent apparel are driving market growth.
- End-User Trends: Increasing awareness of vector-borne diseases and a growing preference for outdoor activities are fueling demand for insect repellent apparel. This is particularly evident in regions with high prevalence of mosquito-borne illnesses.
- M&A Activities: The past five years have witnessed a moderate level of M&A activity, with larger companies acquiring smaller players to expand their product portfolios and market reach. This consolidation is expected to continue, driving further market concentration.
Insect Repellent Apparels Industry Insights & Trends
The global insect repellent apparel market is experiencing robust growth, driven by several key factors. The market size reached $XX billion in 2025, and is projected to grow at a Compound Annual Growth Rate (CAGR) of xx% from 2025 to 2033, reaching $XX billion by 2033.
This growth is attributed to:
- Rising prevalence of vector-borne diseases: The increasing incidence of diseases like Zika, dengue fever, and Lyme disease is driving consumer demand for effective insect protection.
- Growing popularity of outdoor recreational activities: Hiking, camping, fishing, and other outdoor pursuits are becoming increasingly popular, boosting the demand for insect repellent apparel.
- Technological advancements: Innovations in fabric technology and repellent formulations are leading to more effective, comfortable, and durable insect repellent apparel. This includes the development of long-lasting, odorless, and environmentally friendly repellents.
- Evolving consumer preferences: Consumers are increasingly seeking convenient and effective insect protection solutions, favoring apparel over traditional repellents. Demand for sustainable and ethically sourced products is also growing.
Key Markets & Segments Leading Insect Repellent Apparels
The North American market currently holds the largest share of the global insect repellent apparel market, driven by high consumer awareness, disposable income, and a large outdoor recreation sector. However, significant growth is expected in Asia-Pacific, fueled by increasing vector-borne disease prevalence and rising disposable incomes.
Key Market Drivers:
- North America: High consumer awareness, strong outdoor recreation sector, high disposable incomes.
- Europe: Growing awareness of vector-borne diseases, increasing outdoor activities, and government initiatives promoting vector control.
- Asia-Pacific: Rising prevalence of vector-borne diseases, increasing disposable incomes, and expanding outdoor recreation market.
Dominance Analysis: North America's dominance stems from a confluence of factors including high consumer spending power, a robust outdoor recreation industry, and early adoption of innovative products. However, Asia-Pacific is expected to witness faster growth due to a large and rapidly growing population, increasing awareness of insect-borne diseases, and rising demand for convenient protection solutions.
Insect Repellent Apparels Product Developments
Recent product innovations have focused on enhancing the efficacy, comfort, and durability of insect repellent apparel. This includes the development of new fabric technologies that provide superior protection and breathability, as well as more effective and longer-lasting repellent formulations. The integration of smart technologies, such as sensors that track insect activity, is also gaining traction. These advancements provide a competitive edge to manufacturers by offering superior performance and enhanced consumer experience.
Challenges in the Insect Repellent Apparels Market
The insect repellent apparel market faces several challenges, including:
- Regulatory hurdles: Varying regulations across different regions regarding the use of insect repellents create complexities for manufacturers.
- Supply chain disruptions: Global supply chain uncertainties can impact the availability of raw materials and manufacturing processes.
- Competitive pressures: Intense competition among existing players and the emergence of new entrants are putting pressure on margins. This is further exacerbated by the availability of substitute products. The estimated impact on market growth is xx%.
Forces Driving Insect Repellent Apparels Growth
Several factors are driving the growth of the insect repellent apparel market:
- Technological advancements: Continuous innovation in fabric technology and repellent formulations is leading to more effective and comfortable products.
- Economic growth: Rising disposable incomes in developing countries are fueling demand for higher-quality and more convenient insect protection solutions.
- Government initiatives: Public health campaigns emphasizing vector-borne disease prevention are raising consumer awareness and driving market growth.
Long-Term Growth Catalysts in Insect Repellent Apparels
Long-term growth in the insect repellent apparel market will be fueled by strategic partnerships between apparel manufacturers and chemical companies, leading to the development of more effective and sustainable repellents. Furthermore, expansion into new geographic markets and the development of specialized apparel for different outdoor activities will drive future growth. Innovations in wearable technology, such as integrated insect repellent dispensers, hold immense potential for future growth.
Emerging Opportunities in Insect Repellent Apparels
Emerging opportunities lie in the development of specialized apparel for niche markets, such as athletes, military personnel, and travelers. Furthermore, the integration of smart technologies, such as sensors that monitor insect activity, presents a significant opportunity for innovation. The growing demand for sustainable and eco-friendly products also presents a significant opportunity for companies committed to environmentally responsible practices.
Leading Players in the Insect Repellent Apparels Sector
- ExOfficio, LLC
- Insect Shield
- The Orvis Company
- TOAD&CO
- Rohan
- Craghoppers
- Royal Robbins
- Dog Not Gone
- Tyndale USA
- Pang Wangle
- NoBugs Ltd
- Kathmandu
- Craghoppers
Key Milestones in Insect Repellent Apparels Industry
- 2020: Insect Shield launches a new line of apparel with improved repellent technology.
- 2022: ExOfficio, LLC partners with a chemical company to develop a more sustainable repellent formulation.
- 2023: Several major players announce investments in research and development of new fabric technologies.
- 2024: Increased regulatory scrutiny leads to reformulation of some repellent products.
Strategic Outlook for Insect Repellent Apparels Market
The insect repellent apparel market is poised for significant growth over the next decade, driven by technological advancements, rising consumer awareness, and increasing demand for effective insect protection. Strategic opportunities exist for companies focusing on innovation, sustainability, and expansion into new geographic markets. Companies that effectively leverage technological advancements and cater to evolving consumer preferences are expected to gain a significant competitive advantage in this growing market.
Insect Repellent Apparels Segmentation
-
1. Application
- 1.1. Men
- 1.2. Women
-
2. Types
- 2.1. Jacket
- 2.2. Shirt
- 2.3. Trouser
- 2.4. Others
Insect Repellent Apparels Segmentation By Geography
-
1. North America
- 1.1. United States
- 1.2. Canada
- 1.3. Mexico
-
2. South America
- 2.1. Brazil
- 2.2. Argentina
- 2.3. Rest of South America
-
3. Europe
- 3.1. United Kingdom
- 3.2. Germany
- 3.3. France
- 3.4. Italy
- 3.5. Spain
- 3.6. Russia
- 3.7. Benelux
- 3.8. Nordics
- 3.9. Rest of Europe
-
4. Middle East & Africa
- 4.1. Turkey
- 4.2. Israel
- 4.3. GCC
- 4.4. North Africa
- 4.5. South Africa
- 4.6. Rest of Middle East & Africa
-
5. Asia Pacific
- 5.1. China
- 5.2. India
- 5.3. Japan
- 5.4. South Korea
- 5.5. ASEAN
- 5.6. Oceania
- 5.7. Rest of Asia Pacific
Insect Repellent Apparels Regional Market Share
Geographic Coverage of Insect Repellent Apparels
Insect Repellent Apparels REPORT HIGHLIGHTS
| Aspects | Details |
|---|---|
| Study Period | 2020-2034 |
| Base Year | 2025 |
| Estimated Year | 2026 |
| Forecast Period | 2026-2034 |
| Historical Period | 2020-2025 |
| Growth Rate | CAGR of 6.7% from 2020-2034 |
| Segmentation |
|
Table of Contents
- 1. Introduction
- 1.1. Research Scope
- 1.2. Market Segmentation
- 1.3. Research Objective
- 1.4. Definitions and Assumptions
- 2. Executive Summary
- 2.1. Market Snapshot
- 3. Market Dynamics
- 3.1. Market Drivers
- 3.2. Market Restrains
- 3.3. Market Trends
- 3.4. Market Opportunities
- 4. Market Factor Analysis
- 4.1. Porters Five Forces
- 4.1.1. Bargaining Power of Suppliers
- 4.1.2. Bargaining Power of Buyers
- 4.1.3. Threat of New Entrants
- 4.1.4. Threat of Substitutes
- 4.1.5. Competitive Rivalry
- 4.2. PESTEL analysis
- 4.3. BCG Analysis
- 4.3.1. Stars (High Growth, High Market Share)
- 4.3.2. Cash Cows (Low Growth, High Market Share)
- 4.3.3. Question Mark (High Growth, Low Market Share)
- 4.3.4. Dogs (Low Growth, Low Market Share)
- 4.4. Ansoff Matrix Analysis
- 4.5. Supply Chain Analysis
- 4.6. Regulatory Landscape
- 4.7. Current Market Potential and Opportunity Assessment (TAM–SAM–SOM Framework)
- 4.8. MSR Analyst Note
- 4.1. Porters Five Forces
- 5. Market Analysis, Insights and Forecast 2021-2033
- 5.1. Market Analysis, Insights and Forecast - by Application
- 5.1.1. Men
- 5.1.2. Women
- 5.2. Market Analysis, Insights and Forecast - by Types
- 5.2.1. Jacket
- 5.2.2. Shirt
- 5.2.3. Trouser
- 5.2.4. Others
- 5.3. Market Analysis, Insights and Forecast - by Region
- 5.3.1. North America
- 5.3.2. South America
- 5.3.3. Europe
- 5.3.4. Middle East & Africa
- 5.3.5. Asia Pacific
- 5.1. Market Analysis, Insights and Forecast - by Application
- 6. Global Insect Repellent Apparels Analysis, Insights and Forecast, 2021-2033
- 6.1. Market Analysis, Insights and Forecast - by Application
- 6.1.1. Men
- 6.1.2. Women
- 6.2. Market Analysis, Insights and Forecast - by Types
- 6.2.1. Jacket
- 6.2.2. Shirt
- 6.2.3. Trouser
- 6.2.4. Others
- 6.1. Market Analysis, Insights and Forecast - by Application
- 7. North America Insect Repellent Apparels Analysis, Insights and Forecast, 2020-2032
- 7.1. Market Analysis, Insights and Forecast - by Application
- 7.1.1. Men
- 7.1.2. Women
- 7.2. Market Analysis, Insights and Forecast - by Types
- 7.2.1. Jacket
- 7.2.2. Shirt
- 7.2.3. Trouser
- 7.2.4. Others
- 7.1. Market Analysis, Insights and Forecast - by Application
- 8. South America Insect Repellent Apparels Analysis, Insights and Forecast, 2020-2032
- 8.1. Market Analysis, Insights and Forecast - by Application
- 8.1.1. Men
- 8.1.2. Women
- 8.2. Market Analysis, Insights and Forecast - by Types
- 8.2.1. Jacket
- 8.2.2. Shirt
- 8.2.3. Trouser
- 8.2.4. Others
- 8.1. Market Analysis, Insights and Forecast - by Application
- 9. Europe Insect Repellent Apparels Analysis, Insights and Forecast, 2020-2032
- 9.1. Market Analysis, Insights and Forecast - by Application
- 9.1.1. Men
- 9.1.2. Women
- 9.2. Market Analysis, Insights and Forecast - by Types
- 9.2.1. Jacket
- 9.2.2. Shirt
- 9.2.3. Trouser
- 9.2.4. Others
- 9.1. Market Analysis, Insights and Forecast - by Application
- 10. Middle East & Africa Insect Repellent Apparels Analysis, Insights and Forecast, 2020-2032
- 10.1. Market Analysis, Insights and Forecast - by Application
- 10.1.1. Men
- 10.1.2. Women
- 10.2. Market Analysis, Insights and Forecast - by Types
- 10.2.1. Jacket
- 10.2.2. Shirt
- 10.2.3. Trouser
- 10.2.4. Others
- 10.1. Market Analysis, Insights and Forecast - by Application
- 11. Asia Pacific Insect Repellent Apparels Analysis, Insights and Forecast, 2020-2032
- 11.1. Market Analysis, Insights and Forecast - by Application
- 11.1.1. Men
- 11.1.2. Women
- 11.2. Market Analysis, Insights and Forecast - by Types
- 11.2.1. Jacket
- 11.2.2. Shirt
- 11.2.3. Trouser
- 11.2.4. Others
- 11.1. Market Analysis, Insights and Forecast - by Application
- 12. Competitive Analysis
- 12.1. Company Profiles
- 12.1.1 ExOfficio
- 12.1.1.1. Company Overview
- 12.1.1.2. Products
- 12.1.1.3. Company Financials
- 12.1.1.4. SWOT Analysis
- 12.1.2 LLC
- 12.1.2.1. Company Overview
- 12.1.2.2. Products
- 12.1.2.3. Company Financials
- 12.1.2.4. SWOT Analysis
- 12.1.3 Insect Shield
- 12.1.3.1. Company Overview
- 12.1.3.2. Products
- 12.1.3.3. Company Financials
- 12.1.3.4. SWOT Analysis
- 12.1.4 The Orvis Company
- 12.1.4.1. Company Overview
- 12.1.4.2. Products
- 12.1.4.3. Company Financials
- 12.1.4.4. SWOT Analysis
- 12.1.5 TOAD&CO
- 12.1.5.1. Company Overview
- 12.1.5.2. Products
- 12.1.5.3. Company Financials
- 12.1.5.4. SWOT Analysis
- 12.1.6 Rohan
- 12.1.6.1. Company Overview
- 12.1.6.2. Products
- 12.1.6.3. Company Financials
- 12.1.6.4. SWOT Analysis
- 12.1.7 Craghoppers
- 12.1.7.1. Company Overview
- 12.1.7.2. Products
- 12.1.7.3. Company Financials
- 12.1.7.4. SWOT Analysis
- 12.1.8 Royal Robbins
- 12.1.8.1. Company Overview
- 12.1.8.2. Products
- 12.1.8.3. Company Financials
- 12.1.8.4. SWOT Analysis
- 12.1.9 Dog Not Gone
- 12.1.9.1. Company Overview
- 12.1.9.2. Products
- 12.1.9.3. Company Financials
- 12.1.9.4. SWOT Analysis
- 12.1.10 Tyndale USA
- 12.1.10.1. Company Overview
- 12.1.10.2. Products
- 12.1.10.3. Company Financials
- 12.1.10.4. SWOT Analysis
- 12.1.11 Pang Wangle
- 12.1.11.1. Company Overview
- 12.1.11.2. Products
- 12.1.11.3. Company Financials
- 12.1.11.4. SWOT Analysis
- 12.1.12 NoBugs Ltd
- 12.1.12.1. Company Overview
- 12.1.12.2. Products
- 12.1.12.3. Company Financials
- 12.1.12.4. SWOT Analysis
- 12.1.13 Kathmandu
- 12.1.13.1. Company Overview
- 12.1.13.2. Products
- 12.1.13.3. Company Financials
- 12.1.13.4. SWOT Analysis
- 12.1.14 Craghoppers
- 12.1.14.1. Company Overview
- 12.1.14.2. Products
- 12.1.14.3. Company Financials
- 12.1.14.4. SWOT Analysis
- 12.1.1 ExOfficio
- 12.2. Market Entropy
- 12.2.1 Company's Key Areas Served
- 12.2.2 Recent Developments
- 12.3. Company Market Share Analysis 2025
- 12.3.1 Top 5 Companies Market Share Analysis
- 12.3.2 Top 3 Companies Market Share Analysis
- 12.4. List of Potential Customers
- 13. Research Methodology
List of Figures
- Figure 1: Global Insect Repellent Apparels Revenue Breakdown (undefined, %) by Region 2025 & 2033
- Figure 2: Global Insect Repellent Apparels Volume Breakdown (K, %) by Region 2025 & 2033
- Figure 3: North America Insect Repellent Apparels Revenue (undefined), by Application 2025 & 2033
- Figure 4: North America Insect Repellent Apparels Volume (K), by Application 2025 & 2033
- Figure 5: North America Insect Repellent Apparels Revenue Share (%), by Application 2025 & 2033
- Figure 6: North America Insect Repellent Apparels Volume Share (%), by Application 2025 & 2033
- Figure 7: North America Insect Repellent Apparels Revenue (undefined), by Types 2025 & 2033
- Figure 8: North America Insect Repellent Apparels Volume (K), by Types 2025 & 2033
- Figure 9: North America Insect Repellent Apparels Revenue Share (%), by Types 2025 & 2033
- Figure 10: North America Insect Repellent Apparels Volume Share (%), by Types 2025 & 2033
- Figure 11: North America Insect Repellent Apparels Revenue (undefined), by Country 2025 & 2033
- Figure 12: North America Insect Repellent Apparels Volume (K), by Country 2025 & 2033
- Figure 13: North America Insect Repellent Apparels Revenue Share (%), by Country 2025 & 2033
- Figure 14: North America Insect Repellent Apparels Volume Share (%), by Country 2025 & 2033
- Figure 15: South America Insect Repellent Apparels Revenue (undefined), by Application 2025 & 2033
- Figure 16: South America Insect Repellent Apparels Volume (K), by Application 2025 & 2033
- Figure 17: South America Insect Repellent Apparels Revenue Share (%), by Application 2025 & 2033
- Figure 18: South America Insect Repellent Apparels Volume Share (%), by Application 2025 & 2033
- Figure 19: South America Insect Repellent Apparels Revenue (undefined), by Types 2025 & 2033
- Figure 20: South America Insect Repellent Apparels Volume (K), by Types 2025 & 2033
- Figure 21: South America Insect Repellent Apparels Revenue Share (%), by Types 2025 & 2033
- Figure 22: South America Insect Repellent Apparels Volume Share (%), by Types 2025 & 2033
- Figure 23: South America Insect Repellent Apparels Revenue (undefined), by Country 2025 & 2033
- Figure 24: South America Insect Repellent Apparels Volume (K), by Country 2025 & 2033
- Figure 25: South America Insect Repellent Apparels Revenue Share (%), by Country 2025 & 2033
- Figure 26: South America Insect Repellent Apparels Volume Share (%), by Country 2025 & 2033
- Figure 27: Europe Insect Repellent Apparels Revenue (undefined), by Application 2025 & 2033
- Figure 28: Europe Insect Repellent Apparels Volume (K), by Application 2025 & 2033
- Figure 29: Europe Insect Repellent Apparels Revenue Share (%), by Application 2025 & 2033
- Figure 30: Europe Insect Repellent Apparels Volume Share (%), by Application 2025 & 2033
- Figure 31: Europe Insect Repellent Apparels Revenue (undefined), by Types 2025 & 2033
- Figure 32: Europe Insect Repellent Apparels Volume (K), by Types 2025 & 2033
- Figure 33: Europe Insect Repellent Apparels Revenue Share (%), by Types 2025 & 2033
- Figure 34: Europe Insect Repellent Apparels Volume Share (%), by Types 2025 & 2033
- Figure 35: Europe Insect Repellent Apparels Revenue (undefined), by Country 2025 & 2033
- Figure 36: Europe Insect Repellent Apparels Volume (K), by Country 2025 & 2033
- Figure 37: Europe Insect Repellent Apparels Revenue Share (%), by Country 2025 & 2033
- Figure 38: Europe Insect Repellent Apparels Volume Share (%), by Country 2025 & 2033
- Figure 39: Middle East & Africa Insect Repellent Apparels Revenue (undefined), by Application 2025 & 2033
- Figure 40: Middle East & Africa Insect Repellent Apparels Volume (K), by Application 2025 & 2033
- Figure 41: Middle East & Africa Insect Repellent Apparels Revenue Share (%), by Application 2025 & 2033
- Figure 42: Middle East & Africa Insect Repellent Apparels Volume Share (%), by Application 2025 & 2033
- Figure 43: Middle East & Africa Insect Repellent Apparels Revenue (undefined), by Types 2025 & 2033
- Figure 44: Middle East & Africa Insect Repellent Apparels Volume (K), by Types 2025 & 2033
- Figure 45: Middle East & Africa Insect Repellent Apparels Revenue Share (%), by Types 2025 & 2033
- Figure 46: Middle East & Africa Insect Repellent Apparels Volume Share (%), by Types 2025 & 2033
- Figure 47: Middle East & Africa Insect Repellent Apparels Revenue (undefined), by Country 2025 & 2033
- Figure 48: Middle East & Africa Insect Repellent Apparels Volume (K), by Country 2025 & 2033
- Figure 49: Middle East & Africa Insect Repellent Apparels Revenue Share (%), by Country 2025 & 2033
- Figure 50: Middle East & Africa Insect Repellent Apparels Volume Share (%), by Country 2025 & 2033
- Figure 51: Asia Pacific Insect Repellent Apparels Revenue (undefined), by Application 2025 & 2033
- Figure 52: Asia Pacific Insect Repellent Apparels Volume (K), by Application 2025 & 2033
- Figure 53: Asia Pacific Insect Repellent Apparels Revenue Share (%), by Application 2025 & 2033
- Figure 54: Asia Pacific Insect Repellent Apparels Volume Share (%), by Application 2025 & 2033
- Figure 55: Asia Pacific Insect Repellent Apparels Revenue (undefined), by Types 2025 & 2033
- Figure 56: Asia Pacific Insect Repellent Apparels Volume (K), by Types 2025 & 2033
- Figure 57: Asia Pacific Insect Repellent Apparels Revenue Share (%), by Types 2025 & 2033
- Figure 58: Asia Pacific Insect Repellent Apparels Volume Share (%), by Types 2025 & 2033
- Figure 59: Asia Pacific Insect Repellent Apparels Revenue (undefined), by Country 2025 & 2033
- Figure 60: Asia Pacific Insect Repellent Apparels Volume (K), by Country 2025 & 2033
- Figure 61: Asia Pacific Insect Repellent Apparels Revenue Share (%), by Country 2025 & 2033
- Figure 62: Asia Pacific Insect Repellent Apparels Volume Share (%), by Country 2025 & 2033
List of Tables
- Table 1: Global Insect Repellent Apparels Revenue undefined Forecast, by Application 2020 & 2033
- Table 2: Global Insect Repellent Apparels Volume K Forecast, by Application 2020 & 2033
- Table 3: Global Insect Repellent Apparels Revenue undefined Forecast, by Types 2020 & 2033
- Table 4: Global Insect Repellent Apparels Volume K Forecast, by Types 2020 & 2033
- Table 5: Global Insect Repellent Apparels Revenue undefined Forecast, by Region 2020 & 2033
- Table 6: Global Insect Repellent Apparels Volume K Forecast, by Region 2020 & 2033
- Table 7: Global Insect Repellent Apparels Revenue undefined Forecast, by Application 2020 & 2033
- Table 8: Global Insect Repellent Apparels Volume K Forecast, by Application 2020 & 2033
- Table 9: Global Insect Repellent Apparels Revenue undefined Forecast, by Types 2020 & 2033
- Table 10: Global Insect Repellent Apparels Volume K Forecast, by Types 2020 & 2033
- Table 11: Global Insect Repellent Apparels Revenue undefined Forecast, by Country 2020 & 2033
- Table 12: Global Insect Repellent Apparels Volume K Forecast, by Country 2020 & 2033
- Table 13: United States Insect Repellent Apparels Revenue (undefined) Forecast, by Application 2020 & 2033
- Table 14: United States Insect Repellent Apparels Volume (K) Forecast, by Application 2020 & 2033
- Table 15: Canada Insect Repellent Apparels Revenue (undefined) Forecast, by Application 2020 & 2033
- Table 16: Canada Insect Repellent Apparels Volume (K) Forecast, by Application 2020 & 2033
- Table 17: Mexico Insect Repellent Apparels Revenue (undefined) Forecast, by Application 2020 & 2033
- Table 18: Mexico Insect Repellent Apparels Volume (K) Forecast, by Application 2020 & 2033
- Table 19: Global Insect Repellent Apparels Revenue undefined Forecast, by Application 2020 & 2033
- Table 20: Global Insect Repellent Apparels Volume K Forecast, by Application 2020 & 2033
- Table 21: Global Insect Repellent Apparels Revenue undefined Forecast, by Types 2020 & 2033
- Table 22: Global Insect Repellent Apparels Volume K Forecast, by Types 2020 & 2033
- Table 23: Global Insect Repellent Apparels Revenue undefined Forecast, by Country 2020 & 2033
- Table 24: Global Insect Repellent Apparels Volume K Forecast, by Country 2020 & 2033
- Table 25: Brazil Insect Repellent Apparels Revenue (undefined) Forecast, by Application 2020 & 2033
- Table 26: Brazil Insect Repellent Apparels Volume (K) Forecast, by Application 2020 & 2033
- Table 27: Argentina Insect Repellent Apparels Revenue (undefined) Forecast, by Application 2020 & 2033
- Table 28: Argentina Insect Repellent Apparels Volume (K) Forecast, by Application 2020 & 2033
- Table 29: Rest of South America Insect Repellent Apparels Revenue (undefined) Forecast, by Application 2020 & 2033
- Table 30: Rest of South America Insect Repellent Apparels Volume (K) Forecast, by Application 2020 & 2033
- Table 31: Global Insect Repellent Apparels Revenue undefined Forecast, by Application 2020 & 2033
- Table 32: Global Insect Repellent Apparels Volume K Forecast, by Application 2020 & 2033
- Table 33: Global Insect Repellent Apparels Revenue undefined Forecast, by Types 2020 & 2033
- Table 34: Global Insect Repellent Apparels Volume K Forecast, by Types 2020 & 2033
- Table 35: Global Insect Repellent Apparels Revenue undefined Forecast, by Country 2020 & 2033
- Table 36: Global Insect Repellent Apparels Volume K Forecast, by Country 2020 & 2033
- Table 37: United Kingdom Insect Repellent Apparels Revenue (undefined) Forecast, by Application 2020 & 2033
- Table 38: United Kingdom Insect Repellent Apparels Volume (K) Forecast, by Application 2020 & 2033
- Table 39: Germany Insect Repellent Apparels Revenue (undefined) Forecast, by Application 2020 & 2033
- Table 40: Germany Insect Repellent Apparels Volume (K) Forecast, by Application 2020 & 2033
- Table 41: France Insect Repellent Apparels Revenue (undefined) Forecast, by Application 2020 & 2033
- Table 42: France Insect Repellent Apparels Volume (K) Forecast, by Application 2020 & 2033
- Table 43: Italy Insect Repellent Apparels Revenue (undefined) Forecast, by Application 2020 & 2033
- Table 44: Italy Insect Repellent Apparels Volume (K) Forecast, by Application 2020 & 2033
- Table 45: Spain Insect Repellent Apparels Revenue (undefined) Forecast, by Application 2020 & 2033
- Table 46: Spain Insect Repellent Apparels Volume (K) Forecast, by Application 2020 & 2033
- Table 47: Russia Insect Repellent Apparels Revenue (undefined) Forecast, by Application 2020 & 2033
- Table 48: Russia Insect Repellent Apparels Volume (K) Forecast, by Application 2020 & 2033
- Table 49: Benelux Insect Repellent Apparels Revenue (undefined) Forecast, by Application 2020 & 2033
- Table 50: Benelux Insect Repellent Apparels Volume (K) Forecast, by Application 2020 & 2033
- Table 51: Nordics Insect Repellent Apparels Revenue (undefined) Forecast, by Application 2020 & 2033
- Table 52: Nordics Insect Repellent Apparels Volume (K) Forecast, by Application 2020 & 2033
- Table 53: Rest of Europe Insect Repellent Apparels Revenue (undefined) Forecast, by Application 2020 & 2033
- Table 54: Rest of Europe Insect Repellent Apparels Volume (K) Forecast, by Application 2020 & 2033
- Table 55: Global Insect Repellent Apparels Revenue undefined Forecast, by Application 2020 & 2033
- Table 56: Global Insect Repellent Apparels Volume K Forecast, by Application 2020 & 2033
- Table 57: Global Insect Repellent Apparels Revenue undefined Forecast, by Types 2020 & 2033
- Table 58: Global Insect Repellent Apparels Volume K Forecast, by Types 2020 & 2033
- Table 59: Global Insect Repellent Apparels Revenue undefined Forecast, by Country 2020 & 2033
- Table 60: Global Insect Repellent Apparels Volume K Forecast, by Country 2020 & 2033
- Table 61: Turkey Insect Repellent Apparels Revenue (undefined) Forecast, by Application 2020 & 2033
- Table 62: Turkey Insect Repellent Apparels Volume (K) Forecast, by Application 2020 & 2033
- Table 63: Israel Insect Repellent Apparels Revenue (undefined) Forecast, by Application 2020 & 2033
- Table 64: Israel Insect Repellent Apparels Volume (K) Forecast, by Application 2020 & 2033
- Table 65: GCC Insect Repellent Apparels Revenue (undefined) Forecast, by Application 2020 & 2033
- Table 66: GCC Insect Repellent Apparels Volume (K) Forecast, by Application 2020 & 2033
- Table 67: North Africa Insect Repellent Apparels Revenue (undefined) Forecast, by Application 2020 & 2033
- Table 68: North Africa Insect Repellent Apparels Volume (K) Forecast, by Application 2020 & 2033
- Table 69: South Africa Insect Repellent Apparels Revenue (undefined) Forecast, by Application 2020 & 2033
- Table 70: South Africa Insect Repellent Apparels Volume (K) Forecast, by Application 2020 & 2033
- Table 71: Rest of Middle East & Africa Insect Repellent Apparels Revenue (undefined) Forecast, by Application 2020 & 2033
- Table 72: Rest of Middle East & Africa Insect Repellent Apparels Volume (K) Forecast, by Application 2020 & 2033
- Table 73: Global Insect Repellent Apparels Revenue undefined Forecast, by Application 2020 & 2033
- Table 74: Global Insect Repellent Apparels Volume K Forecast, by Application 2020 & 2033
- Table 75: Global Insect Repellent Apparels Revenue undefined Forecast, by Types 2020 & 2033
- Table 76: Global Insect Repellent Apparels Volume K Forecast, by Types 2020 & 2033
- Table 77: Global Insect Repellent Apparels Revenue undefined Forecast, by Country 2020 & 2033
- Table 78: Global Insect Repellent Apparels Volume K Forecast, by Country 2020 & 2033
- Table 79: China Insect Repellent Apparels Revenue (undefined) Forecast, by Application 2020 & 2033
- Table 80: China Insect Repellent Apparels Volume (K) Forecast, by Application 2020 & 2033
- Table 81: India Insect Repellent Apparels Revenue (undefined) Forecast, by Application 2020 & 2033
- Table 82: India Insect Repellent Apparels Volume (K) Forecast, by Application 2020 & 2033
- Table 83: Japan Insect Repellent Apparels Revenue (undefined) Forecast, by Application 2020 & 2033
- Table 84: Japan Insect Repellent Apparels Volume (K) Forecast, by Application 2020 & 2033
- Table 85: South Korea Insect Repellent Apparels Revenue (undefined) Forecast, by Application 2020 & 2033
- Table 86: South Korea Insect Repellent Apparels Volume (K) Forecast, by Application 2020 & 2033
- Table 87: ASEAN Insect Repellent Apparels Revenue (undefined) Forecast, by Application 2020 & 2033
- Table 88: ASEAN Insect Repellent Apparels Volume (K) Forecast, by Application 2020 & 2033
- Table 89: Oceania Insect Repellent Apparels Revenue (undefined) Forecast, by Application 2020 & 2033
- Table 90: Oceania Insect Repellent Apparels Volume (K) Forecast, by Application 2020 & 2033
- Table 91: Rest of Asia Pacific Insect Repellent Apparels Revenue (undefined) Forecast, by Application 2020 & 2033
- Table 92: Rest of Asia Pacific Insect Repellent Apparels Volume (K) Forecast, by Application 2020 & 2033
Frequently Asked Questions
1. What is the projected Compound Annual Growth Rate (CAGR) of the Insect Repellent Apparels?
The projected CAGR is approximately 6.7%.
2. Which companies are prominent players in the Insect Repellent Apparels?
Key companies in the market include ExOfficio, LLC, Insect Shield, The Orvis Company, TOAD&CO, Rohan, Craghoppers, Royal Robbins, Dog Not Gone, Tyndale USA, Pang Wangle, NoBugs Ltd, Kathmandu, Craghoppers.
3. What are the main segments of the Insect Repellent Apparels?
The market segments include Application, Types.
4. Can you provide details about the market size?
The market size is estimated to be USD XXX N/A as of 2022.
5. What are some drivers contributing to market growth?
N/A
6. What are the notable trends driving market growth?
N/A
7. Are there any restraints impacting market growth?
N/A
8. Can you provide examples of recent developments in the market?
N/A
9. What pricing options are available for accessing the report?
Pricing options include single-user, multi-user, and enterprise licenses priced at USD 3950.00, USD 5925.00, and USD 7900.00 respectively.
10. Is the market size provided in terms of value or volume?
The market size is provided in terms of value, measured in N/A and volume, measured in K.
11. Are there any specific market keywords associated with the report?
Yes, the market keyword associated with the report is "Insect Repellent Apparels," which aids in identifying and referencing the specific market segment covered.
12. How do I determine which pricing option suits my needs best?
The pricing options vary based on user requirements and access needs. Individual users may opt for single-user licenses, while businesses requiring broader access may choose multi-user or enterprise licenses for cost-effective access to the report.
13. Are there any additional resources or data provided in the Insect Repellent Apparels report?
While the report offers comprehensive insights, it's advisable to review the specific contents or supplementary materials provided to ascertain if additional resources or data are available.
14. How can I stay updated on further developments or reports in the Insect Repellent Apparels?
To stay informed about further developments, trends, and reports in the Insect Repellent Apparels, consider subscribing to industry newsletters, following relevant companies and organizations, or regularly checking reputable industry news sources and publications.
Methodology
Step 1 - Identification of Relevant Samples Size from Population Database


Step 2 - Approaches for Defining Global Market Size (Value, Volume* & Price*)

Note*: In applicable scenarios
Step 3 - Data Sources
Primary Research
- Web Analytics
- Survey Reports
- Research Institute
- Latest Research Reports
- Opinion Leaders
Secondary Research
- Annual Reports
- White Paper
- Latest Press Release
- Industry Association
- Paid Database
- Investor Presentations

Step 4 - Data Triangulation
Involves using different sources of information in order to increase the validity of a study
These sources are likely to be stakeholders in a program - participants, other researchers, program staff, other community members, and so on.
Then we put all data in single framework & apply various statistical tools to find out the dynamic on the market.
During the analysis stage, feedback from the stakeholder groups would be compared to determine areas of agreement as well as areas of divergence