

Key Insights
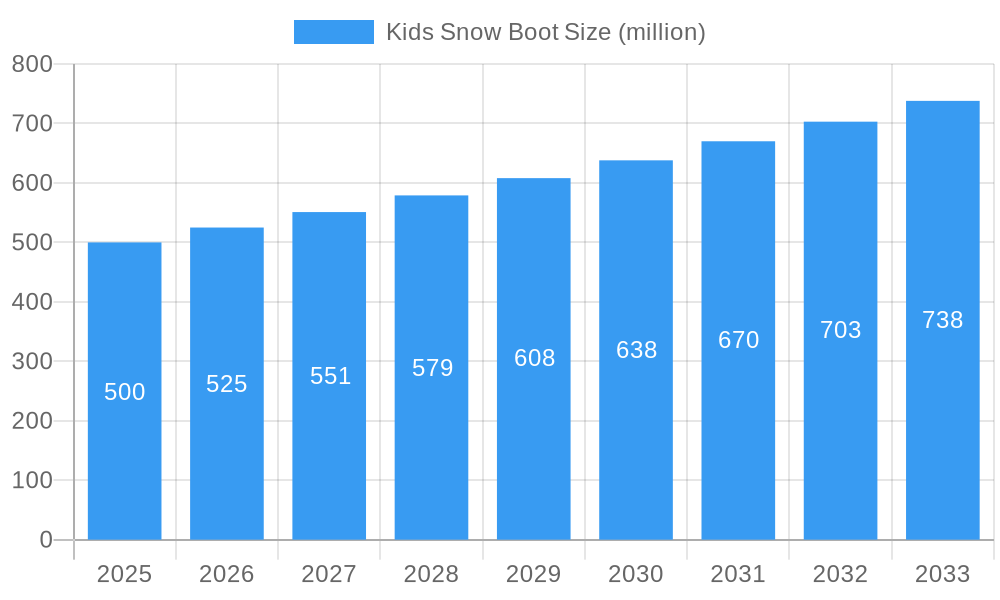
The kids' snow boot market, while exhibiting a fluctuating nature influenced by weather patterns and economic conditions, demonstrates consistent growth potential. The market size in 2025 is estimated at $500 million, projected to achieve a Compound Annual Growth Rate (CAGR) of 5% from 2025 to 2033. Key drivers include increasing participation in winter sports among children, rising disposable incomes in key markets, and a growing emphasis on children's safety and comfort during outdoor activities. Furthermore, innovative designs focusing on waterproofing, insulation, and stylish aesthetics contribute to market expansion. Trends such as eco-friendly materials and sustainable manufacturing practices are gaining traction, influencing consumer choices. However, challenges remain, including the seasonality of demand, price sensitivity among consumers, and potential disruptions in supply chains due to geopolitical factors. The market is segmented by boot type (e.g., waterproof, insulated, etc.), price range, and age group, with major players such as Reima, Decathlon, Muck Boot, Muddy Puddles, and Dr. Martens competing for market share through product differentiation and brand building. Regional variations in market size and growth are expected, with developed economies in North America and Europe exhibiting stronger growth compared to developing markets, although this could change as disposable incomes rise in regions like Asia.
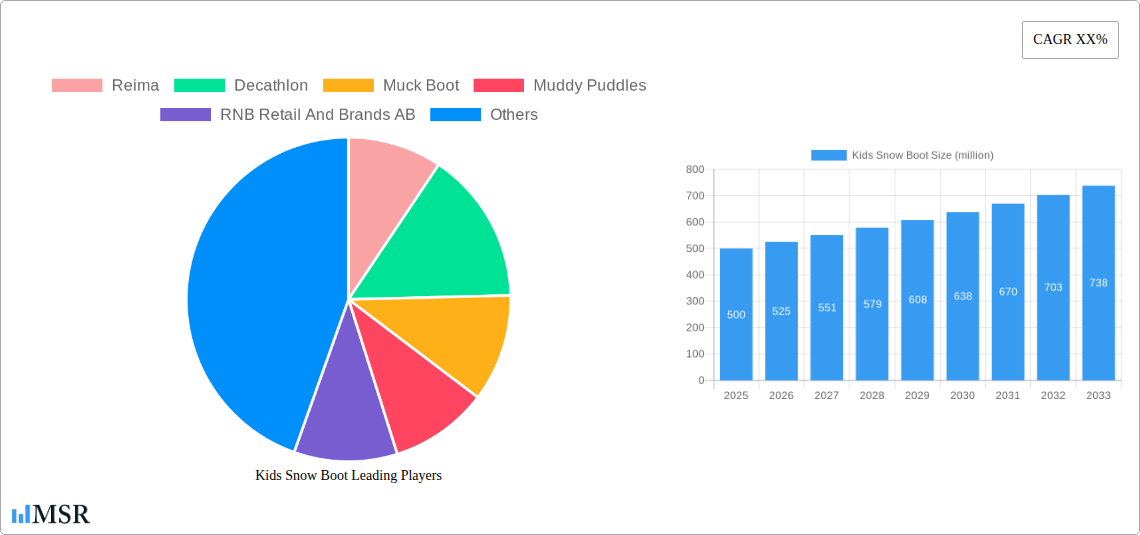
Kids Snow Boot Market Size (In Million)
The competitive landscape is dynamic, with established brands leveraging their strong brand recognition and distribution networks while newer entrants focus on niche markets or innovative technologies. Successful companies are increasingly focusing on integrating sustainable practices into their supply chains, adopting omnichannel strategies (blending online and offline retail), and investing in marketing campaigns targeted at parents and children. The forecast period (2025-2033) presents ample opportunities for growth, particularly for brands that can cater to the evolving needs and preferences of consumers. This includes a focus on durable, functional, and stylish designs that meet safety requirements while emphasizing sustainability. Future growth will depend on adapting to changing consumer demands, innovative product development, and effective marketing strategies.
Kids Snow Boot Company Market Share
Dive Deep into the Multi-Million Dollar Kids Snow Boot Market: A Comprehensive Report (2019-2033)
This comprehensive report provides an in-depth analysis of the global kids snow boot market, projecting a value exceeding $XX million by 2033. It unveils key market dynamics, growth drivers, challenges, and emerging opportunities, offering invaluable insights for industry stakeholders, investors, and businesses operating within this lucrative sector. The report covers the historical period (2019-2024), base year (2025), and forecast period (2025-2033), providing a holistic view of market evolution.
Kids Snow Boot Market Concentration & Dynamics
The global kids snow boot market exhibits a moderately concentrated landscape, with key players such as Reima, Decathlon, Muck Boot, and Muddy Puddles holding significant market share. The combined market share of the top five players is estimated at xx%, as of 2025. Innovation ecosystems are vibrant, with ongoing R&D focused on improved insulation, waterproofing technologies, and sustainable materials. Regulatory frameworks concerning product safety and environmental impact play a significant role. Substitute products, such as insulated winter boots, pose a degree of competitive pressure, although the specialized design and functionality of snow boots maintain their market dominance. End-user trends indicate a growing preference for durable, comfortable, and stylish snow boots, with increasing demand for features like waterproof membranes and aggressive tread patterns. M&A activity in the sector has been relatively moderate in recent years, with approximately xx deals recorded between 2019 and 2024, primarily focused on expanding distribution channels and acquiring specialized technologies.
Kids Snow Boot Industry Insights & Trends
The global kids snow boot market is experiencing robust growth, driven primarily by increasing disposable incomes in developing economies and a surge in participation in winter sports among children. The market size is projected to reach $XX million in 2025, exhibiting a Compound Annual Growth Rate (CAGR) of xx% during the forecast period. Technological disruptions are influencing the market through innovations in material science, offering lighter, warmer, and more durable boots. Evolving consumer behaviors show a preference for online purchasing, creating opportunities for e-commerce platforms. Growing awareness of sustainability is leading to increased demand for eco-friendly materials and manufacturing processes. These factors, combined with fluctuating weather patterns in several key regions, are expected to propel market growth throughout the forecast period.
Key Markets & Segments Leading Kids Snow Boot
The North American region currently dominates the kids snow boot market, accounting for xx% of global sales in 2025. This dominance is driven by several factors:
- High disposable incomes: Enabling parents to invest in higher-quality snow boots.
- Developed retail infrastructure: Providing easy access to a wide range of products.
- Strong winter sports culture: Fueling demand for specialized footwear.
- Favorable climatic conditions: Contributing to higher usage rates.
Europe also holds a significant share of the market. While regional differences exist due to climatic variations and consumer preferences, the overall market is expected to see continued growth fueled by increased tourism related to winter sports. Specific country-level analyses within North America and Europe are detailed within the full report.
Kids Snow Boot Product Developments
Recent product innovations in kids' snow boots focus on enhanced waterproofing and breathability using advanced membrane technologies like Gore-Tex. Lightweight yet durable materials, such as recycled plastics, are gaining traction due to growing environmental concerns. Improved insulation keeps children's feet warm and dry in extreme cold, and design features like adjustable closures and easy-on/easy-off designs cater to the needs of young children. These innovations provide a competitive edge for manufacturers by offering enhanced functionality and appealing to environmentally conscious consumers.
Challenges in the Kids Snow Boot Market
The kids snow boot market faces several challenges. Supply chain disruptions and fluctuations in raw material costs impact production and pricing. Intense competition from established brands and new entrants puts pressure on profit margins. Stringent safety regulations in certain regions increase compliance costs. Economic downturns can reduce consumer spending on discretionary items like snow boots, leading to decreased sales. These factors collectively pose significant hurdles to market growth.
Forces Driving Kids Snow Boot Growth
Several factors contribute to the long-term growth of the kids snow boot market. Technological advancements in material science and manufacturing lead to lighter, warmer, and more sustainable boots. Increasing participation in winter sports among children drives demand for specialized footwear. Favorable government policies promoting outdoor recreation in some regions further stimulate growth. The increasing focus on sustainable and eco-friendly practices in manufacturing snow boots also presents a major opportunity to attract environment-conscious parents and contribute to positive growth.
Long-Term Growth Catalysts in Kids Snow Boot
Continued innovation in materials and design, particularly in the areas of sustainability and enhanced comfort, will be key to long-term growth. Strategic partnerships between brands and retailers will optimize distribution and reach a wider consumer base. Market expansion into emerging economies with growing middle classes offers substantial untapped potential.
Emerging Opportunities in Kids Snow Boot
The increasing demand for customizable and personalized snow boots presents a significant opportunity. The development of smart snow boots incorporating technology to monitor foot temperature and comfort is another area with potential. Expanding into new markets, particularly in Asia and South America, offers significant growth prospects. Focus on sustainable and ethical sourcing and manufacturing will attract environmentally conscious consumers.
Key Milestones in Kids Snow Boot Industry
- 2020: Increased focus on sustainable materials by several key players.
- 2022: Launch of several new models incorporating advanced waterproofing technologies.
- 2023: Significant investment in e-commerce platforms by major brands.
- 2024: Growing adoption of recycled materials in snow boot manufacturing.
Strategic Outlook for Kids Snow Boot Market
The kids snow boot market is poised for continued growth, driven by innovation, increasing consumer spending, and expansion into new markets. Strategic partnerships, investment in sustainable practices, and a focus on customer experience will be crucial for success. The market presents significant opportunities for established players and new entrants to capture market share by effectively catering to the evolving needs and preferences of consumers.
Kids Snow Boot Segmentation
-
1. Application
- 1.1. Online Sales
- 1.2. Offline Sales
-
2. Types
- 2.1. $25 - $50($/Pair)
- 2.2. $51 - $100($/Pair)
- 2.3. $101 - $150($/Pair)
Kids Snow Boot Segmentation By Geography
-
1. North America
- 1.1. United States
- 1.2. Canada
- 1.3. Mexico
-
2. South America
- 2.1. Brazil
- 2.2. Argentina
- 2.3. Rest of South America
-
3. Europe
- 3.1. United Kingdom
- 3.2. Germany
- 3.3. France
- 3.4. Italy
- 3.5. Spain
- 3.6. Russia
- 3.7. Benelux
- 3.8. Nordics
- 3.9. Rest of Europe
-
4. Middle East & Africa
- 4.1. Turkey
- 4.2. Israel
- 4.3. GCC
- 4.4. North Africa
- 4.5. South Africa
- 4.6. Rest of Middle East & Africa
-
5. Asia Pacific
- 5.1. China
- 5.2. India
- 5.3. Japan
- 5.4. South Korea
- 5.5. ASEAN
- 5.6. Oceania
- 5.7. Rest of Asia Pacific

Kids Snow Boot Regional Market Share
Geographic Coverage of Kids Snow Boot
Kids Snow Boot REPORT HIGHLIGHTS
| Aspects | Details |
|---|---|
| Study Period | 2020-2034 |
| Base Year | 2025 |
| Estimated Year | 2026 |
| Forecast Period | 2026-2034 |
| Historical Period | 2020-2025 |
| Growth Rate | CAGR of XX% from 2020-2034 |
| Segmentation |
|
Table of Contents
- 1. Introduction
- 1.1. Research Scope
- 1.2. Market Segmentation
- 1.3. Research Methodology
- 1.4. Definitions and Assumptions
- 2. Executive Summary
- 2.1. Introduction
- 3. Market Dynamics
- 3.1. Introduction
- 3.2. Market Drivers
- 3.3. Market Restrains
- 3.4. Market Trends
- 4. Market Factor Analysis
- 4.1. Porters Five Forces
- 4.2. Supply/Value Chain
- 4.3. PESTEL analysis
- 4.4. Market Entropy
- 4.5. Patent/Trademark Analysis
- 5. Global Kids Snow Boot Analysis, Insights and Forecast, 2020-2032
- 5.1. Market Analysis, Insights and Forecast - by Application
- 5.1.1. Online Sales
- 5.1.2. Offline Sales
- 5.2. Market Analysis, Insights and Forecast - by Types
- 5.2.1. $25 - $50($/Pair)
- 5.2.2. $51 - $100($/Pair)
- 5.2.3. $101 - $150($/Pair)
- 5.3. Market Analysis, Insights and Forecast - by Region
- 5.3.1. North America
- 5.3.2. South America
- 5.3.3. Europe
- 5.3.4. Middle East & Africa
- 5.3.5. Asia Pacific
- 5.1. Market Analysis, Insights and Forecast - by Application
- 6. North America Kids Snow Boot Analysis, Insights and Forecast, 2020-2032
- 6.1. Market Analysis, Insights and Forecast - by Application
- 6.1.1. Online Sales
- 6.1.2. Offline Sales
- 6.2. Market Analysis, Insights and Forecast - by Types
- 6.2.1. $25 - $50($/Pair)
- 6.2.2. $51 - $100($/Pair)
- 6.2.3. $101 - $150($/Pair)
- 6.1. Market Analysis, Insights and Forecast - by Application
- 7. South America Kids Snow Boot Analysis, Insights and Forecast, 2020-2032
- 7.1. Market Analysis, Insights and Forecast - by Application
- 7.1.1. Online Sales
- 7.1.2. Offline Sales
- 7.2. Market Analysis, Insights and Forecast - by Types
- 7.2.1. $25 - $50($/Pair)
- 7.2.2. $51 - $100($/Pair)
- 7.2.3. $101 - $150($/Pair)
- 7.1. Market Analysis, Insights and Forecast - by Application
- 8. Europe Kids Snow Boot Analysis, Insights and Forecast, 2020-2032
- 8.1. Market Analysis, Insights and Forecast - by Application
- 8.1.1. Online Sales
- 8.1.2. Offline Sales
- 8.2. Market Analysis, Insights and Forecast - by Types
- 8.2.1. $25 - $50($/Pair)
- 8.2.2. $51 - $100($/Pair)
- 8.2.3. $101 - $150($/Pair)
- 8.1. Market Analysis, Insights and Forecast - by Application
- 9. Middle East & Africa Kids Snow Boot Analysis, Insights and Forecast, 2020-2032
- 9.1. Market Analysis, Insights and Forecast - by Application
- 9.1.1. Online Sales
- 9.1.2. Offline Sales
- 9.2. Market Analysis, Insights and Forecast - by Types
- 9.2.1. $25 - $50($/Pair)
- 9.2.2. $51 - $100($/Pair)
- 9.2.3. $101 - $150($/Pair)
- 9.1. Market Analysis, Insights and Forecast - by Application
- 10. Asia Pacific Kids Snow Boot Analysis, Insights and Forecast, 2020-2032
- 10.1. Market Analysis, Insights and Forecast - by Application
- 10.1.1. Online Sales
- 10.1.2. Offline Sales
- 10.2. Market Analysis, Insights and Forecast - by Types
- 10.2.1. $25 - $50($/Pair)
- 10.2.2. $51 - $100($/Pair)
- 10.2.3. $101 - $150($/Pair)
- 10.1. Market Analysis, Insights and Forecast - by Application
- 11. Competitive Analysis
- 11.1. Global Market Share Analysis 2025
- 11.2. Company Profiles
- 11.2.1 Reima
- 11.2.1.1. Overview
- 11.2.1.2. Products
- 11.2.1.3. SWOT Analysis
- 11.2.1.4. Recent Developments
- 11.2.1.5. Financials (Based on Availability)
- 11.2.2 Decathlon
- 11.2.2.1. Overview
- 11.2.2.2. Products
- 11.2.2.3. SWOT Analysis
- 11.2.2.4. Recent Developments
- 11.2.2.5. Financials (Based on Availability)
- 11.2.3 Muck Boot
- 11.2.3.1. Overview
- 11.2.3.2. Products
- 11.2.3.3. SWOT Analysis
- 11.2.3.4. Recent Developments
- 11.2.3.5. Financials (Based on Availability)
- 11.2.4 Muddy Puddles
- 11.2.4.1. Overview
- 11.2.4.2. Products
- 11.2.4.3. SWOT Analysis
- 11.2.4.4. Recent Developments
- 11.2.4.5. Financials (Based on Availability)
- 11.2.5 RNB Retail And Brands AB
- 11.2.5.1. Overview
- 11.2.5.2. Products
- 11.2.5.3. SWOT Analysis
- 11.2.5.4. Recent Developments
- 11.2.5.5. Financials (Based on Availability)
- 11.2.6 Ellis Brigham
- 11.2.6.1. Overview
- 11.2.6.2. Products
- 11.2.6.3. SWOT Analysis
- 11.2.6.4. Recent Developments
- 11.2.6.5. Financials (Based on Availability)
- 11.2.7 JoJo Maman Bébé
- 11.2.7.1. Overview
- 11.2.7.2. Products
- 11.2.7.3. SWOT Analysis
- 11.2.7.4. Recent Developments
- 11.2.7.5. Financials (Based on Availability)
- 11.2.8 Dr Martens
- 11.2.8.1. Overview
- 11.2.8.2. Products
- 11.2.8.3. SWOT Analysis
- 11.2.8.4. Recent Developments
- 11.2.8.5. Financials (Based on Availability)
- 11.2.1 Reima
List of Figures
- Figure 1: Global Kids Snow Boot Revenue Breakdown (million, %) by Region 2025 & 2033
- Figure 2: Global Kids Snow Boot Volume Breakdown (K, %) by Region 2025 & 2033
- Figure 3: North America Kids Snow Boot Revenue (million), by Application 2025 & 2033
- Figure 4: North America Kids Snow Boot Volume (K), by Application 2025 & 2033
- Figure 5: North America Kids Snow Boot Revenue Share (%), by Application 2025 & 2033
- Figure 6: North America Kids Snow Boot Volume Share (%), by Application 2025 & 2033
- Figure 7: North America Kids Snow Boot Revenue (million), by Types 2025 & 2033
- Figure 8: North America Kids Snow Boot Volume (K), by Types 2025 & 2033
- Figure 9: North America Kids Snow Boot Revenue Share (%), by Types 2025 & 2033
- Figure 10: North America Kids Snow Boot Volume Share (%), by Types 2025 & 2033
- Figure 11: North America Kids Snow Boot Revenue (million), by Country 2025 & 2033
- Figure 12: North America Kids Snow Boot Volume (K), by Country 2025 & 2033
- Figure 13: North America Kids Snow Boot Revenue Share (%), by Country 2025 & 2033
- Figure 14: North America Kids Snow Boot Volume Share (%), by Country 2025 & 2033
- Figure 15: South America Kids Snow Boot Revenue (million), by Application 2025 & 2033
- Figure 16: South America Kids Snow Boot Volume (K), by Application 2025 & 2033
- Figure 17: South America Kids Snow Boot Revenue Share (%), by Application 2025 & 2033
- Figure 18: South America Kids Snow Boot Volume Share (%), by Application 2025 & 2033
- Figure 19: South America Kids Snow Boot Revenue (million), by Types 2025 & 2033
- Figure 20: South America Kids Snow Boot Volume (K), by Types 2025 & 2033
- Figure 21: South America Kids Snow Boot Revenue Share (%), by Types 2025 & 2033
- Figure 22: South America Kids Snow Boot Volume Share (%), by Types 2025 & 2033
- Figure 23: South America Kids Snow Boot Revenue (million), by Country 2025 & 2033
- Figure 24: South America Kids Snow Boot Volume (K), by Country 2025 & 2033
- Figure 25: South America Kids Snow Boot Revenue Share (%), by Country 2025 & 2033
- Figure 26: South America Kids Snow Boot Volume Share (%), by Country 2025 & 2033
- Figure 27: Europe Kids Snow Boot Revenue (million), by Application 2025 & 2033
- Figure 28: Europe Kids Snow Boot Volume (K), by Application 2025 & 2033
- Figure 29: Europe Kids Snow Boot Revenue Share (%), by Application 2025 & 2033
- Figure 30: Europe Kids Snow Boot Volume Share (%), by Application 2025 & 2033
- Figure 31: Europe Kids Snow Boot Revenue (million), by Types 2025 & 2033
- Figure 32: Europe Kids Snow Boot Volume (K), by Types 2025 & 2033
- Figure 33: Europe Kids Snow Boot Revenue Share (%), by Types 2025 & 2033
- Figure 34: Europe Kids Snow Boot Volume Share (%), by Types 2025 & 2033
- Figure 35: Europe Kids Snow Boot Revenue (million), by Country 2025 & 2033
- Figure 36: Europe Kids Snow Boot Volume (K), by Country 2025 & 2033
- Figure 37: Europe Kids Snow Boot Revenue Share (%), by Country 2025 & 2033
- Figure 38: Europe Kids Snow Boot Volume Share (%), by Country 2025 & 2033
- Figure 39: Middle East & Africa Kids Snow Boot Revenue (million), by Application 2025 & 2033
- Figure 40: Middle East & Africa Kids Snow Boot Volume (K), by Application 2025 & 2033
- Figure 41: Middle East & Africa Kids Snow Boot Revenue Share (%), by Application 2025 & 2033
- Figure 42: Middle East & Africa Kids Snow Boot Volume Share (%), by Application 2025 & 2033
- Figure 43: Middle East & Africa Kids Snow Boot Revenue (million), by Types 2025 & 2033
- Figure 44: Middle East & Africa Kids Snow Boot Volume (K), by Types 2025 & 2033
- Figure 45: Middle East & Africa Kids Snow Boot Revenue Share (%), by Types 2025 & 2033
- Figure 46: Middle East & Africa Kids Snow Boot Volume Share (%), by Types 2025 & 2033
- Figure 47: Middle East & Africa Kids Snow Boot Revenue (million), by Country 2025 & 2033
- Figure 48: Middle East & Africa Kids Snow Boot Volume (K), by Country 2025 & 2033
- Figure 49: Middle East & Africa Kids Snow Boot Revenue Share (%), by Country 2025 & 2033
- Figure 50: Middle East & Africa Kids Snow Boot Volume Share (%), by Country 2025 & 2033
- Figure 51: Asia Pacific Kids Snow Boot Revenue (million), by Application 2025 & 2033
- Figure 52: Asia Pacific Kids Snow Boot Volume (K), by Application 2025 & 2033
- Figure 53: Asia Pacific Kids Snow Boot Revenue Share (%), by Application 2025 & 2033
- Figure 54: Asia Pacific Kids Snow Boot Volume Share (%), by Application 2025 & 2033
- Figure 55: Asia Pacific Kids Snow Boot Revenue (million), by Types 2025 & 2033
- Figure 56: Asia Pacific Kids Snow Boot Volume (K), by Types 2025 & 2033
- Figure 57: Asia Pacific Kids Snow Boot Revenue Share (%), by Types 2025 & 2033
- Figure 58: Asia Pacific Kids Snow Boot Volume Share (%), by Types 2025 & 2033
- Figure 59: Asia Pacific Kids Snow Boot Revenue (million), by Country 2025 & 2033
- Figure 60: Asia Pacific Kids Snow Boot Volume (K), by Country 2025 & 2033
- Figure 61: Asia Pacific Kids Snow Boot Revenue Share (%), by Country 2025 & 2033
- Figure 62: Asia Pacific Kids Snow Boot Volume Share (%), by Country 2025 & 2033
List of Tables
- Table 1: Global Kids Snow Boot Revenue million Forecast, by Application 2020 & 2033
- Table 2: Global Kids Snow Boot Volume K Forecast, by Application 2020 & 2033
- Table 3: Global Kids Snow Boot Revenue million Forecast, by Types 2020 & 2033
- Table 4: Global Kids Snow Boot Volume K Forecast, by Types 2020 & 2033
- Table 5: Global Kids Snow Boot Revenue million Forecast, by Region 2020 & 2033
- Table 6: Global Kids Snow Boot Volume K Forecast, by Region 2020 & 2033
- Table 7: Global Kids Snow Boot Revenue million Forecast, by Application 2020 & 2033
- Table 8: Global Kids Snow Boot Volume K Forecast, by Application 2020 & 2033
- Table 9: Global Kids Snow Boot Revenue million Forecast, by Types 2020 & 2033
- Table 10: Global Kids Snow Boot Volume K Forecast, by Types 2020 & 2033
- Table 11: Global Kids Snow Boot Revenue million Forecast, by Country 2020 & 2033
- Table 12: Global Kids Snow Boot Volume K Forecast, by Country 2020 & 2033
- Table 13: United States Kids Snow Boot Revenue (million) Forecast, by Application 2020 & 2033
- Table 14: United States Kids Snow Boot Volume (K) Forecast, by Application 2020 & 2033
- Table 15: Canada Kids Snow Boot Revenue (million) Forecast, by Application 2020 & 2033
- Table 16: Canada Kids Snow Boot Volume (K) Forecast, by Application 2020 & 2033
- Table 17: Mexico Kids Snow Boot Revenue (million) Forecast, by Application 2020 & 2033
- Table 18: Mexico Kids Snow Boot Volume (K) Forecast, by Application 2020 & 2033
- Table 19: Global Kids Snow Boot Revenue million Forecast, by Application 2020 & 2033
- Table 20: Global Kids Snow Boot Volume K Forecast, by Application 2020 & 2033
- Table 21: Global Kids Snow Boot Revenue million Forecast, by Types 2020 & 2033
- Table 22: Global Kids Snow Boot Volume K Forecast, by Types 2020 & 2033
- Table 23: Global Kids Snow Boot Revenue million Forecast, by Country 2020 & 2033
- Table 24: Global Kids Snow Boot Volume K Forecast, by Country 2020 & 2033
- Table 25: Brazil Kids Snow Boot Revenue (million) Forecast, by Application 2020 & 2033
- Table 26: Brazil Kids Snow Boot Volume (K) Forecast, by Application 2020 & 2033
- Table 27: Argentina Kids Snow Boot Revenue (million) Forecast, by Application 2020 & 2033
- Table 28: Argentina Kids Snow Boot Volume (K) Forecast, by Application 2020 & 2033
- Table 29: Rest of South America Kids Snow Boot Revenue (million) Forecast, by Application 2020 & 2033
- Table 30: Rest of South America Kids Snow Boot Volume (K) Forecast, by Application 2020 & 2033
- Table 31: Global Kids Snow Boot Revenue million Forecast, by Application 2020 & 2033
- Table 32: Global Kids Snow Boot Volume K Forecast, by Application 2020 & 2033
- Table 33: Global Kids Snow Boot Revenue million Forecast, by Types 2020 & 2033
- Table 34: Global Kids Snow Boot Volume K Forecast, by Types 2020 & 2033
- Table 35: Global Kids Snow Boot Revenue million Forecast, by Country 2020 & 2033
- Table 36: Global Kids Snow Boot Volume K Forecast, by Country 2020 & 2033
- Table 37: United Kingdom Kids Snow Boot Revenue (million) Forecast, by Application 2020 & 2033
- Table 38: United Kingdom Kids Snow Boot Volume (K) Forecast, by Application 2020 & 2033
- Table 39: Germany Kids Snow Boot Revenue (million) Forecast, by Application 2020 & 2033
- Table 40: Germany Kids Snow Boot Volume (K) Forecast, by Application 2020 & 2033
- Table 41: France Kids Snow Boot Revenue (million) Forecast, by Application 2020 & 2033
- Table 42: France Kids Snow Boot Volume (K) Forecast, by Application 2020 & 2033
- Table 43: Italy Kids Snow Boot Revenue (million) Forecast, by Application 2020 & 2033
- Table 44: Italy Kids Snow Boot Volume (K) Forecast, by Application 2020 & 2033
- Table 45: Spain Kids Snow Boot Revenue (million) Forecast, by Application 2020 & 2033
- Table 46: Spain Kids Snow Boot Volume (K) Forecast, by Application 2020 & 2033
- Table 47: Russia Kids Snow Boot Revenue (million) Forecast, by Application 2020 & 2033
- Table 48: Russia Kids Snow Boot Volume (K) Forecast, by Application 2020 & 2033
- Table 49: Benelux Kids Snow Boot Revenue (million) Forecast, by Application 2020 & 2033
- Table 50: Benelux Kids Snow Boot Volume (K) Forecast, by Application 2020 & 2033
- Table 51: Nordics Kids Snow Boot Revenue (million) Forecast, by Application 2020 & 2033
- Table 52: Nordics Kids Snow Boot Volume (K) Forecast, by Application 2020 & 2033
- Table 53: Rest of Europe Kids Snow Boot Revenue (million) Forecast, by Application 2020 & 2033
- Table 54: Rest of Europe Kids Snow Boot Volume (K) Forecast, by Application 2020 & 2033
- Table 55: Global Kids Snow Boot Revenue million Forecast, by Application 2020 & 2033
- Table 56: Global Kids Snow Boot Volume K Forecast, by Application 2020 & 2033
- Table 57: Global Kids Snow Boot Revenue million Forecast, by Types 2020 & 2033
- Table 58: Global Kids Snow Boot Volume K Forecast, by Types 2020 & 2033
- Table 59: Global Kids Snow Boot Revenue million Forecast, by Country 2020 & 2033
- Table 60: Global Kids Snow Boot Volume K Forecast, by Country 2020 & 2033
- Table 61: Turkey Kids Snow Boot Revenue (million) Forecast, by Application 2020 & 2033
- Table 62: Turkey Kids Snow Boot Volume (K) Forecast, by Application 2020 & 2033
- Table 63: Israel Kids Snow Boot Revenue (million) Forecast, by Application 2020 & 2033
- Table 64: Israel Kids Snow Boot Volume (K) Forecast, by Application 2020 & 2033
- Table 65: GCC Kids Snow Boot Revenue (million) Forecast, by Application 2020 & 2033
- Table 66: GCC Kids Snow Boot Volume (K) Forecast, by Application 2020 & 2033
- Table 67: North Africa Kids Snow Boot Revenue (million) Forecast, by Application 2020 & 2033
- Table 68: North Africa Kids Snow Boot Volume (K) Forecast, by Application 2020 & 2033
- Table 69: South Africa Kids Snow Boot Revenue (million) Forecast, by Application 2020 & 2033
- Table 70: South Africa Kids Snow Boot Volume (K) Forecast, by Application 2020 & 2033
- Table 71: Rest of Middle East & Africa Kids Snow Boot Revenue (million) Forecast, by Application 2020 & 2033
- Table 72: Rest of Middle East & Africa Kids Snow Boot Volume (K) Forecast, by Application 2020 & 2033
- Table 73: Global Kids Snow Boot Revenue million Forecast, by Application 2020 & 2033
- Table 74: Global Kids Snow Boot Volume K Forecast, by Application 2020 & 2033
- Table 75: Global Kids Snow Boot Revenue million Forecast, by Types 2020 & 2033
- Table 76: Global Kids Snow Boot Volume K Forecast, by Types 2020 & 2033
- Table 77: Global Kids Snow Boot Revenue million Forecast, by Country 2020 & 2033
- Table 78: Global Kids Snow Boot Volume K Forecast, by Country 2020 & 2033
- Table 79: China Kids Snow Boot Revenue (million) Forecast, by Application 2020 & 2033
- Table 80: China Kids Snow Boot Volume (K) Forecast, by Application 2020 & 2033
- Table 81: India Kids Snow Boot Revenue (million) Forecast, by Application 2020 & 2033
- Table 82: India Kids Snow Boot Volume (K) Forecast, by Application 2020 & 2033
- Table 83: Japan Kids Snow Boot Revenue (million) Forecast, by Application 2020 & 2033
- Table 84: Japan Kids Snow Boot Volume (K) Forecast, by Application 2020 & 2033
- Table 85: South Korea Kids Snow Boot Revenue (million) Forecast, by Application 2020 & 2033
- Table 86: South Korea Kids Snow Boot Volume (K) Forecast, by Application 2020 & 2033
- Table 87: ASEAN Kids Snow Boot Revenue (million) Forecast, by Application 2020 & 2033
- Table 88: ASEAN Kids Snow Boot Volume (K) Forecast, by Application 2020 & 2033
- Table 89: Oceania Kids Snow Boot Revenue (million) Forecast, by Application 2020 & 2033
- Table 90: Oceania Kids Snow Boot Volume (K) Forecast, by Application 2020 & 2033
- Table 91: Rest of Asia Pacific Kids Snow Boot Revenue (million) Forecast, by Application 2020 & 2033
- Table 92: Rest of Asia Pacific Kids Snow Boot Volume (K) Forecast, by Application 2020 & 2033
Frequently Asked Questions
1. What is the projected Compound Annual Growth Rate (CAGR) of the Kids Snow Boot?
The projected CAGR is approximately XX%.
2. Which companies are prominent players in the Kids Snow Boot?
Key companies in the market include Reima, Decathlon, Muck Boot, Muddy Puddles, RNB Retail And Brands AB, Ellis Brigham, JoJo Maman Bébé, Dr Martens.
3. What are the main segments of the Kids Snow Boot?
The market segments include Application, Types.
4. Can you provide details about the market size?
The market size is estimated to be USD XXX million as of 2022.
5. What are some drivers contributing to market growth?
N/A
6. What are the notable trends driving market growth?
N/A
7. Are there any restraints impacting market growth?
N/A
8. Can you provide examples of recent developments in the market?
N/A
9. What pricing options are available for accessing the report?
Pricing options include single-user, multi-user, and enterprise licenses priced at USD 3350.00, USD 5025.00, and USD 6700.00 respectively.
10. Is the market size provided in terms of value or volume?
The market size is provided in terms of value, measured in million and volume, measured in K.
11. Are there any specific market keywords associated with the report?
Yes, the market keyword associated with the report is "Kids Snow Boot," which aids in identifying and referencing the specific market segment covered.
12. How do I determine which pricing option suits my needs best?
The pricing options vary based on user requirements and access needs. Individual users may opt for single-user licenses, while businesses requiring broader access may choose multi-user or enterprise licenses for cost-effective access to the report.
13. Are there any additional resources or data provided in the Kids Snow Boot report?
While the report offers comprehensive insights, it's advisable to review the specific contents or supplementary materials provided to ascertain if additional resources or data are available.
14. How can I stay updated on further developments or reports in the Kids Snow Boot?
To stay informed about further developments, trends, and reports in the Kids Snow Boot, consider subscribing to industry newsletters, following relevant companies and organizations, or regularly checking reputable industry news sources and publications.
Methodology
Step 1 - Identification of Relevant Samples Size from Population Database


Step 2 - Approaches for Defining Global Market Size (Value, Volume* & Price*)

Note*: In applicable scenarios
Step 3 - Data Sources
Primary Research
- Web Analytics
- Survey Reports
- Research Institute
- Latest Research Reports
- Opinion Leaders
Secondary Research
- Annual Reports
- White Paper
- Latest Press Release
- Industry Association
- Paid Database
- Investor Presentations

Step 4 - Data Triangulation
Involves using different sources of information in order to increase the validity of a study
These sources are likely to be stakeholders in a program - participants, other researchers, program staff, other community members, and so on.
Then we put all data in single framework & apply various statistical tools to find out the dynamic on the market.
During the analysis stage, feedback from the stakeholder groups would be compared to determine areas of agreement as well as areas of divergence