

Key Insights
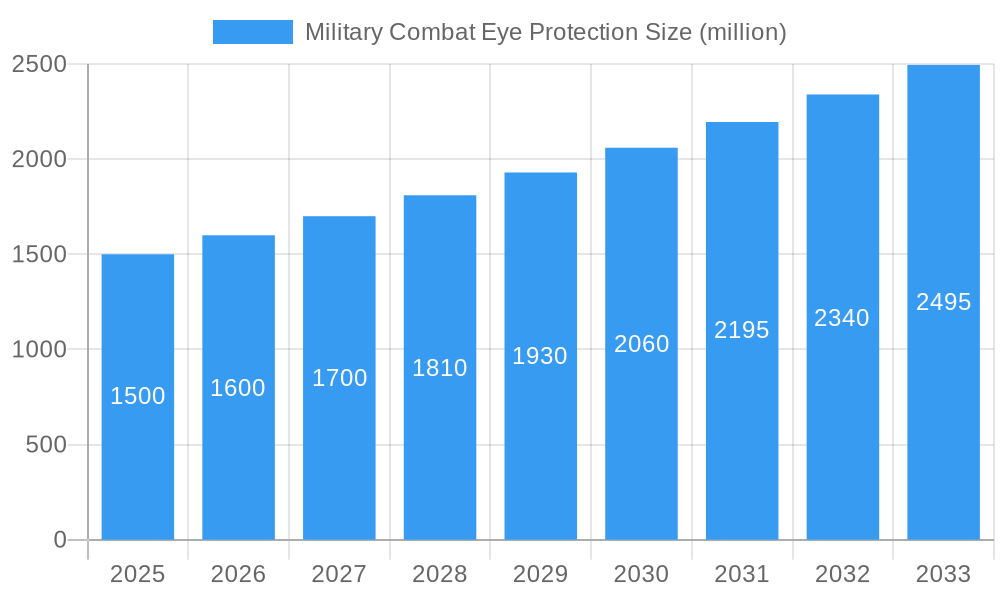
The global Military Combat Eye Protection market is poised for significant expansion, projected to reach a substantial market size of approximately $1.5 billion by 2025, and is expected to grow at a robust Compound Annual Growth Rate (CAGR) of around 6.5% from 2025 to 2033. This growth is primarily fueled by escalating global defense spending, the increasing frequency of asymmetric warfare and counter-terrorism operations, and the continuous need to equip military personnel with advanced protective gear. The integration of advanced materials and innovative designs, such as enhanced ballistic resistance and integrated communication systems, is a key driver, ensuring personnel safety in increasingly complex combat environments. Furthermore, stringent government regulations and procurement mandates for high-performance protective equipment are bolstering market demand.
Military Combat Eye Protection Market Size (In Billion)
The market is segmented by application into Army, Air Force, and Other defense branches, with the Army segment likely holding the largest share due to its extensive personnel deployment and operational scope. In terms of types, Laser Protection Eyewear and Ballistic Protection Eyewear are the dominant categories, reflecting the dual threats of directed energy weapons and ballistic impacts faced by modern soldiers. Key market players like 3M, Revision Military, and Oakley are at the forefront of innovation, investing heavily in research and development to create lighter, more durable, and technologically advanced eye protection solutions. The Asia Pacific region, particularly China and India, is emerging as a significant growth area due to rapid modernization of their defense forces and increasing regional security concerns.
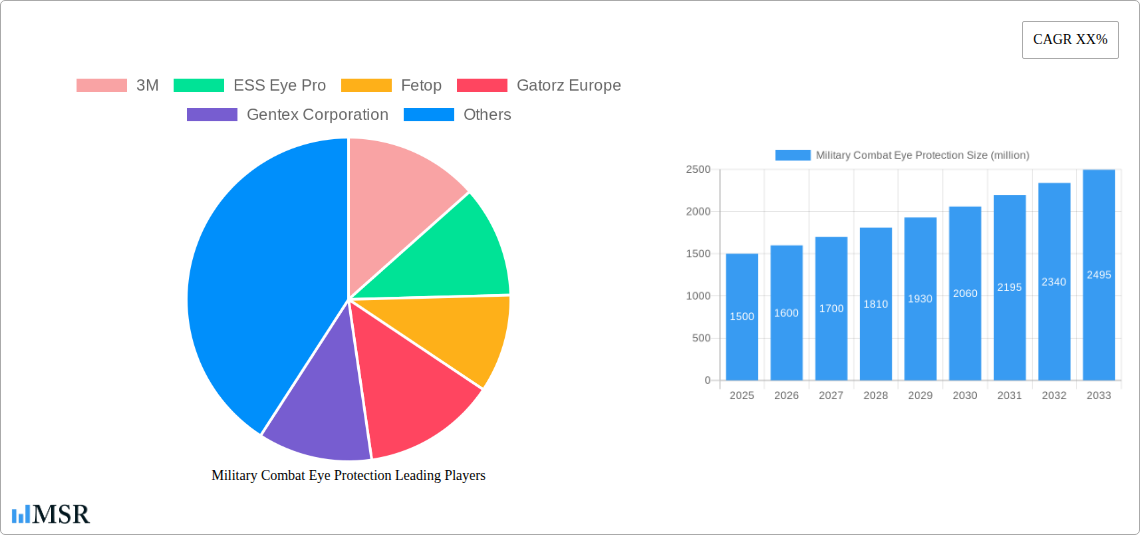
Military Combat Eye Protection Company Market Share
Military Combat Eye Protection Market Analysis: A Comprehensive Report (2019-2033)
This in-depth report provides a critical analysis of the global military combat eye protection market, detailing its dynamics, trends, and future outlook from 2019 to 2033. With a base year of 2025, the study offers unparalleled insights into market concentration, industry innovations, key growth drivers, prevailing challenges, and emerging opportunities. Stakeholders can leverage this report to understand the competitive landscape, technological advancements in ballistic protection eyewear and laser protection eyewear, and strategic imperatives for success in this vital sector.
Military Combat Eye Protection Market Concentration & Dynamics
The military combat eye protection market exhibits moderate concentration, with key players like Revision Military, ESS Eye Pro, and Wiley X holding significant market share, estimated to be over 30% collectively in 2025. Innovation ecosystems are driven by stringent military specifications and the constant threat landscape. Regulatory frameworks, primarily dictated by defense procurement agencies, play a pivotal role in product development and market entry. While direct substitute products are limited in their ability to replicate the specialized protection offered, advancements in civilian safety eyewear present a tangential competitive pressure. End-user trends are heavily influenced by the evolving nature of warfare, demanding lighter, more durable, and multi-functional eye protection solutions. Merger and acquisition (M&A) activities, though not overtly dominant, are strategic, with an estimated 5-10 significant deals projected within the forecast period, aiming to consolidate technological expertise or expand market reach.
Military Combat Eye Protection Industry Insights & Trends
The global military combat eye protection market is projected to witness robust growth, reaching an estimated market size of over $2,500 million by 2033, driven by a compound annual growth rate (CAGR) of approximately 6.5% during the forecast period. Key growth drivers include the ongoing modernization of armed forces globally, the persistent need for advanced protection against ballistic threats and laser-based weaponry, and increasing defense budgets in key regions. Technological disruptions are primarily focused on material science innovations, leading to lighter yet stronger lenses and frames, improved anti-fog and anti-scratch coatings, and the integration of smart technologies for enhanced situational awareness. Evolving consumer behaviors within the military sector emphasize modularity, interoperability with other combat gear, and ergonomic designs that reduce user fatigue during prolonged operations. The rising geopolitical tensions and the demand for superior laser protection eyewear and high-impact ballistic protection eyewear are expected to further fuel market expansion.
Key Markets & Segments Leading Military Combat Eye Protection
The Army segment is anticipated to remain the dominant force in the military combat eye protection market, accounting for over 50% of the market share in 2025. This dominance is driven by the sheer size of ground forces globally and their continuous operational deployment in diverse and challenging environments. Within applications, ballistic protection eyewear commands the largest share, estimated at 70% of the market, due to its fundamental role in safeguarding against fragmentation and projectile impacts.
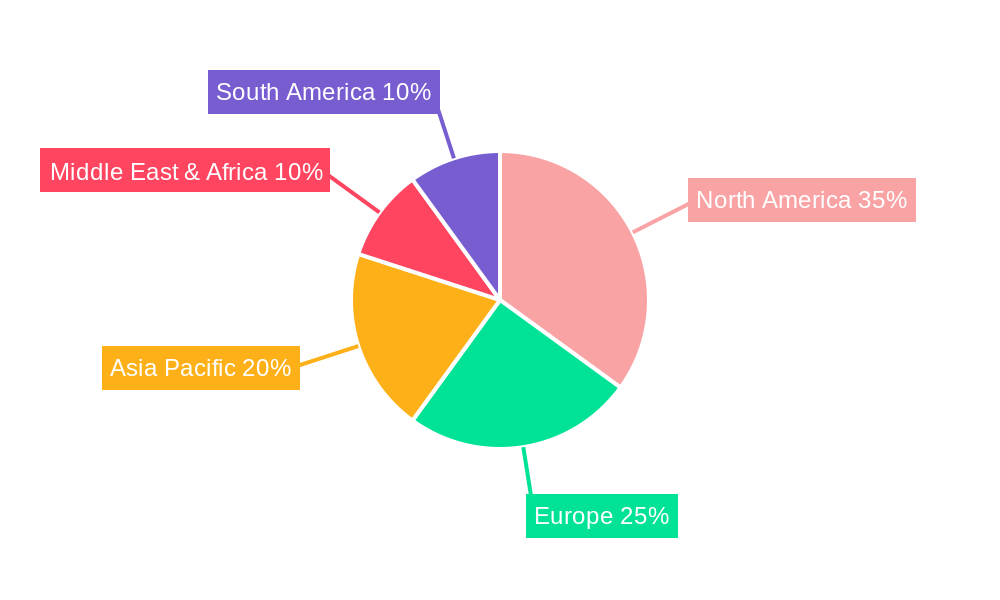
- Dominant Region: North America is projected to lead the market, driven by substantial defense spending and a strong emphasis on equipping military personnel with cutting-edge safety equipment.
- Dominant Country: The United States, with its extensive military operations and consistent investment in advanced defense technologies, will continue to be the largest national market.
- Dominant Application Segment: The Army segment leads due to the extensive operational requirements and large troop numbers.
- Dominant Type Segment: Ballistic Protection Eyewear is paramount, offering essential defense against immediate physical threats on the battlefield.
- Dominant Sub-Segment within Application: Ground troops require the most robust and versatile eye protection solutions.
- Dominant Sub-Segment within Type: Impact-resistant lenses and frames are crucial for surviving combat scenarios.
Military Combat Eye Protection Product Developments
Recent product developments in military combat eye protection are characterized by advancements in high-impact polymer lenses offering superior clarity and ballistic resistance, alongside innovative frame designs for enhanced comfort and integration with helmets and communication systems. Companies are focusing on integrated solutions, including prescription lens inserts and advanced anti-fog coatings that perform exceptionally in extreme conditions. The market is also seeing a rise in specialized laser protection eyewear with customizable tinting and wider spectral filtering capabilities, directly addressing the growing threat of directed energy weapons.
Challenges in the Military Combat Eye Protection Market
The military combat eye protection market faces several challenges that could impede growth. Strict and evolving military standards for ballistic impact, optical clarity, and environmental resistance can increase research and development costs and extend product certification timelines. Supply chain disruptions, particularly for specialized materials and components, can affect production volumes and lead times, with potential impacts on order fulfillment estimated at 15-20% delays during critical periods. Intense competition among established players and new entrants also exerts pricing pressure, potentially impacting profit margins.
Forces Driving Military Combat Eye Protection Growth
Several forces are propelling the growth of the military combat eye protection market. Technological advancements in materials science, such as the development of lighter yet stronger polymers and advanced coatings, are creating more effective and comfortable eyewear. Increased global defense spending, fueled by geopolitical instability and the modernization of armed forces, directly translates to higher demand for essential protective gear. Furthermore, a growing awareness of the long-term health impacts of unprotected eye exposure to lasers and ballistic debris is reinforcing the need for advanced military combat eye protection.
Challenges in the Military Combat Eye Protection Market
Long-term growth catalysts for the military combat eye protection market are rooted in sustained innovation and strategic market expansion. Continued investment in research and development for next-generation materials and designs, particularly those addressing emerging threats like directed energy weapons and advanced fragmentation, will be crucial. Strategic partnerships and collaborations between eyewear manufacturers and defense contractors can streamline product integration and procurement processes. Exploring and adapting to the specific eye protection needs of evolving military doctrines and non-traditional warfare scenarios also presents significant long-term growth opportunities.
Emerging Opportunities in Military Combat Eye Protection
Emerging opportunities in the military combat eye protection market lie in the integration of smart technologies, such as heads-up displays (HUDs) and augmented reality (AR) capabilities, into combat eyewear, enhancing situational awareness and data dissemination. The development of more advanced and versatile laser protection eyewear solutions for a broader spectrum of laser threats represents a significant growth avenue. Furthermore, the expanding defense needs of emerging economies and the increasing focus on equipping specialized units with tailored eye protection offer new market frontiers.
Leading Players in the Military Combat Eye Protection Sector
- 3M
- ESS Eye Pro
- Fetop
- Gatorz Europe
- Gentex Corporation
- Honeywell Safety
- Oakley
- PerriQuest
- Revision Military
- Shalon Chemical Industries
- Wiley X
Key Milestones in Military Combat Eye Protection Industry
- 2019: Introduction of advanced multi-layer ballistic lens technology by leading manufacturers, significantly improving impact resistance.
- 2020: Increased demand for adaptable eyewear with interchangeable lenses to suit diverse operational environments.
- 2021: Greater emphasis on lightweight and ergonomic designs to reduce soldier fatigue during extended missions.
- 2022: Development of enhanced anti-fog and anti-scratch coatings offering superior performance in extreme conditions.
- 2023: Growing interest in integrated solutions, including prescription lens compatibility and modular mounting systems for accessories.
- 2024: Advancements in laser protection eyewear with broader spectral filtering and improved optical clarity.
Strategic Outlook for Military Combat Eye Protection Market
The strategic outlook for the military combat eye protection market is exceptionally positive, driven by continuous defense modernization efforts and the persistent evolution of battlefield threats. Growth will be accelerated by innovations in smart eyewear integration, offering soldiers enhanced data visualization and situational awareness. Furthermore, the increasing demand for highly specialized ballistic protection eyewear and laser protection eyewear tailored to specific mission profiles presents significant expansion opportunities. Strategic focus on research and development, coupled with strong relationships with defense procurement agencies, will be key to capitalizing on the projected market growth exceeding $2,500 million by 2033.
Military Combat Eye Protection Segmentation
-
1. Application
- 1.1. Army
- 1.2. Air Force
- 1.3. Other
-
2. Types
- 2.1. Laser Protection Eyewear
- 2.2. Ballistic Protection Eyewear
- 2.3. Others
Military Combat Eye Protection Segmentation By Geography
-
1. North America
- 1.1. United States
- 1.2. Canada
- 1.3. Mexico
-
2. South America
- 2.1. Brazil
- 2.2. Argentina
- 2.3. Rest of South America
-
3. Europe
- 3.1. United Kingdom
- 3.2. Germany
- 3.3. France
- 3.4. Italy
- 3.5. Spain
- 3.6. Russia
- 3.7. Benelux
- 3.8. Nordics
- 3.9. Rest of Europe
-
4. Middle East & Africa
- 4.1. Turkey
- 4.2. Israel
- 4.3. GCC
- 4.4. North Africa
- 4.5. South Africa
- 4.6. Rest of Middle East & Africa
-
5. Asia Pacific
- 5.1. China
- 5.2. India
- 5.3. Japan
- 5.4. South Korea
- 5.5. ASEAN
- 5.6. Oceania
- 5.7. Rest of Asia Pacific
Military Combat Eye Protection Regional Market Share
Geographic Coverage of Military Combat Eye Protection
Military Combat Eye Protection REPORT HIGHLIGHTS
| Aspects | Details |
|---|---|
| Study Period | 2020-2034 |
| Base Year | 2025 |
| Estimated Year | 2026 |
| Forecast Period | 2026-2034 |
| Historical Period | 2020-2025 |
| Growth Rate | CAGR of XX% from 2020-2034 |
| Segmentation |
|
Table of Contents
- 1. Introduction
- 1.1. Research Scope
- 1.2. Market Segmentation
- 1.3. Research Objective
- 1.4. Definitions and Assumptions
- 2. Executive Summary
- 2.1. Market Snapshot
- 3. Market Dynamics
- 3.1. Market Drivers
- 3.2. Market Restrains
- 3.3. Market Trends
- 3.4. Market Opportunities
- 4. Market Factor Analysis
- 4.1. Porters Five Forces
- 4.1.1. Bargaining Power of Suppliers
- 4.1.2. Bargaining Power of Buyers
- 4.1.3. Threat of New Entrants
- 4.1.4. Threat of Substitutes
- 4.1.5. Competitive Rivalry
- 4.2. PESTEL analysis
- 4.3. BCG Analysis
- 4.3.1. Stars (High Growth, High Market Share)
- 4.3.2. Cash Cows (Low Growth, High Market Share)
- 4.3.3. Question Mark (High Growth, Low Market Share)
- 4.3.4. Dogs (Low Growth, Low Market Share)
- 4.4. Ansoff Matrix Analysis
- 4.5. Supply Chain Analysis
- 4.6. Regulatory Landscape
- 4.7. Current Market Potential and Opportunity Assessment (TAM–SAM–SOM Framework)
- 4.8. MSR Analyst Note
- 4.1. Porters Five Forces
- 5. Market Analysis, Insights and Forecast 2021-2033
- 5.1. Market Analysis, Insights and Forecast - by Application
- 5.1.1. Army
- 5.1.2. Air Force
- 5.1.3. Other
- 5.2. Market Analysis, Insights and Forecast - by Types
- 5.2.1. Laser Protection Eyewear
- 5.2.2. Ballistic Protection Eyewear
- 5.2.3. Others
- 5.3. Market Analysis, Insights and Forecast - by Region
- 5.3.1. North America
- 5.3.2. South America
- 5.3.3. Europe
- 5.3.4. Middle East & Africa
- 5.3.5. Asia Pacific
- 5.1. Market Analysis, Insights and Forecast - by Application
- 6. Global Military Combat Eye Protection Analysis, Insights and Forecast, 2021-2033
- 6.1. Market Analysis, Insights and Forecast - by Application
- 6.1.1. Army
- 6.1.2. Air Force
- 6.1.3. Other
- 6.2. Market Analysis, Insights and Forecast - by Types
- 6.2.1. Laser Protection Eyewear
- 6.2.2. Ballistic Protection Eyewear
- 6.2.3. Others
- 6.1. Market Analysis, Insights and Forecast - by Application
- 7. North America Military Combat Eye Protection Analysis, Insights and Forecast, 2020-2032
- 7.1. Market Analysis, Insights and Forecast - by Application
- 7.1.1. Army
- 7.1.2. Air Force
- 7.1.3. Other
- 7.2. Market Analysis, Insights and Forecast - by Types
- 7.2.1. Laser Protection Eyewear
- 7.2.2. Ballistic Protection Eyewear
- 7.2.3. Others
- 7.1. Market Analysis, Insights and Forecast - by Application
- 8. South America Military Combat Eye Protection Analysis, Insights and Forecast, 2020-2032
- 8.1. Market Analysis, Insights and Forecast - by Application
- 8.1.1. Army
- 8.1.2. Air Force
- 8.1.3. Other
- 8.2. Market Analysis, Insights and Forecast - by Types
- 8.2.1. Laser Protection Eyewear
- 8.2.2. Ballistic Protection Eyewear
- 8.2.3. Others
- 8.1. Market Analysis, Insights and Forecast - by Application
- 9. Europe Military Combat Eye Protection Analysis, Insights and Forecast, 2020-2032
- 9.1. Market Analysis, Insights and Forecast - by Application
- 9.1.1. Army
- 9.1.2. Air Force
- 9.1.3. Other
- 9.2. Market Analysis, Insights and Forecast - by Types
- 9.2.1. Laser Protection Eyewear
- 9.2.2. Ballistic Protection Eyewear
- 9.2.3. Others
- 9.1. Market Analysis, Insights and Forecast - by Application
- 10. Middle East & Africa Military Combat Eye Protection Analysis, Insights and Forecast, 2020-2032
- 10.1. Market Analysis, Insights and Forecast - by Application
- 10.1.1. Army
- 10.1.2. Air Force
- 10.1.3. Other
- 10.2. Market Analysis, Insights and Forecast - by Types
- 10.2.1. Laser Protection Eyewear
- 10.2.2. Ballistic Protection Eyewear
- 10.2.3. Others
- 10.1. Market Analysis, Insights and Forecast - by Application
- 11. Asia Pacific Military Combat Eye Protection Analysis, Insights and Forecast, 2020-2032
- 11.1. Market Analysis, Insights and Forecast - by Application
- 11.1.1. Army
- 11.1.2. Air Force
- 11.1.3. Other
- 11.2. Market Analysis, Insights and Forecast - by Types
- 11.2.1. Laser Protection Eyewear
- 11.2.2. Ballistic Protection Eyewear
- 11.2.3. Others
- 11.1. Market Analysis, Insights and Forecast - by Application
- 12. Competitive Analysis
- 12.1. Company Profiles
- 12.1.1 3M
- 12.1.1.1. Company Overview
- 12.1.1.2. Products
- 12.1.1.3. Company Financials
- 12.1.1.4. SWOT Analysis
- 12.1.2 ESS Eye Pro
- 12.1.2.1. Company Overview
- 12.1.2.2. Products
- 12.1.2.3. Company Financials
- 12.1.2.4. SWOT Analysis
- 12.1.3 Fetop
- 12.1.3.1. Company Overview
- 12.1.3.2. Products
- 12.1.3.3. Company Financials
- 12.1.3.4. SWOT Analysis
- 12.1.4 Gatorz Europe
- 12.1.4.1. Company Overview
- 12.1.4.2. Products
- 12.1.4.3. Company Financials
- 12.1.4.4. SWOT Analysis
- 12.1.5 Gentex Corporation
- 12.1.5.1. Company Overview
- 12.1.5.2. Products
- 12.1.5.3. Company Financials
- 12.1.5.4. SWOT Analysis
- 12.1.6 Honeywell Safety
- 12.1.6.1. Company Overview
- 12.1.6.2. Products
- 12.1.6.3. Company Financials
- 12.1.6.4. SWOT Analysis
- 12.1.7 Oakley
- 12.1.7.1. Company Overview
- 12.1.7.2. Products
- 12.1.7.3. Company Financials
- 12.1.7.4. SWOT Analysis
- 12.1.8 PerriQuest
- 12.1.8.1. Company Overview
- 12.1.8.2. Products
- 12.1.8.3. Company Financials
- 12.1.8.4. SWOT Analysis
- 12.1.9 Revision Military
- 12.1.9.1. Company Overview
- 12.1.9.2. Products
- 12.1.9.3. Company Financials
- 12.1.9.4. SWOT Analysis
- 12.1.10 Shalon Chemical Industries
- 12.1.10.1. Company Overview
- 12.1.10.2. Products
- 12.1.10.3. Company Financials
- 12.1.10.4. SWOT Analysis
- 12.1.11 Wiley X
- 12.1.11.1. Company Overview
- 12.1.11.2. Products
- 12.1.11.3. Company Financials
- 12.1.11.4. SWOT Analysis
- 12.1.1 3M
- 12.2. Market Entropy
- 12.2.1 Company's Key Areas Served
- 12.2.2 Recent Developments
- 12.3. Company Market Share Analysis 2025
- 12.3.1 Top 5 Companies Market Share Analysis
- 12.3.2 Top 3 Companies Market Share Analysis
- 12.4. List of Potential Customers
- 13. Research Methodology
List of Figures
- Figure 1: Global Military Combat Eye Protection Revenue Breakdown (million, %) by Region 2025 & 2033
- Figure 2: Global Military Combat Eye Protection Volume Breakdown (K, %) by Region 2025 & 2033
- Figure 3: North America Military Combat Eye Protection Revenue (million), by Application 2025 & 2033
- Figure 4: North America Military Combat Eye Protection Volume (K), by Application 2025 & 2033
- Figure 5: North America Military Combat Eye Protection Revenue Share (%), by Application 2025 & 2033
- Figure 6: North America Military Combat Eye Protection Volume Share (%), by Application 2025 & 2033
- Figure 7: North America Military Combat Eye Protection Revenue (million), by Types 2025 & 2033
- Figure 8: North America Military Combat Eye Protection Volume (K), by Types 2025 & 2033
- Figure 9: North America Military Combat Eye Protection Revenue Share (%), by Types 2025 & 2033
- Figure 10: North America Military Combat Eye Protection Volume Share (%), by Types 2025 & 2033
- Figure 11: North America Military Combat Eye Protection Revenue (million), by Country 2025 & 2033
- Figure 12: North America Military Combat Eye Protection Volume (K), by Country 2025 & 2033
- Figure 13: North America Military Combat Eye Protection Revenue Share (%), by Country 2025 & 2033
- Figure 14: North America Military Combat Eye Protection Volume Share (%), by Country 2025 & 2033
- Figure 15: South America Military Combat Eye Protection Revenue (million), by Application 2025 & 2033
- Figure 16: South America Military Combat Eye Protection Volume (K), by Application 2025 & 2033
- Figure 17: South America Military Combat Eye Protection Revenue Share (%), by Application 2025 & 2033
- Figure 18: South America Military Combat Eye Protection Volume Share (%), by Application 2025 & 2033
- Figure 19: South America Military Combat Eye Protection Revenue (million), by Types 2025 & 2033
- Figure 20: South America Military Combat Eye Protection Volume (K), by Types 2025 & 2033
- Figure 21: South America Military Combat Eye Protection Revenue Share (%), by Types 2025 & 2033
- Figure 22: South America Military Combat Eye Protection Volume Share (%), by Types 2025 & 2033
- Figure 23: South America Military Combat Eye Protection Revenue (million), by Country 2025 & 2033
- Figure 24: South America Military Combat Eye Protection Volume (K), by Country 2025 & 2033
- Figure 25: South America Military Combat Eye Protection Revenue Share (%), by Country 2025 & 2033
- Figure 26: South America Military Combat Eye Protection Volume Share (%), by Country 2025 & 2033
- Figure 27: Europe Military Combat Eye Protection Revenue (million), by Application 2025 & 2033
- Figure 28: Europe Military Combat Eye Protection Volume (K), by Application 2025 & 2033
- Figure 29: Europe Military Combat Eye Protection Revenue Share (%), by Application 2025 & 2033
- Figure 30: Europe Military Combat Eye Protection Volume Share (%), by Application 2025 & 2033
- Figure 31: Europe Military Combat Eye Protection Revenue (million), by Types 2025 & 2033
- Figure 32: Europe Military Combat Eye Protection Volume (K), by Types 2025 & 2033
- Figure 33: Europe Military Combat Eye Protection Revenue Share (%), by Types 2025 & 2033
- Figure 34: Europe Military Combat Eye Protection Volume Share (%), by Types 2025 & 2033
- Figure 35: Europe Military Combat Eye Protection Revenue (million), by Country 2025 & 2033
- Figure 36: Europe Military Combat Eye Protection Volume (K), by Country 2025 & 2033
- Figure 37: Europe Military Combat Eye Protection Revenue Share (%), by Country 2025 & 2033
- Figure 38: Europe Military Combat Eye Protection Volume Share (%), by Country 2025 & 2033
- Figure 39: Middle East & Africa Military Combat Eye Protection Revenue (million), by Application 2025 & 2033
- Figure 40: Middle East & Africa Military Combat Eye Protection Volume (K), by Application 2025 & 2033
- Figure 41: Middle East & Africa Military Combat Eye Protection Revenue Share (%), by Application 2025 & 2033
- Figure 42: Middle East & Africa Military Combat Eye Protection Volume Share (%), by Application 2025 & 2033
- Figure 43: Middle East & Africa Military Combat Eye Protection Revenue (million), by Types 2025 & 2033
- Figure 44: Middle East & Africa Military Combat Eye Protection Volume (K), by Types 2025 & 2033
- Figure 45: Middle East & Africa Military Combat Eye Protection Revenue Share (%), by Types 2025 & 2033
- Figure 46: Middle East & Africa Military Combat Eye Protection Volume Share (%), by Types 2025 & 2033
- Figure 47: Middle East & Africa Military Combat Eye Protection Revenue (million), by Country 2025 & 2033
- Figure 48: Middle East & Africa Military Combat Eye Protection Volume (K), by Country 2025 & 2033
- Figure 49: Middle East & Africa Military Combat Eye Protection Revenue Share (%), by Country 2025 & 2033
- Figure 50: Middle East & Africa Military Combat Eye Protection Volume Share (%), by Country 2025 & 2033
- Figure 51: Asia Pacific Military Combat Eye Protection Revenue (million), by Application 2025 & 2033
- Figure 52: Asia Pacific Military Combat Eye Protection Volume (K), by Application 2025 & 2033
- Figure 53: Asia Pacific Military Combat Eye Protection Revenue Share (%), by Application 2025 & 2033
- Figure 54: Asia Pacific Military Combat Eye Protection Volume Share (%), by Application 2025 & 2033
- Figure 55: Asia Pacific Military Combat Eye Protection Revenue (million), by Types 2025 & 2033
- Figure 56: Asia Pacific Military Combat Eye Protection Volume (K), by Types 2025 & 2033
- Figure 57: Asia Pacific Military Combat Eye Protection Revenue Share (%), by Types 2025 & 2033
- Figure 58: Asia Pacific Military Combat Eye Protection Volume Share (%), by Types 2025 & 2033
- Figure 59: Asia Pacific Military Combat Eye Protection Revenue (million), by Country 2025 & 2033
- Figure 60: Asia Pacific Military Combat Eye Protection Volume (K), by Country 2025 & 2033
- Figure 61: Asia Pacific Military Combat Eye Protection Revenue Share (%), by Country 2025 & 2033
- Figure 62: Asia Pacific Military Combat Eye Protection Volume Share (%), by Country 2025 & 2033
List of Tables
- Table 1: Global Military Combat Eye Protection Revenue million Forecast, by Application 2020 & 2033
- Table 2: Global Military Combat Eye Protection Volume K Forecast, by Application 2020 & 2033
- Table 3: Global Military Combat Eye Protection Revenue million Forecast, by Types 2020 & 2033
- Table 4: Global Military Combat Eye Protection Volume K Forecast, by Types 2020 & 2033
- Table 5: Global Military Combat Eye Protection Revenue million Forecast, by Region 2020 & 2033
- Table 6: Global Military Combat Eye Protection Volume K Forecast, by Region 2020 & 2033
- Table 7: Global Military Combat Eye Protection Revenue million Forecast, by Application 2020 & 2033
- Table 8: Global Military Combat Eye Protection Volume K Forecast, by Application 2020 & 2033
- Table 9: Global Military Combat Eye Protection Revenue million Forecast, by Types 2020 & 2033
- Table 10: Global Military Combat Eye Protection Volume K Forecast, by Types 2020 & 2033
- Table 11: Global Military Combat Eye Protection Revenue million Forecast, by Country 2020 & 2033
- Table 12: Global Military Combat Eye Protection Volume K Forecast, by Country 2020 & 2033
- Table 13: United States Military Combat Eye Protection Revenue (million) Forecast, by Application 2020 & 2033
- Table 14: United States Military Combat Eye Protection Volume (K) Forecast, by Application 2020 & 2033
- Table 15: Canada Military Combat Eye Protection Revenue (million) Forecast, by Application 2020 & 2033
- Table 16: Canada Military Combat Eye Protection Volume (K) Forecast, by Application 2020 & 2033
- Table 17: Mexico Military Combat Eye Protection Revenue (million) Forecast, by Application 2020 & 2033
- Table 18: Mexico Military Combat Eye Protection Volume (K) Forecast, by Application 2020 & 2033
- Table 19: Global Military Combat Eye Protection Revenue million Forecast, by Application 2020 & 2033
- Table 20: Global Military Combat Eye Protection Volume K Forecast, by Application 2020 & 2033
- Table 21: Global Military Combat Eye Protection Revenue million Forecast, by Types 2020 & 2033
- Table 22: Global Military Combat Eye Protection Volume K Forecast, by Types 2020 & 2033
- Table 23: Global Military Combat Eye Protection Revenue million Forecast, by Country 2020 & 2033
- Table 24: Global Military Combat Eye Protection Volume K Forecast, by Country 2020 & 2033
- Table 25: Brazil Military Combat Eye Protection Revenue (million) Forecast, by Application 2020 & 2033
- Table 26: Brazil Military Combat Eye Protection Volume (K) Forecast, by Application 2020 & 2033
- Table 27: Argentina Military Combat Eye Protection Revenue (million) Forecast, by Application 2020 & 2033
- Table 28: Argentina Military Combat Eye Protection Volume (K) Forecast, by Application 2020 & 2033
- Table 29: Rest of South America Military Combat Eye Protection Revenue (million) Forecast, by Application 2020 & 2033
- Table 30: Rest of South America Military Combat Eye Protection Volume (K) Forecast, by Application 2020 & 2033
- Table 31: Global Military Combat Eye Protection Revenue million Forecast, by Application 2020 & 2033
- Table 32: Global Military Combat Eye Protection Volume K Forecast, by Application 2020 & 2033
- Table 33: Global Military Combat Eye Protection Revenue million Forecast, by Types 2020 & 2033
- Table 34: Global Military Combat Eye Protection Volume K Forecast, by Types 2020 & 2033
- Table 35: Global Military Combat Eye Protection Revenue million Forecast, by Country 2020 & 2033
- Table 36: Global Military Combat Eye Protection Volume K Forecast, by Country 2020 & 2033
- Table 37: United Kingdom Military Combat Eye Protection Revenue (million) Forecast, by Application 2020 & 2033
- Table 38: United Kingdom Military Combat Eye Protection Volume (K) Forecast, by Application 2020 & 2033
- Table 39: Germany Military Combat Eye Protection Revenue (million) Forecast, by Application 2020 & 2033
- Table 40: Germany Military Combat Eye Protection Volume (K) Forecast, by Application 2020 & 2033
- Table 41: France Military Combat Eye Protection Revenue (million) Forecast, by Application 2020 & 2033
- Table 42: France Military Combat Eye Protection Volume (K) Forecast, by Application 2020 & 2033
- Table 43: Italy Military Combat Eye Protection Revenue (million) Forecast, by Application 2020 & 2033
- Table 44: Italy Military Combat Eye Protection Volume (K) Forecast, by Application 2020 & 2033
- Table 45: Spain Military Combat Eye Protection Revenue (million) Forecast, by Application 2020 & 2033
- Table 46: Spain Military Combat Eye Protection Volume (K) Forecast, by Application 2020 & 2033
- Table 47: Russia Military Combat Eye Protection Revenue (million) Forecast, by Application 2020 & 2033
- Table 48: Russia Military Combat Eye Protection Volume (K) Forecast, by Application 2020 & 2033
- Table 49: Benelux Military Combat Eye Protection Revenue (million) Forecast, by Application 2020 & 2033
- Table 50: Benelux Military Combat Eye Protection Volume (K) Forecast, by Application 2020 & 2033
- Table 51: Nordics Military Combat Eye Protection Revenue (million) Forecast, by Application 2020 & 2033
- Table 52: Nordics Military Combat Eye Protection Volume (K) Forecast, by Application 2020 & 2033
- Table 53: Rest of Europe Military Combat Eye Protection Revenue (million) Forecast, by Application 2020 & 2033
- Table 54: Rest of Europe Military Combat Eye Protection Volume (K) Forecast, by Application 2020 & 2033
- Table 55: Global Military Combat Eye Protection Revenue million Forecast, by Application 2020 & 2033
- Table 56: Global Military Combat Eye Protection Volume K Forecast, by Application 2020 & 2033
- Table 57: Global Military Combat Eye Protection Revenue million Forecast, by Types 2020 & 2033
- Table 58: Global Military Combat Eye Protection Volume K Forecast, by Types 2020 & 2033
- Table 59: Global Military Combat Eye Protection Revenue million Forecast, by Country 2020 & 2033
- Table 60: Global Military Combat Eye Protection Volume K Forecast, by Country 2020 & 2033
- Table 61: Turkey Military Combat Eye Protection Revenue (million) Forecast, by Application 2020 & 2033
- Table 62: Turkey Military Combat Eye Protection Volume (K) Forecast, by Application 2020 & 2033
- Table 63: Israel Military Combat Eye Protection Revenue (million) Forecast, by Application 2020 & 2033
- Table 64: Israel Military Combat Eye Protection Volume (K) Forecast, by Application 2020 & 2033
- Table 65: GCC Military Combat Eye Protection Revenue (million) Forecast, by Application 2020 & 2033
- Table 66: GCC Military Combat Eye Protection Volume (K) Forecast, by Application 2020 & 2033
- Table 67: North Africa Military Combat Eye Protection Revenue (million) Forecast, by Application 2020 & 2033
- Table 68: North Africa Military Combat Eye Protection Volume (K) Forecast, by Application 2020 & 2033
- Table 69: South Africa Military Combat Eye Protection Revenue (million) Forecast, by Application 2020 & 2033
- Table 70: South Africa Military Combat Eye Protection Volume (K) Forecast, by Application 2020 & 2033
- Table 71: Rest of Middle East & Africa Military Combat Eye Protection Revenue (million) Forecast, by Application 2020 & 2033
- Table 72: Rest of Middle East & Africa Military Combat Eye Protection Volume (K) Forecast, by Application 2020 & 2033
- Table 73: Global Military Combat Eye Protection Revenue million Forecast, by Application 2020 & 2033
- Table 74: Global Military Combat Eye Protection Volume K Forecast, by Application 2020 & 2033
- Table 75: Global Military Combat Eye Protection Revenue million Forecast, by Types 2020 & 2033
- Table 76: Global Military Combat Eye Protection Volume K Forecast, by Types 2020 & 2033
- Table 77: Global Military Combat Eye Protection Revenue million Forecast, by Country 2020 & 2033
- Table 78: Global Military Combat Eye Protection Volume K Forecast, by Country 2020 & 2033
- Table 79: China Military Combat Eye Protection Revenue (million) Forecast, by Application 2020 & 2033
- Table 80: China Military Combat Eye Protection Volume (K) Forecast, by Application 2020 & 2033
- Table 81: India Military Combat Eye Protection Revenue (million) Forecast, by Application 2020 & 2033
- Table 82: India Military Combat Eye Protection Volume (K) Forecast, by Application 2020 & 2033
- Table 83: Japan Military Combat Eye Protection Revenue (million) Forecast, by Application 2020 & 2033
- Table 84: Japan Military Combat Eye Protection Volume (K) Forecast, by Application 2020 & 2033
- Table 85: South Korea Military Combat Eye Protection Revenue (million) Forecast, by Application 2020 & 2033
- Table 86: South Korea Military Combat Eye Protection Volume (K) Forecast, by Application 2020 & 2033
- Table 87: ASEAN Military Combat Eye Protection Revenue (million) Forecast, by Application 2020 & 2033
- Table 88: ASEAN Military Combat Eye Protection Volume (K) Forecast, by Application 2020 & 2033
- Table 89: Oceania Military Combat Eye Protection Revenue (million) Forecast, by Application 2020 & 2033
- Table 90: Oceania Military Combat Eye Protection Volume (K) Forecast, by Application 2020 & 2033
- Table 91: Rest of Asia Pacific Military Combat Eye Protection Revenue (million) Forecast, by Application 2020 & 2033
- Table 92: Rest of Asia Pacific Military Combat Eye Protection Volume (K) Forecast, by Application 2020 & 2033
Frequently Asked Questions
1. What is the projected Compound Annual Growth Rate (CAGR) of the Military Combat Eye Protection?
The projected CAGR is approximately XX%.
2. Which companies are prominent players in the Military Combat Eye Protection?
Key companies in the market include 3M, ESS Eye Pro, Fetop, Gatorz Europe, Gentex Corporation, Honeywell Safety, Oakley, PerriQuest, Revision Military, Shalon Chemical Industries, Wiley X.
3. What are the main segments of the Military Combat Eye Protection?
The market segments include Application, Types.
4. Can you provide details about the market size?
The market size is estimated to be USD XXX million as of 2022.
5. What are some drivers contributing to market growth?
N/A
6. What are the notable trends driving market growth?
N/A
7. Are there any restraints impacting market growth?
N/A
8. Can you provide examples of recent developments in the market?
N/A
9. What pricing options are available for accessing the report?
Pricing options include single-user, multi-user, and enterprise licenses priced at USD 3950.00, USD 5925.00, and USD 7900.00 respectively.
10. Is the market size provided in terms of value or volume?
The market size is provided in terms of value, measured in million and volume, measured in K.
11. Are there any specific market keywords associated with the report?
Yes, the market keyword associated with the report is "Military Combat Eye Protection," which aids in identifying and referencing the specific market segment covered.
12. How do I determine which pricing option suits my needs best?
The pricing options vary based on user requirements and access needs. Individual users may opt for single-user licenses, while businesses requiring broader access may choose multi-user or enterprise licenses for cost-effective access to the report.
13. Are there any additional resources or data provided in the Military Combat Eye Protection report?
While the report offers comprehensive insights, it's advisable to review the specific contents or supplementary materials provided to ascertain if additional resources or data are available.
14. How can I stay updated on further developments or reports in the Military Combat Eye Protection?
To stay informed about further developments, trends, and reports in the Military Combat Eye Protection, consider subscribing to industry newsletters, following relevant companies and organizations, or regularly checking reputable industry news sources and publications.
Methodology
Step 1 - Identification of Relevant Samples Size from Population Database


Step 2 - Approaches for Defining Global Market Size (Value, Volume* & Price*)

Note*: In applicable scenarios
Step 3 - Data Sources
Primary Research
- Web Analytics
- Survey Reports
- Research Institute
- Latest Research Reports
- Opinion Leaders
Secondary Research
- Annual Reports
- White Paper
- Latest Press Release
- Industry Association
- Paid Database
- Investor Presentations

Step 4 - Data Triangulation
Involves using different sources of information in order to increase the validity of a study
These sources are likely to be stakeholders in a program - participants, other researchers, program staff, other community members, and so on.
Then we put all data in single framework & apply various statistical tools to find out the dynamic on the market.
During the analysis stage, feedback from the stakeholder groups would be compared to determine areas of agreement as well as areas of divergence