

Key Insights
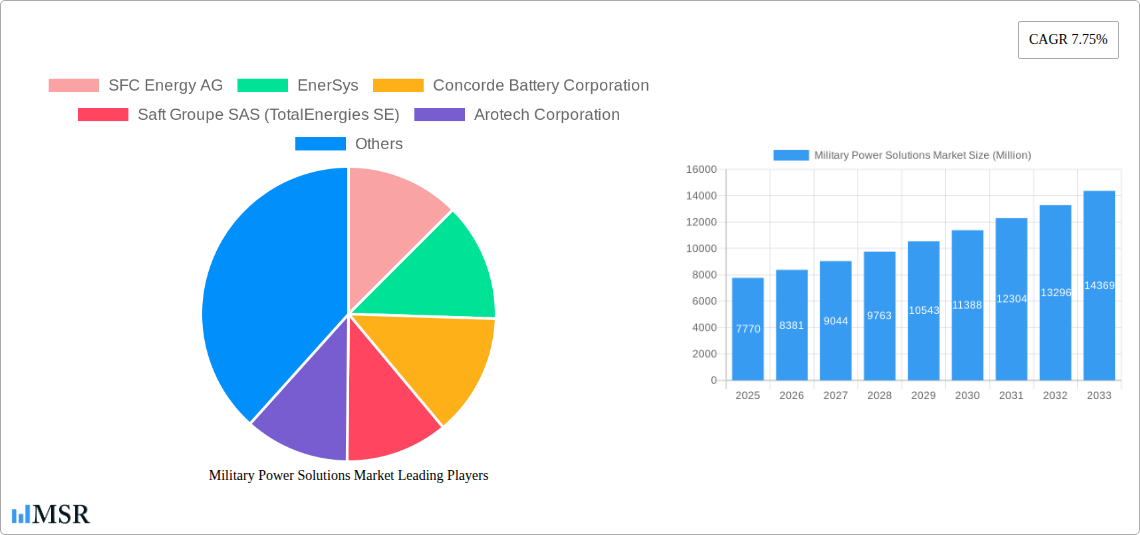
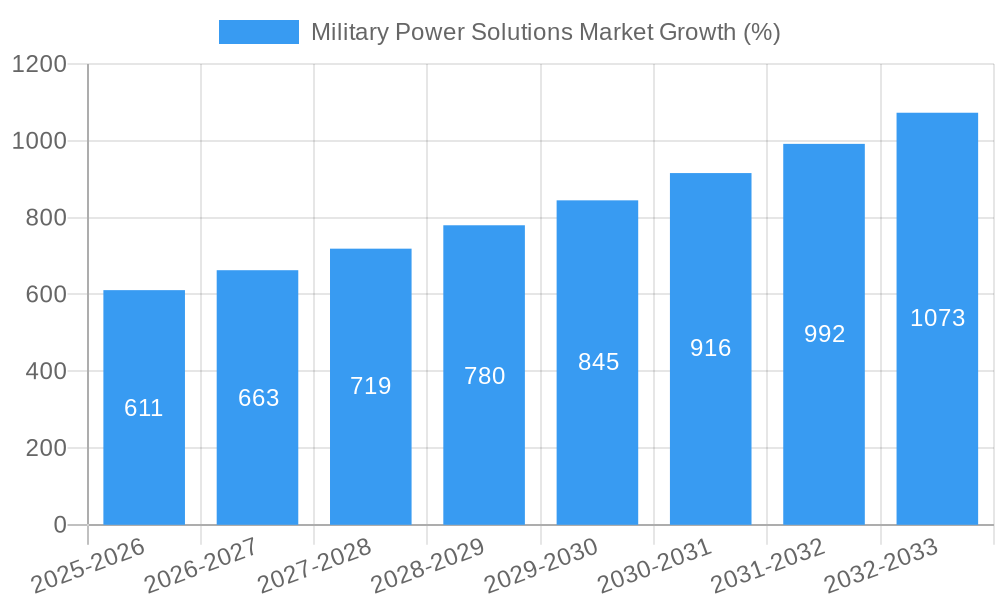
The Military Power Solutions market, valued at $7.77 billion in 2025, is projected to experience robust growth, driven by escalating geopolitical tensions, increasing defense budgets globally, and the rising demand for advanced, reliable power systems in military operations. The market's Compound Annual Growth Rate (CAGR) of 7.75% from 2025 to 2033 indicates a significant expansion over the forecast period. Key drivers include the adoption of electric and hybrid vehicles in military fleets, the need for portable power solutions for remote operations and special forces, and the increasing integration of sophisticated electronic warfare systems requiring reliable and resilient power. Market trends point towards a shift towards lighter, more energy-efficient, and environmentally friendly power solutions, including advancements in battery technology, fuel cell technology, and improved generator efficiency. Furthermore, the growing adoption of unmanned aerial vehicles (UAVs) and other autonomous systems is fueling demand for miniaturized and highly reliable power sources. While potential restraints like fluctuating raw material prices and technological complexities exist, the overall market outlook remains positive, with consistent technological innovations and government investment mitigating these challenges. The segmentation by type (portable, non-portable), source (batteries, generators, other sources), and platform (air, land, sea) provides a comprehensive view of the market’s diverse applications and growth opportunities.
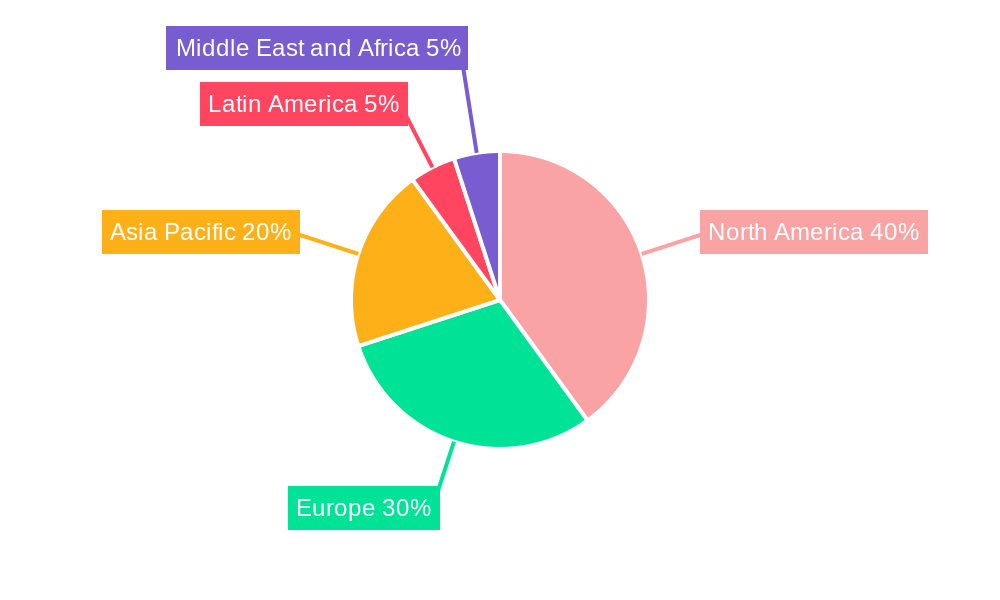
The North American market, encompassing the United States and Canada, holds a significant share, benefiting from substantial defense spending and technological advancements. Europe, driven by the increasing military modernization efforts in several countries, also contributes substantially to the market growth. The Asia-Pacific region is experiencing rapid expansion driven by the rising defense budgets of nations like China and India. The continued focus on enhancing military capabilities worldwide, coupled with continuous technological breakthroughs in energy storage and power generation, positions the Military Power Solutions market for continued substantial growth in the coming years. Key players such as SFC Energy AG, EnerSys, and Saft Groupe SAS are actively engaged in developing and delivering innovative power solutions to meet the evolving demands of the military sector. The market's future growth will be shaped by technological progress, geopolitical events, and strategic investments in defense modernization.
Military Power Solutions Market: A Comprehensive Market Analysis (2019-2033)
This in-depth report provides a comprehensive analysis of the Military Power Solutions Market, offering invaluable insights for industry stakeholders, investors, and strategic decision-makers. The study period covers 2019-2033, with a base year of 2025 and a forecast period of 2025-2033. The report meticulously analyzes market dynamics, key segments, leading players, and emerging opportunities, providing a detailed understanding of this crucial sector. The market is valued at xx Million in 2025 and is projected to reach xx Million by 2033, exhibiting a CAGR of xx% during the forecast period.
Military Power Solutions Market Market Concentration & Dynamics
The Military Power Solutions market exhibits a moderately concentrated landscape, with several major players holding significant market share. The market concentration ratio (CR4) is estimated at xx%, indicating the influence of a few dominant players. However, the presence of several smaller, specialized firms fosters innovation and competition. The innovation ecosystem is robust, driven by continuous advancements in battery technology, generator efficiency, and power management systems. Regulatory frameworks vary across nations, impacting product approvals and deployment. Substitute products, such as alternative energy sources, pose a gradual challenge. End-user trends lean towards lightweight, high-capacity, and reliable power solutions. M&A activities are relatively frequent, as observed in recent years, with xx M&A deals recorded between 2019 and 2024. This activity demonstrates the consolidation and strategic expansion within the sector.
- Market Share: Top 5 players account for approximately xx% of the market.
- M&A Deal Counts: xx deals recorded between 2019 and 2024.
- Innovation Drivers: Advancements in battery chemistry, fuel cell technology, and power electronics.
- Regulatory Impact: Compliance with military specifications and environmental regulations.
Military Power Solutions Market Industry Insights & Trends
The Military Power Solutions market is experiencing robust growth, driven by increasing defense budgets globally, modernization of military equipment, and the demand for enhanced operational capabilities. The market size was valued at xx Million in 2024 and is projected to reach xx Million by 2033, demonstrating significant growth potential. Technological disruptions, such as the adoption of hybrid and electric power systems, are reshaping the market landscape. Consumer behavior within the military sector is shifting toward lighter, more efficient, and sustainable power solutions with enhanced durability and reliability in diverse and challenging environments. The rising adoption of unmanned aerial vehicles (UAVs) and autonomous systems is also driving demand for compact and efficient power solutions.
Key Markets & Segments Leading Military Power Solutions Market
The North American region currently dominates the Military Power Solutions market, owing to substantial defense spending and a strong presence of key industry players. However, the Asia-Pacific region is projected to witness significant growth in the forecast period, fueled by increasing military expenditure and modernization initiatives.
By Type:
- Portable: High demand due to increasing use in mobile applications. Growth is driven by advancements in battery technology and miniaturization.
- Non-portable: Dominates the market due to requirements for fixed installations and large-scale power needs. Growth is linked to advancements in generator technologies and power distribution systems.
By Source:
- Batteries: Large market share due to their portability and suitability for various applications. Growth is driven by advancements in battery technology, leading to higher energy density and longer lifespans.
- Generators: Significant market share due to their ability to provide continuous power. Growth is driven by enhanced fuel efficiency and reduced emissions.
- Other Sources: This segment includes fuel cells and solar power, showing gradual growth as technologies mature and costs decrease.
By Platform:
- Land: Largest segment, driven by the substantial demand for power solutions in ground vehicles and bases.
- Air: Significant growth, driven by the increasing use of UAVs and advanced aircraft requiring reliable and efficient power systems.
- Sea: Stable growth, driven by the requirement for reliable power on naval vessels and submarines.
Drivers:
- Increased defense budgets.
- Modernization of military equipment.
- Growing demand for lightweight and efficient power solutions.
- Technological advancements in battery and generator technologies.
Military Power Solutions Market Product Developments
Recent years have witnessed significant advancements in Military Power Solutions, including the development of high-energy-density batteries, more efficient generators, and improved power management systems. These innovations are aimed at enhancing performance, reducing weight and size, and improving overall operational efficiency. Fuel cell technologies are also gaining traction, offering cleaner and more efficient power options. Manufacturers are focusing on developing solutions that are ruggedized and capable of withstanding harsh environmental conditions.
Challenges in the Military Power Solutions Market Market
The Military Power Solutions market faces several challenges, including stringent regulatory requirements, supply chain vulnerabilities, and intense competition. Regulatory hurdles can increase development costs and timelines. Supply chain disruptions can lead to delays and increased costs. Intense competition puts pressure on pricing and profit margins. These factors collectively contribute to the complexities of the market.
Forces Driving Military Power Solutions Market Growth
Several factors drive the growth of the Military Power Solutions market. These include increasing defense budgets worldwide, the ongoing modernization of military hardware and infrastructure, and advancements in power technologies that lead to improved performance and efficiency. Furthermore, the demand for lightweight and compact power solutions for unmanned systems and mobile applications significantly contributes to the sector’s expansion.
Challenges in the Military Power Solutions Market Market
Long-term growth hinges on continued innovation, strategic partnerships, and expansion into new markets. Developing next-generation power solutions, fostering collaboration with research institutions and defense contractors, and tapping into emerging defense markets are vital for long-term growth.
Emerging Opportunities in Military Power Solutions Market
Emerging opportunities exist in the development of hybrid and electric power systems, increased adoption of fuel cells, and the integration of renewable energy sources. The expanding market for unmanned systems and autonomous platforms creates significant opportunities. Furthermore, the focus on sustainable and environmentally friendly power solutions presents new avenues for growth.
Leading Players in the Military Power Solutions Market Sector
- SFC Energy AG
- EnerSys
- Concorde Battery Corporation
- Saft Groupe SAS (TotalEnergies SE)
- Arotech Corporation
- RTX Corporation
- Denchi Group Ltd
- Eniquest
- HIMOINSA S
- Cummins Inc
- EaglePicher Technologies LLC
Key Milestones in Military Power Solutions Market Industry
- August 2023: Collins Aerospace (RTX Corporation) awarded a USD 24 Million contract for electric generators for the US Army's Abrams M1A2 Main Battle Tank. This highlights the demand for advanced power solutions in key military platforms.
- April 2023: EnerSys acquired Industrial Battery and Charger Services Limited (IBCS), expanding its service offerings and strengthening its market position in the UK. This signifies a strategic move towards consolidating market share and enhancing service capabilities.
Strategic Outlook for Military Power Solutions Market Market
The Military Power Solutions market presents significant growth potential driven by ongoing military modernization, technological advancements, and the increasing demand for reliable and efficient power solutions in diverse operational environments. Strategic partnerships, innovation in power technologies, and expansion into new markets are key to capitalizing on this potential. The market is poised for continued expansion, offering promising opportunities for industry players.
Military Power Solutions Market Segmentation
-
1. Type
- 1.1. Portable
- 1.2. Non-portable
-
2. Source
- 2.1. Batteries
- 2.2. Generators
- 2.3. Other Sources
-
3. Platform
- 3.1. Air
- 3.2. Land
- 3.3. Sea
Military Power Solutions Market Segmentation By Geography
-
1. North America
- 1.1. United States
- 1.2. Canada
-
2. Europe
- 2.1. United Kingdom
- 2.2. Germany
- 2.3. France
- 2.4. Russia
- 2.5. Rest of Europe
-
3. Asia Pacific
- 3.1. China
- 3.2. India
- 3.3. Japan
- 3.4. South Korea
- 3.5. Rest of Asia Pacific
-
4. Latin America
- 4.1. Brazil
- 4.2. Rest of Latin America
-
5. Middle East and Africa
- 5.1. United Arab Emirates
- 5.2. Saudi Arabia
- 5.3. Israel
- 5.4. Rest of Middle East and Africa
Military Power Solutions Market REPORT HIGHLIGHTS
| Aspects | Details |
|---|---|
| Study Period | 2019-2033 |
| Base Year | 2024 |
| Estimated Year | 2025 |
| Forecast Period | 2025-2033 |
| Historical Period | 2019-2024 |
| Growth Rate | CAGR of 7.75% from 2019-2033 |
| Segmentation |
|
Table of Contents
- 1. Introduction
- 1.1. Research Scope
- 1.2. Market Segmentation
- 1.3. Research Methodology
- 1.4. Definitions and Assumptions
- 2. Executive Summary
- 2.1. Introduction
- 3. Market Dynamics
- 3.1. Introduction
- 3.2. Market Drivers
- 3.3. Market Restrains
- 3.4. Market Trends
- 3.4.1. Generators Segment to Continue Market Share Domination
- 4. Market Factor Analysis
- 4.1. Porters Five Forces
- 4.2. Supply/Value Chain
- 4.3. PESTEL analysis
- 4.4. Market Entropy
- 4.5. Patent/Trademark Analysis
- 5. Global Military Power Solutions Market Analysis, Insights and Forecast, 2019-2031
- 5.1. Market Analysis, Insights and Forecast - by Type
- 5.1.1. Portable
- 5.1.2. Non-portable
- 5.2. Market Analysis, Insights and Forecast - by Source
- 5.2.1. Batteries
- 5.2.2. Generators
- 5.2.3. Other Sources
- 5.3. Market Analysis, Insights and Forecast - by Platform
- 5.3.1. Air
- 5.3.2. Land
- 5.3.3. Sea
- 5.4. Market Analysis, Insights and Forecast - by Region
- 5.4.1. North America
- 5.4.2. Europe
- 5.4.3. Asia Pacific
- 5.4.4. Latin America
- 5.4.5. Middle East and Africa
- 5.1. Market Analysis, Insights and Forecast - by Type
- 6. North America Military Power Solutions Market Analysis, Insights and Forecast, 2019-2031
- 6.1. Market Analysis, Insights and Forecast - by Type
- 6.1.1. Portable
- 6.1.2. Non-portable
- 6.2. Market Analysis, Insights and Forecast - by Source
- 6.2.1. Batteries
- 6.2.2. Generators
- 6.2.3. Other Sources
- 6.3. Market Analysis, Insights and Forecast - by Platform
- 6.3.1. Air
- 6.3.2. Land
- 6.3.3. Sea
- 6.1. Market Analysis, Insights and Forecast - by Type
- 7. Europe Military Power Solutions Market Analysis, Insights and Forecast, 2019-2031
- 7.1. Market Analysis, Insights and Forecast - by Type
- 7.1.1. Portable
- 7.1.2. Non-portable
- 7.2. Market Analysis, Insights and Forecast - by Source
- 7.2.1. Batteries
- 7.2.2. Generators
- 7.2.3. Other Sources
- 7.3. Market Analysis, Insights and Forecast - by Platform
- 7.3.1. Air
- 7.3.2. Land
- 7.3.3. Sea
- 7.1. Market Analysis, Insights and Forecast - by Type
- 8. Asia Pacific Military Power Solutions Market Analysis, Insights and Forecast, 2019-2031
- 8.1. Market Analysis, Insights and Forecast - by Type
- 8.1.1. Portable
- 8.1.2. Non-portable
- 8.2. Market Analysis, Insights and Forecast - by Source
- 8.2.1. Batteries
- 8.2.2. Generators
- 8.2.3. Other Sources
- 8.3. Market Analysis, Insights and Forecast - by Platform
- 8.3.1. Air
- 8.3.2. Land
- 8.3.3. Sea
- 8.1. Market Analysis, Insights and Forecast - by Type
- 9. Latin America Military Power Solutions Market Analysis, Insights and Forecast, 2019-2031
- 9.1. Market Analysis, Insights and Forecast - by Type
- 9.1.1. Portable
- 9.1.2. Non-portable
- 9.2. Market Analysis, Insights and Forecast - by Source
- 9.2.1. Batteries
- 9.2.2. Generators
- 9.2.3. Other Sources
- 9.3. Market Analysis, Insights and Forecast - by Platform
- 9.3.1. Air
- 9.3.2. Land
- 9.3.3. Sea
- 9.1. Market Analysis, Insights and Forecast - by Type
- 10. Middle East and Africa Military Power Solutions Market Analysis, Insights and Forecast, 2019-2031
- 10.1. Market Analysis, Insights and Forecast - by Type
- 10.1.1. Portable
- 10.1.2. Non-portable
- 10.2. Market Analysis, Insights and Forecast - by Source
- 10.2.1. Batteries
- 10.2.2. Generators
- 10.2.3. Other Sources
- 10.3. Market Analysis, Insights and Forecast - by Platform
- 10.3.1. Air
- 10.3.2. Land
- 10.3.3. Sea
- 10.1. Market Analysis, Insights and Forecast - by Type
- 11. North America Military Power Solutions Market Analysis, Insights and Forecast, 2019-2031
- 11.1. Market Analysis, Insights and Forecast - By Country/Sub-region
- 11.1.1 United States
- 11.1.2 Canada
- 12. Europe Military Power Solutions Market Analysis, Insights and Forecast, 2019-2031
- 12.1. Market Analysis, Insights and Forecast - By Country/Sub-region
- 12.1.1 United Kingdom
- 12.1.2 Germany
- 12.1.3 France
- 12.1.4 Russia
- 12.1.5 Rest of Europe
- 13. Asia Pacific Military Power Solutions Market Analysis, Insights and Forecast, 2019-2031
- 13.1. Market Analysis, Insights and Forecast - By Country/Sub-region
- 13.1.1 China
- 13.1.2 India
- 13.1.3 Japan
- 13.1.4 South Korea
- 13.1.5 Rest of Asia Pacific
- 14. Latin America Military Power Solutions Market Analysis, Insights and Forecast, 2019-2031
- 14.1. Market Analysis, Insights and Forecast - By Country/Sub-region
- 14.1.1 Brazil
- 14.1.2 Rest of Latin America
- 15. Middle East and Africa Military Power Solutions Market Analysis, Insights and Forecast, 2019-2031
- 15.1. Market Analysis, Insights and Forecast - By Country/Sub-region
- 15.1.1 United Arab Emirates
- 15.1.2 Saudi Arabia
- 15.1.3 Israel
- 15.1.4 Rest of Middle East and Africa
- 16. Competitive Analysis
- 16.1. Global Market Share Analysis 2024
- 16.2. Company Profiles
- 16.2.1 SFC Energy AG
- 16.2.1.1. Overview
- 16.2.1.2. Products
- 16.2.1.3. SWOT Analysis
- 16.2.1.4. Recent Developments
- 16.2.1.5. Financials (Based on Availability)
- 16.2.2 EnerSys
- 16.2.2.1. Overview
- 16.2.2.2. Products
- 16.2.2.3. SWOT Analysis
- 16.2.2.4. Recent Developments
- 16.2.2.5. Financials (Based on Availability)
- 16.2.3 Concorde Battery Corporation
- 16.2.3.1. Overview
- 16.2.3.2. Products
- 16.2.3.3. SWOT Analysis
- 16.2.3.4. Recent Developments
- 16.2.3.5. Financials (Based on Availability)
- 16.2.4 Saft Groupe SAS (TotalEnergies SE)
- 16.2.4.1. Overview
- 16.2.4.2. Products
- 16.2.4.3. SWOT Analysis
- 16.2.4.4. Recent Developments
- 16.2.4.5. Financials (Based on Availability)
- 16.2.5 Arotech Corporation
- 16.2.5.1. Overview
- 16.2.5.2. Products
- 16.2.5.3. SWOT Analysis
- 16.2.5.4. Recent Developments
- 16.2.5.5. Financials (Based on Availability)
- 16.2.6 RTX Corporation
- 16.2.6.1. Overview
- 16.2.6.2. Products
- 16.2.6.3. SWOT Analysis
- 16.2.6.4. Recent Developments
- 16.2.6.5. Financials (Based on Availability)
- 16.2.7 Denchi Group Ltd
- 16.2.7.1. Overview
- 16.2.7.2. Products
- 16.2.7.3. SWOT Analysis
- 16.2.7.4. Recent Developments
- 16.2.7.5. Financials (Based on Availability)
- 16.2.8 Eniquest
- 16.2.8.1. Overview
- 16.2.8.2. Products
- 16.2.8.3. SWOT Analysis
- 16.2.8.4. Recent Developments
- 16.2.8.5. Financials (Based on Availability)
- 16.2.9 HIMOINSA S
- 16.2.9.1. Overview
- 16.2.9.2. Products
- 16.2.9.3. SWOT Analysis
- 16.2.9.4. Recent Developments
- 16.2.9.5. Financials (Based on Availability)
- 16.2.10 Cummins Inc
- 16.2.10.1. Overview
- 16.2.10.2. Products
- 16.2.10.3. SWOT Analysis
- 16.2.10.4. Recent Developments
- 16.2.10.5. Financials (Based on Availability)
- 16.2.11 EaglePicher Technologies LLC
- 16.2.11.1. Overview
- 16.2.11.2. Products
- 16.2.11.3. SWOT Analysis
- 16.2.11.4. Recent Developments
- 16.2.11.5. Financials (Based on Availability)
- 16.2.1 SFC Energy AG
List of Figures
- Figure 1: Global Military Power Solutions Market Revenue Breakdown (Million, %) by Region 2024 & 2032
- Figure 2: North America Military Power Solutions Market Revenue (Million), by Country 2024 & 2032
- Figure 3: North America Military Power Solutions Market Revenue Share (%), by Country 2024 & 2032
- Figure 4: Europe Military Power Solutions Market Revenue (Million), by Country 2024 & 2032
- Figure 5: Europe Military Power Solutions Market Revenue Share (%), by Country 2024 & 2032
- Figure 6: Asia Pacific Military Power Solutions Market Revenue (Million), by Country 2024 & 2032
- Figure 7: Asia Pacific Military Power Solutions Market Revenue Share (%), by Country 2024 & 2032
- Figure 8: Latin America Military Power Solutions Market Revenue (Million), by Country 2024 & 2032
- Figure 9: Latin America Military Power Solutions Market Revenue Share (%), by Country 2024 & 2032
- Figure 10: Middle East and Africa Military Power Solutions Market Revenue (Million), by Country 2024 & 2032
- Figure 11: Middle East and Africa Military Power Solutions Market Revenue Share (%), by Country 2024 & 2032
- Figure 12: North America Military Power Solutions Market Revenue (Million), by Type 2024 & 2032
- Figure 13: North America Military Power Solutions Market Revenue Share (%), by Type 2024 & 2032
- Figure 14: North America Military Power Solutions Market Revenue (Million), by Source 2024 & 2032
- Figure 15: North America Military Power Solutions Market Revenue Share (%), by Source 2024 & 2032
- Figure 16: North America Military Power Solutions Market Revenue (Million), by Platform 2024 & 2032
- Figure 17: North America Military Power Solutions Market Revenue Share (%), by Platform 2024 & 2032
- Figure 18: North America Military Power Solutions Market Revenue (Million), by Country 2024 & 2032
- Figure 19: North America Military Power Solutions Market Revenue Share (%), by Country 2024 & 2032
- Figure 20: Europe Military Power Solutions Market Revenue (Million), by Type 2024 & 2032
- Figure 21: Europe Military Power Solutions Market Revenue Share (%), by Type 2024 & 2032
- Figure 22: Europe Military Power Solutions Market Revenue (Million), by Source 2024 & 2032
- Figure 23: Europe Military Power Solutions Market Revenue Share (%), by Source 2024 & 2032
- Figure 24: Europe Military Power Solutions Market Revenue (Million), by Platform 2024 & 2032
- Figure 25: Europe Military Power Solutions Market Revenue Share (%), by Platform 2024 & 2032
- Figure 26: Europe Military Power Solutions Market Revenue (Million), by Country 2024 & 2032
- Figure 27: Europe Military Power Solutions Market Revenue Share (%), by Country 2024 & 2032
- Figure 28: Asia Pacific Military Power Solutions Market Revenue (Million), by Type 2024 & 2032
- Figure 29: Asia Pacific Military Power Solutions Market Revenue Share (%), by Type 2024 & 2032
- Figure 30: Asia Pacific Military Power Solutions Market Revenue (Million), by Source 2024 & 2032
- Figure 31: Asia Pacific Military Power Solutions Market Revenue Share (%), by Source 2024 & 2032
- Figure 32: Asia Pacific Military Power Solutions Market Revenue (Million), by Platform 2024 & 2032
- Figure 33: Asia Pacific Military Power Solutions Market Revenue Share (%), by Platform 2024 & 2032
- Figure 34: Asia Pacific Military Power Solutions Market Revenue (Million), by Country 2024 & 2032
- Figure 35: Asia Pacific Military Power Solutions Market Revenue Share (%), by Country 2024 & 2032
- Figure 36: Latin America Military Power Solutions Market Revenue (Million), by Type 2024 & 2032
- Figure 37: Latin America Military Power Solutions Market Revenue Share (%), by Type 2024 & 2032
- Figure 38: Latin America Military Power Solutions Market Revenue (Million), by Source 2024 & 2032
- Figure 39: Latin America Military Power Solutions Market Revenue Share (%), by Source 2024 & 2032
- Figure 40: Latin America Military Power Solutions Market Revenue (Million), by Platform 2024 & 2032
- Figure 41: Latin America Military Power Solutions Market Revenue Share (%), by Platform 2024 & 2032
- Figure 42: Latin America Military Power Solutions Market Revenue (Million), by Country 2024 & 2032
- Figure 43: Latin America Military Power Solutions Market Revenue Share (%), by Country 2024 & 2032
- Figure 44: Middle East and Africa Military Power Solutions Market Revenue (Million), by Type 2024 & 2032
- Figure 45: Middle East and Africa Military Power Solutions Market Revenue Share (%), by Type 2024 & 2032
- Figure 46: Middle East and Africa Military Power Solutions Market Revenue (Million), by Source 2024 & 2032
- Figure 47: Middle East and Africa Military Power Solutions Market Revenue Share (%), by Source 2024 & 2032
- Figure 48: Middle East and Africa Military Power Solutions Market Revenue (Million), by Platform 2024 & 2032
- Figure 49: Middle East and Africa Military Power Solutions Market Revenue Share (%), by Platform 2024 & 2032
- Figure 50: Middle East and Africa Military Power Solutions Market Revenue (Million), by Country 2024 & 2032
- Figure 51: Middle East and Africa Military Power Solutions Market Revenue Share (%), by Country 2024 & 2032
List of Tables
- Table 1: Global Military Power Solutions Market Revenue Million Forecast, by Region 2019 & 2032
- Table 2: Global Military Power Solutions Market Revenue Million Forecast, by Type 2019 & 2032
- Table 3: Global Military Power Solutions Market Revenue Million Forecast, by Source 2019 & 2032
- Table 4: Global Military Power Solutions Market Revenue Million Forecast, by Platform 2019 & 2032
- Table 5: Global Military Power Solutions Market Revenue Million Forecast, by Region 2019 & 2032
- Table 6: Global Military Power Solutions Market Revenue Million Forecast, by Country 2019 & 2032
- Table 7: United States Military Power Solutions Market Revenue (Million) Forecast, by Application 2019 & 2032
- Table 8: Canada Military Power Solutions Market Revenue (Million) Forecast, by Application 2019 & 2032
- Table 9: Global Military Power Solutions Market Revenue Million Forecast, by Country 2019 & 2032
- Table 10: United Kingdom Military Power Solutions Market Revenue (Million) Forecast, by Application 2019 & 2032
- Table 11: Germany Military Power Solutions Market Revenue (Million) Forecast, by Application 2019 & 2032
- Table 12: France Military Power Solutions Market Revenue (Million) Forecast, by Application 2019 & 2032
- Table 13: Russia Military Power Solutions Market Revenue (Million) Forecast, by Application 2019 & 2032
- Table 14: Rest of Europe Military Power Solutions Market Revenue (Million) Forecast, by Application 2019 & 2032
- Table 15: Global Military Power Solutions Market Revenue Million Forecast, by Country 2019 & 2032
- Table 16: China Military Power Solutions Market Revenue (Million) Forecast, by Application 2019 & 2032
- Table 17: India Military Power Solutions Market Revenue (Million) Forecast, by Application 2019 & 2032
- Table 18: Japan Military Power Solutions Market Revenue (Million) Forecast, by Application 2019 & 2032
- Table 19: South Korea Military Power Solutions Market Revenue (Million) Forecast, by Application 2019 & 2032
- Table 20: Rest of Asia Pacific Military Power Solutions Market Revenue (Million) Forecast, by Application 2019 & 2032
- Table 21: Global Military Power Solutions Market Revenue Million Forecast, by Country 2019 & 2032
- Table 22: Brazil Military Power Solutions Market Revenue (Million) Forecast, by Application 2019 & 2032
- Table 23: Rest of Latin America Military Power Solutions Market Revenue (Million) Forecast, by Application 2019 & 2032
- Table 24: Global Military Power Solutions Market Revenue Million Forecast, by Country 2019 & 2032
- Table 25: United Arab Emirates Military Power Solutions Market Revenue (Million) Forecast, by Application 2019 & 2032
- Table 26: Saudi Arabia Military Power Solutions Market Revenue (Million) Forecast, by Application 2019 & 2032
- Table 27: Israel Military Power Solutions Market Revenue (Million) Forecast, by Application 2019 & 2032
- Table 28: Rest of Middle East and Africa Military Power Solutions Market Revenue (Million) Forecast, by Application 2019 & 2032
- Table 29: Global Military Power Solutions Market Revenue Million Forecast, by Type 2019 & 2032
- Table 30: Global Military Power Solutions Market Revenue Million Forecast, by Source 2019 & 2032
- Table 31: Global Military Power Solutions Market Revenue Million Forecast, by Platform 2019 & 2032
- Table 32: Global Military Power Solutions Market Revenue Million Forecast, by Country 2019 & 2032
- Table 33: United States Military Power Solutions Market Revenue (Million) Forecast, by Application 2019 & 2032
- Table 34: Canada Military Power Solutions Market Revenue (Million) Forecast, by Application 2019 & 2032
- Table 35: Global Military Power Solutions Market Revenue Million Forecast, by Type 2019 & 2032
- Table 36: Global Military Power Solutions Market Revenue Million Forecast, by Source 2019 & 2032
- Table 37: Global Military Power Solutions Market Revenue Million Forecast, by Platform 2019 & 2032
- Table 38: Global Military Power Solutions Market Revenue Million Forecast, by Country 2019 & 2032
- Table 39: United Kingdom Military Power Solutions Market Revenue (Million) Forecast, by Application 2019 & 2032
- Table 40: Germany Military Power Solutions Market Revenue (Million) Forecast, by Application 2019 & 2032
- Table 41: France Military Power Solutions Market Revenue (Million) Forecast, by Application 2019 & 2032
- Table 42: Russia Military Power Solutions Market Revenue (Million) Forecast, by Application 2019 & 2032
- Table 43: Rest of Europe Military Power Solutions Market Revenue (Million) Forecast, by Application 2019 & 2032
- Table 44: Global Military Power Solutions Market Revenue Million Forecast, by Type 2019 & 2032
- Table 45: Global Military Power Solutions Market Revenue Million Forecast, by Source 2019 & 2032
- Table 46: Global Military Power Solutions Market Revenue Million Forecast, by Platform 2019 & 2032
- Table 47: Global Military Power Solutions Market Revenue Million Forecast, by Country 2019 & 2032
- Table 48: China Military Power Solutions Market Revenue (Million) Forecast, by Application 2019 & 2032
- Table 49: India Military Power Solutions Market Revenue (Million) Forecast, by Application 2019 & 2032
- Table 50: Japan Military Power Solutions Market Revenue (Million) Forecast, by Application 2019 & 2032
- Table 51: South Korea Military Power Solutions Market Revenue (Million) Forecast, by Application 2019 & 2032
- Table 52: Rest of Asia Pacific Military Power Solutions Market Revenue (Million) Forecast, by Application 2019 & 2032
- Table 53: Global Military Power Solutions Market Revenue Million Forecast, by Type 2019 & 2032
- Table 54: Global Military Power Solutions Market Revenue Million Forecast, by Source 2019 & 2032
- Table 55: Global Military Power Solutions Market Revenue Million Forecast, by Platform 2019 & 2032
- Table 56: Global Military Power Solutions Market Revenue Million Forecast, by Country 2019 & 2032
- Table 57: Brazil Military Power Solutions Market Revenue (Million) Forecast, by Application 2019 & 2032
- Table 58: Rest of Latin America Military Power Solutions Market Revenue (Million) Forecast, by Application 2019 & 2032
- Table 59: Global Military Power Solutions Market Revenue Million Forecast, by Type 2019 & 2032
- Table 60: Global Military Power Solutions Market Revenue Million Forecast, by Source 2019 & 2032
- Table 61: Global Military Power Solutions Market Revenue Million Forecast, by Platform 2019 & 2032
- Table 62: Global Military Power Solutions Market Revenue Million Forecast, by Country 2019 & 2032
- Table 63: United Arab Emirates Military Power Solutions Market Revenue (Million) Forecast, by Application 2019 & 2032
- Table 64: Saudi Arabia Military Power Solutions Market Revenue (Million) Forecast, by Application 2019 & 2032
- Table 65: Israel Military Power Solutions Market Revenue (Million) Forecast, by Application 2019 & 2032
- Table 66: Rest of Middle East and Africa Military Power Solutions Market Revenue (Million) Forecast, by Application 2019 & 2032
Frequently Asked Questions
1. What is the projected Compound Annual Growth Rate (CAGR) of the Military Power Solutions Market?
The projected CAGR is approximately 7.75%.
2. Which companies are prominent players in the Military Power Solutions Market?
Key companies in the market include SFC Energy AG, EnerSys, Concorde Battery Corporation, Saft Groupe SAS (TotalEnergies SE), Arotech Corporation, RTX Corporation, Denchi Group Ltd, Eniquest, HIMOINSA S, Cummins Inc, EaglePicher Technologies LLC.
3. What are the main segments of the Military Power Solutions Market?
The market segments include Type, Source, Platform.
4. Can you provide details about the market size?
The market size is estimated to be USD 7.77 Million as of 2022.
5. What are some drivers contributing to market growth?
N/A
6. What are the notable trends driving market growth?
Generators Segment to Continue Market Share Domination.
7. Are there any restraints impacting market growth?
N/A
8. Can you provide examples of recent developments in the market?
August 2023: Collins Aerospace, a part of RTX Corporation, was awarded a USD 24 million contract for producing and delivering electric generators with containers to the USArmy Anniston Depot to support its Abrams M1A2 Main Battle Tank.
9. What pricing options are available for accessing the report?
Pricing options include single-user, multi-user, and enterprise licenses priced at USD 4750, USD 5250, and USD 8750 respectively.
10. Is the market size provided in terms of value or volume?
The market size is provided in terms of value, measured in Million.
11. Are there any specific market keywords associated with the report?
Yes, the market keyword associated with the report is "Military Power Solutions Market," which aids in identifying and referencing the specific market segment covered.
12. How do I determine which pricing option suits my needs best?
The pricing options vary based on user requirements and access needs. Individual users may opt for single-user licenses, while businesses requiring broader access may choose multi-user or enterprise licenses for cost-effective access to the report.
13. Are there any additional resources or data provided in the Military Power Solutions Market report?
While the report offers comprehensive insights, it's advisable to review the specific contents or supplementary materials provided to ascertain if additional resources or data are available.
14. How can I stay updated on further developments or reports in the Military Power Solutions Market?
To stay informed about further developments, trends, and reports in the Military Power Solutions Market, consider subscribing to industry newsletters, following relevant companies and organizations, or regularly checking reputable industry news sources and publications.
Methodology
Step 1 - Identification of Relevant Samples Size from Population Database


Step 2 - Approaches for Defining Global Market Size (Value, Volume* & Price*)

Note*: In applicable scenarios
Step 3 - Data Sources
Primary Research
- Web Analytics
- Survey Reports
- Research Institute
- Latest Research Reports
- Opinion Leaders
Secondary Research
- Annual Reports
- White Paper
- Latest Press Release
- Industry Association
- Paid Database
- Investor Presentations

Step 4 - Data Triangulation
Involves using different sources of information in order to increase the validity of a study
These sources are likely to be stakeholders in a program - participants, other researchers, program staff, other community members, and so on.
Then we put all data in single framework & apply various statistical tools to find out the dynamic on the market.
During the analysis stage, feedback from the stakeholder groups would be compared to determine areas of agreement as well as areas of divergence
