

Key Insights
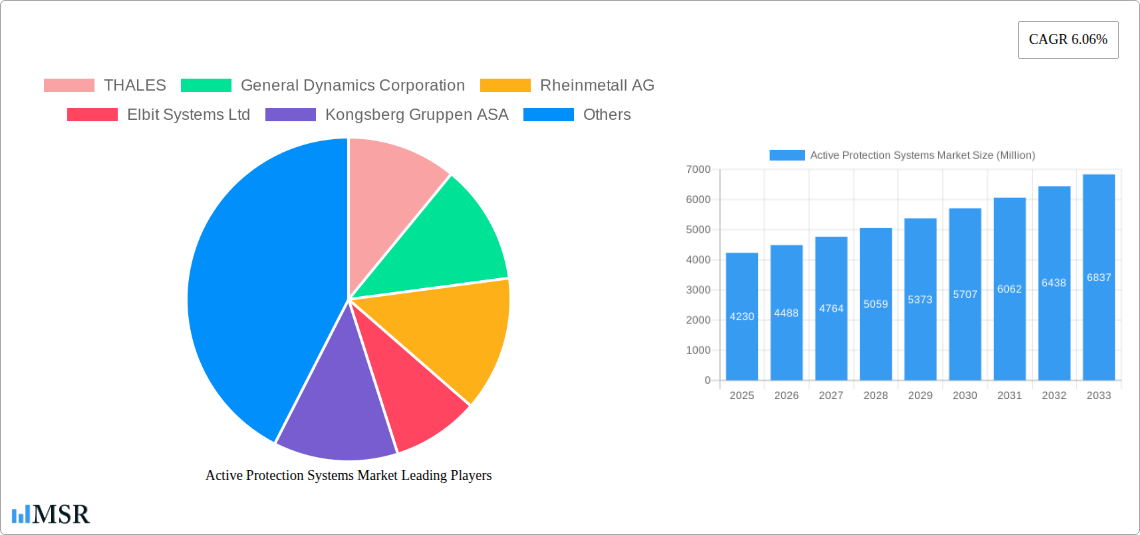
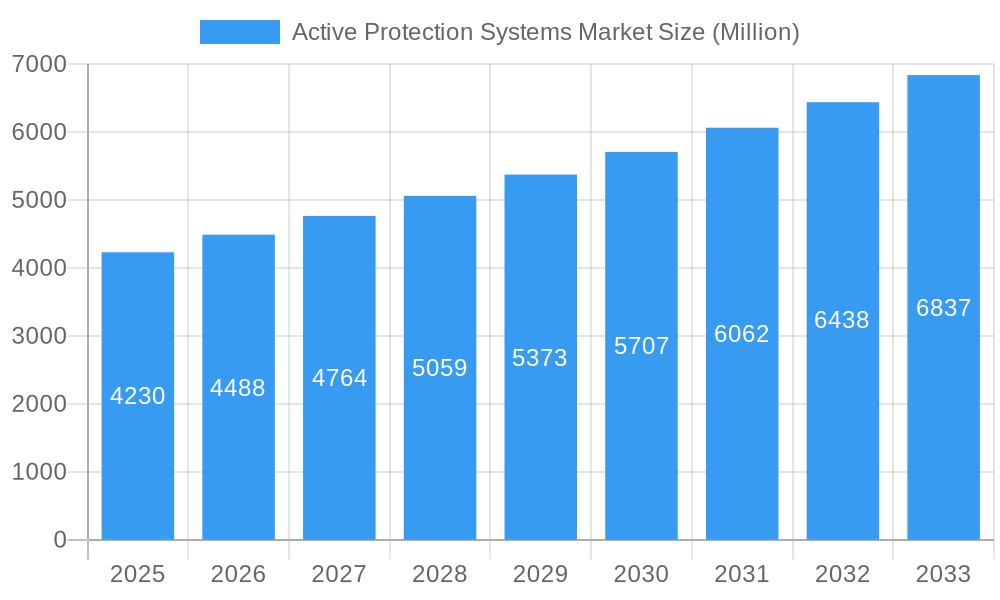
The Active Protection Systems (APS) market, valued at $4.23 billion in 2025, is projected to experience robust growth, driven by escalating geopolitical tensions and rising defense budgets globally. A Compound Annual Growth Rate (CAGR) of 6.06% from 2025 to 2033 indicates a significant expansion of the market, reaching an estimated $7.2 billion by 2033. Key drivers include the increasing demand for enhanced survivability of armored vehicles and platforms against various threats, including RPGs, anti-tank guided missiles, and improvised explosive devices. Technological advancements, such as the integration of advanced sensors and AI-powered algorithms for improved threat detection and neutralization, are further fueling market growth. The market segmentation reveals a strong preference for hard-kill systems, offering direct neutralization of incoming threats, while the terrestrial platform segment dominates due to its widespread application in land-based military operations. Leading companies such as Thales, General Dynamics, and Rheinmetall are at the forefront of innovation, continuously developing and deploying sophisticated APS technologies. Regional analysis suggests North America and Europe will hold significant market shares, reflecting these regions' substantial defense spending and technological advancements. However, the Asia-Pacific region is expected to witness considerable growth due to increasing military modernization efforts in several countries. Restraints on market growth include the high cost of APS systems and the complexities involved in their integration into existing platforms.
Active Protection Systems Market Market Size (In Billion)
Despite these challenges, the growing need for improved soldier protection and the continuous development of more effective and affordable APS solutions will continue to drive market expansion. The market is witnessing a shift towards lighter, more adaptable systems designed for various platforms, including unmanned ground vehicles and naval vessels. This trend signifies a wider adoption of APS across different defense applications. Future developments are likely to focus on improving system reliability, reducing weight and size, and enhancing countermeasure capabilities against emerging threats, particularly those employing advanced technologies. The continuous investment in research and development by major defense contractors will be pivotal in shaping the future of the APS market.
Active Protection Systems Market Company Market Share
Active Protection Systems Market: A Comprehensive Report (2019-2033)
This in-depth report provides a comprehensive analysis of the Active Protection Systems (APS) market, offering valuable insights for industry stakeholders, investors, and strategic decision-makers. The study period covers 2019-2033, with a base year of 2025 and a forecast period of 2025-2033. The report delves into market dynamics, growth drivers, key segments (Hard-Kill and Soft-Kill Systems; Terrestrial and Naval Platforms), leading players (including THALES, General Dynamics Corporation, Rheinmetall AG, and more), and emerging opportunities. The market is projected to reach xx Million by 2033, exhibiting a CAGR of xx% during the forecast period.
Active Protection Systems Market Market Concentration & Dynamics
The Active Protection Systems market exhibits a moderately concentrated landscape, with key players like THALES, General Dynamics Corporation, and Rheinmetall AG holding significant market share. However, the emergence of innovative smaller companies and ongoing M&A activity are reshaping the competitive dynamics. The market's innovation ecosystem is robust, driven by advancements in sensor technologies, AI, and electronic countermeasures. Regulatory frameworks, particularly export controls and defense procurement regulations, significantly influence market access and growth. Substitute products, such as improved armor and reactive armor, exert some competitive pressure. End-user trends, primarily focused on enhancing platform survivability and reducing casualties, are strong growth drivers.
- Market Share: Top 5 players hold approximately xx% of the market share (2025).
- M&A Activity: An estimated xx M&A deals occurred in the historical period (2019-2024), indicating considerable consolidation and strategic expansion within the sector.
- Regulatory Landscape: Stringent regulations in various countries impact product development and deployment timelines.
Active Protection Systems Market Industry Insights & Trends
The Active Protection Systems market is experiencing robust growth, driven by increasing defense budgets globally, escalating geopolitical tensions, and the demand for enhanced battlefield survivability. Technological advancements such as AI-powered threat detection and more effective countermeasures are accelerating market expansion. The rising adoption of APS in modern armored vehicles and naval vessels is a key market driver. Consumer behavior (in this case, the needs of defense forces) is heavily influenced by technological superiority and cost-effectiveness considerations. The market size was valued at approximately xx Million in 2025, expected to grow to xx Million by 2033.
Key Markets & Segments Leading Active Protection Systems Market
The Terrestrial segment currently dominates the Active Protection Systems market, driven by the significant demand for APS integration into land-based armored vehicles across various military forces. The Hard-Kill system type shows higher market share due to its effectiveness against direct threats. North America and Europe are currently the leading regional markets, owing to robust defense budgets and ongoing modernization programs.
Key Growth Drivers:
- Terrestrial Segment: Increasing demand for enhanced protection of armored vehicles.
- Hard-Kill Systems: Proven effectiveness against kinetic energy projectiles.
- North America: High defense spending and technological advancements.
- Europe: Strong focus on military modernization and collaborative defense initiatives.
Active Protection Systems Market Product Developments
Recent advancements in Active Protection Systems focus on improving accuracy, reducing false alarms, and enhancing effectiveness against a wider range of threats. This includes the integration of advanced sensors, AI-powered threat assessment algorithms, and more sophisticated countermeasures. The development of lighter, more compact systems is also crucial for enhancing platform agility and reducing weight penalties. The incorporation of network-centric capabilities allows for improved situational awareness and coordinated defense strategies.
Challenges in the Active Protection Systems Market Market
Significant challenges include the high cost of APS systems, potential for fratricide, and the need for stringent testing and certification. Supply chain vulnerabilities and the complex integration processes also pose obstacles. The competitive landscape is intense, with established players and new entrants vying for market share. These factors collectively influence market growth trajectory, leading to xx% market penetration in 2025.
Forces Driving Active Protection Systems Market Growth
Technological advancements, increasing defense budgets, geopolitical instability, and a rising need for enhanced protection of military assets are driving market expansion. Specific examples include the development of counter-drone technologies and the integration of APS into unmanned ground vehicles and naval vessels. Government initiatives promoting military modernization also contribute to market growth.
Challenges in the Active Protection Systems Market Market
Long-term growth relies on continuous innovation in sensor technology, AI, and countermeasure effectiveness. Strategic partnerships between defense contractors and technology providers will be crucial. Expansion into new markets, such as emerging economies, and the development of more affordable APS solutions will be key to sustainable growth.
Emerging Opportunities in Active Protection Systems Market
Emerging opportunities include the integration of APS into unmanned aerial vehicles (UAVs), the development of directed energy weapons as countermeasures, and the expansion into civilian applications, such as protecting critical infrastructure. The market for AI-powered threat assessment and autonomous countermeasure deployment is expected to grow significantly.
Leading Players in the Active Protection Systems Market Sector
- THALES
- General Dynamics Corporation
- Rheinmetall AG
- Elbit Systems Ltd
- Kongsberg Gruppen ASA
- Rostec State Corporation
- Rafael Advanced Defense Systems Ltd
- RTX Corporation
- Artis
- Leonardo S p A
- BAE Systems plc
- Saab AB
- ASELSAN A Ş
Key Milestones in Active Protection Systems Market Industry
- 2020: Successful deployment of a new generation of APS on a major tank platform.
- 2022: Launch of a joint venture between two major defense contractors focused on APS development.
- 2023: Introduction of a new lightweight APS system for use in smaller armored vehicles.
- 2024: Significant investment in R&D for AI-powered threat assessment algorithms for APS.
Strategic Outlook for Active Protection Systems Market Market
The Active Protection Systems market is poised for continued growth driven by technological advancements, geopolitical factors, and a growing emphasis on military modernization. Strategic opportunities lie in developing advanced countermeasures, expanding into new market segments, and forging strategic partnerships to accelerate innovation. The long-term outlook is positive, with significant potential for market expansion.
Active Protection Systems Market Segmentation
- 1. Production Analysis
- 2. Consumption Analysis
- 3. Import Market Analysis (Value & Volume)
- 4. Export Market Analysis (Value & Volume)
- 5. Price Trend Analysis
Active Protection Systems Market Segmentation By Geography
-
1. North America
- 1.1. United States
- 1.2. Canada
- 1.3. Mexico
-
2. South America
- 2.1. Brazil
- 2.2. Argentina
- 2.3. Rest of South America
-
3. Europe
- 3.1. United Kingdom
- 3.2. Germany
- 3.3. France
- 3.4. Italy
- 3.5. Spain
- 3.6. Russia
- 3.7. Benelux
- 3.8. Nordics
- 3.9. Rest of Europe
-
4. Middle East & Africa
- 4.1. Turkey
- 4.2. Israel
- 4.3. GCC
- 4.4. North Africa
- 4.5. South Africa
- 4.6. Rest of Middle East & Africa
-
5. Asia Pacific
- 5.1. China
- 5.2. India
- 5.3. Japan
- 5.4. South Korea
- 5.5. ASEAN
- 5.6. Oceania
- 5.7. Rest of Asia Pacific
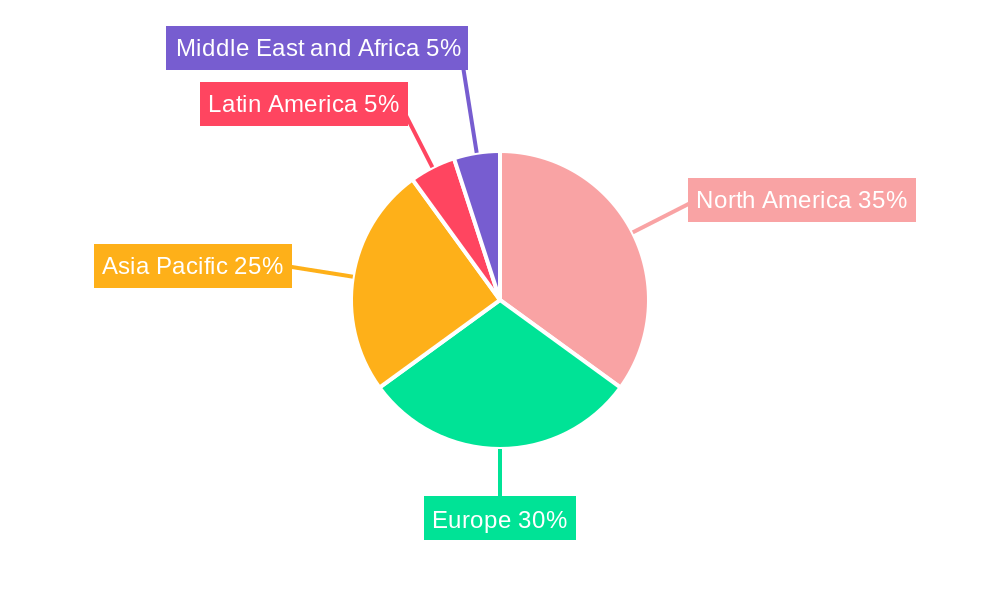
Active Protection Systems Market Regional Market Share
Geographic Coverage of Active Protection Systems Market
Active Protection Systems Market REPORT HIGHLIGHTS
| Aspects | Details |
|---|---|
| Study Period | 2020-2034 |
| Base Year | 2025 |
| Estimated Year | 2026 |
| Forecast Period | 2026-2034 |
| Historical Period | 2020-2025 |
| Growth Rate | CAGR of 6.06% from 2020-2034 |
| Segmentation |
|
Table of Contents
- 1. Introduction
- 1.1. Research Scope
- 1.2. Market Segmentation
- 1.3. Research Objective
- 1.4. Definitions and Assumptions
- 2. Executive Summary
- 2.1. Market Snapshot
- 3. Market Dynamics
- 3.1. Market Drivers
- 3.2. Market Restrains
- 3.3. Market Trends
- 3.4. Market Opportunities
- 4. Market Factor Analysis
- 4.1. Porters Five Forces
- 4.1.1. Bargaining Power of Suppliers
- 4.1.2. Bargaining Power of Buyers
- 4.1.3. Threat of New Entrants
- 4.1.4. Threat of Substitutes
- 4.1.5. Competitive Rivalry
- 4.2. PESTEL analysis
- 4.3. BCG Analysis
- 4.3.1. Stars (High Growth, High Market Share)
- 4.3.2. Cash Cows (Low Growth, High Market Share)
- 4.3.3. Question Mark (High Growth, Low Market Share)
- 4.3.4. Dogs (Low Growth, Low Market Share)
- 4.4. Ansoff Matrix Analysis
- 4.5. Supply Chain Analysis
- 4.6. Regulatory Landscape
- 4.7. Current Market Potential and Opportunity Assessment (TAM–SAM–SOM Framework)
- 4.8. MSR Analyst Note
- 4.1. Porters Five Forces
- 5. Market Analysis, Insights and Forecast 2021-2033
- 5.1. Market Analysis, Insights and Forecast - by Production Analysis
- 5.2. Market Analysis, Insights and Forecast - by Consumption Analysis
- 5.3. Market Analysis, Insights and Forecast - by Import Market Analysis (Value & Volume)
- 5.4. Market Analysis, Insights and Forecast - by Export Market Analysis (Value & Volume)
- 5.5. Market Analysis, Insights and Forecast - by Price Trend Analysis
- 5.6. Market Analysis, Insights and Forecast - by Region
- 5.6.1. North America
- 5.6.2. South America
- 5.6.3. Europe
- 5.6.4. Middle East & Africa
- 5.6.5. Asia Pacific
- 6. Global Active Protection Systems Market Analysis, Insights and Forecast, 2021-2033
- 6.1. Market Analysis, Insights and Forecast - by Production Analysis
- 6.2. Market Analysis, Insights and Forecast - by Consumption Analysis
- 6.3. Market Analysis, Insights and Forecast - by Import Market Analysis (Value & Volume)
- 6.4. Market Analysis, Insights and Forecast - by Export Market Analysis (Value & Volume)
- 6.5. Market Analysis, Insights and Forecast - by Price Trend Analysis
- 7. North America Active Protection Systems Market Analysis, Insights and Forecast, 2020-2032
- 7.1. Market Analysis, Insights and Forecast - by Production Analysis
- 7.2. Market Analysis, Insights and Forecast - by Consumption Analysis
- 7.3. Market Analysis, Insights and Forecast - by Import Market Analysis (Value & Volume)
- 7.4. Market Analysis, Insights and Forecast - by Export Market Analysis (Value & Volume)
- 7.5. Market Analysis, Insights and Forecast - by Price Trend Analysis
- 8. South America Active Protection Systems Market Analysis, Insights and Forecast, 2020-2032
- 8.1. Market Analysis, Insights and Forecast - by Production Analysis
- 8.2. Market Analysis, Insights and Forecast - by Consumption Analysis
- 8.3. Market Analysis, Insights and Forecast - by Import Market Analysis (Value & Volume)
- 8.4. Market Analysis, Insights and Forecast - by Export Market Analysis (Value & Volume)
- 8.5. Market Analysis, Insights and Forecast - by Price Trend Analysis
- 9. Europe Active Protection Systems Market Analysis, Insights and Forecast, 2020-2032
- 9.1. Market Analysis, Insights and Forecast - by Production Analysis
- 9.2. Market Analysis, Insights and Forecast - by Consumption Analysis
- 9.3. Market Analysis, Insights and Forecast - by Import Market Analysis (Value & Volume)
- 9.4. Market Analysis, Insights and Forecast - by Export Market Analysis (Value & Volume)
- 9.5. Market Analysis, Insights and Forecast - by Price Trend Analysis
- 10. Middle East & Africa Active Protection Systems Market Analysis, Insights and Forecast, 2020-2032
- 10.1. Market Analysis, Insights and Forecast - by Production Analysis
- 10.2. Market Analysis, Insights and Forecast - by Consumption Analysis
- 10.3. Market Analysis, Insights and Forecast - by Import Market Analysis (Value & Volume)
- 10.4. Market Analysis, Insights and Forecast - by Export Market Analysis (Value & Volume)
- 10.5. Market Analysis, Insights and Forecast - by Price Trend Analysis
- 11. Asia Pacific Active Protection Systems Market Analysis, Insights and Forecast, 2020-2032
- 11.1. Market Analysis, Insights and Forecast - by Production Analysis
- 11.2. Market Analysis, Insights and Forecast - by Consumption Analysis
- 11.3. Market Analysis, Insights and Forecast - by Import Market Analysis (Value & Volume)
- 11.4. Market Analysis, Insights and Forecast - by Export Market Analysis (Value & Volume)
- 11.5. Market Analysis, Insights and Forecast - by Price Trend Analysis
- 12. Competitive Analysis
- 12.1. Company Profiles
- 12.1.1 THALES
- 12.1.1.1. Company Overview
- 12.1.1.2. Products
- 12.1.1.3. Company Financials
- 12.1.1.4. SWOT Analysis
- 12.1.2 General Dynamics Corporation
- 12.1.2.1. Company Overview
- 12.1.2.2. Products
- 12.1.2.3. Company Financials
- 12.1.2.4. SWOT Analysis
- 12.1.3 Rheinmetall AG
- 12.1.3.1. Company Overview
- 12.1.3.2. Products
- 12.1.3.3. Company Financials
- 12.1.3.4. SWOT Analysis
- 12.1.4 Elbit Systems Ltd
- 12.1.4.1. Company Overview
- 12.1.4.2. Products
- 12.1.4.3. Company Financials
- 12.1.4.4. SWOT Analysis
- 12.1.5 Kongsberg Gruppen ASA
- 12.1.5.1. Company Overview
- 12.1.5.2. Products
- 12.1.5.3. Company Financials
- 12.1.5.4. SWOT Analysis
- 12.1.6 Rostec State Corporatio
- 12.1.6.1. Company Overview
- 12.1.6.2. Products
- 12.1.6.3. Company Financials
- 12.1.6.4. SWOT Analysis
- 12.1.7 Rafael Advanced Defense Systems Ltd
- 12.1.7.1. Company Overview
- 12.1.7.2. Products
- 12.1.7.3. Company Financials
- 12.1.7.4. SWOT Analysis
- 12.1.8 RTX Corporation
- 12.1.8.1. Company Overview
- 12.1.8.2. Products
- 12.1.8.3. Company Financials
- 12.1.8.4. SWOT Analysis
- 12.1.9 Artis
- 12.1.9.1. Company Overview
- 12.1.9.2. Products
- 12.1.9.3. Company Financials
- 12.1.9.4. SWOT Analysis
- 12.1.10 Leonardo S p A
- 12.1.10.1. Company Overview
- 12.1.10.2. Products
- 12.1.10.3. Company Financials
- 12.1.10.4. SWOT Analysis
- 12.1.11 BAE Systems plc
- 12.1.11.1. Company Overview
- 12.1.11.2. Products
- 12.1.11.3. Company Financials
- 12.1.11.4. SWOT Analysis
- 12.1.12 Saab AB
- 12.1.12.1. Company Overview
- 12.1.12.2. Products
- 12.1.12.3. Company Financials
- 12.1.12.4. SWOT Analysis
- 12.1.13 ASELSAN A Ş
- 12.1.13.1. Company Overview
- 12.1.13.2. Products
- 12.1.13.3. Company Financials
- 12.1.13.4. SWOT Analysis
- 12.1.1 THALES
- 12.2. Market Entropy
- 12.2.1 Company's Key Areas Served
- 12.2.2 Recent Developments
- 12.3. Company Market Share Analysis 2025
- 12.3.1 Top 5 Companies Market Share Analysis
- 12.3.2 Top 3 Companies Market Share Analysis
- 12.4. List of Potential Customers
- 13. Research Methodology
List of Figures
- Figure 1: Global Active Protection Systems Market Revenue Breakdown (Million, %) by Region 2025 & 2033
- Figure 2: North America Active Protection Systems Market Revenue (Million), by Production Analysis 2025 & 2033
- Figure 3: North America Active Protection Systems Market Revenue Share (%), by Production Analysis 2025 & 2033
- Figure 4: North America Active Protection Systems Market Revenue (Million), by Consumption Analysis 2025 & 2033
- Figure 5: North America Active Protection Systems Market Revenue Share (%), by Consumption Analysis 2025 & 2033
- Figure 6: North America Active Protection Systems Market Revenue (Million), by Import Market Analysis (Value & Volume) 2025 & 2033
- Figure 7: North America Active Protection Systems Market Revenue Share (%), by Import Market Analysis (Value & Volume) 2025 & 2033
- Figure 8: North America Active Protection Systems Market Revenue (Million), by Export Market Analysis (Value & Volume) 2025 & 2033
- Figure 9: North America Active Protection Systems Market Revenue Share (%), by Export Market Analysis (Value & Volume) 2025 & 2033
- Figure 10: North America Active Protection Systems Market Revenue (Million), by Price Trend Analysis 2025 & 2033
- Figure 11: North America Active Protection Systems Market Revenue Share (%), by Price Trend Analysis 2025 & 2033
- Figure 12: North America Active Protection Systems Market Revenue (Million), by Country 2025 & 2033
- Figure 13: North America Active Protection Systems Market Revenue Share (%), by Country 2025 & 2033
- Figure 14: South America Active Protection Systems Market Revenue (Million), by Production Analysis 2025 & 2033
- Figure 15: South America Active Protection Systems Market Revenue Share (%), by Production Analysis 2025 & 2033
- Figure 16: South America Active Protection Systems Market Revenue (Million), by Consumption Analysis 2025 & 2033
- Figure 17: South America Active Protection Systems Market Revenue Share (%), by Consumption Analysis 2025 & 2033
- Figure 18: South America Active Protection Systems Market Revenue (Million), by Import Market Analysis (Value & Volume) 2025 & 2033
- Figure 19: South America Active Protection Systems Market Revenue Share (%), by Import Market Analysis (Value & Volume) 2025 & 2033
- Figure 20: South America Active Protection Systems Market Revenue (Million), by Export Market Analysis (Value & Volume) 2025 & 2033
- Figure 21: South America Active Protection Systems Market Revenue Share (%), by Export Market Analysis (Value & Volume) 2025 & 2033
- Figure 22: South America Active Protection Systems Market Revenue (Million), by Price Trend Analysis 2025 & 2033
- Figure 23: South America Active Protection Systems Market Revenue Share (%), by Price Trend Analysis 2025 & 2033
- Figure 24: South America Active Protection Systems Market Revenue (Million), by Country 2025 & 2033
- Figure 25: South America Active Protection Systems Market Revenue Share (%), by Country 2025 & 2033
- Figure 26: Europe Active Protection Systems Market Revenue (Million), by Production Analysis 2025 & 2033
- Figure 27: Europe Active Protection Systems Market Revenue Share (%), by Production Analysis 2025 & 2033
- Figure 28: Europe Active Protection Systems Market Revenue (Million), by Consumption Analysis 2025 & 2033
- Figure 29: Europe Active Protection Systems Market Revenue Share (%), by Consumption Analysis 2025 & 2033
- Figure 30: Europe Active Protection Systems Market Revenue (Million), by Import Market Analysis (Value & Volume) 2025 & 2033
- Figure 31: Europe Active Protection Systems Market Revenue Share (%), by Import Market Analysis (Value & Volume) 2025 & 2033
- Figure 32: Europe Active Protection Systems Market Revenue (Million), by Export Market Analysis (Value & Volume) 2025 & 2033
- Figure 33: Europe Active Protection Systems Market Revenue Share (%), by Export Market Analysis (Value & Volume) 2025 & 2033
- Figure 34: Europe Active Protection Systems Market Revenue (Million), by Price Trend Analysis 2025 & 2033
- Figure 35: Europe Active Protection Systems Market Revenue Share (%), by Price Trend Analysis 2025 & 2033
- Figure 36: Europe Active Protection Systems Market Revenue (Million), by Country 2025 & 2033
- Figure 37: Europe Active Protection Systems Market Revenue Share (%), by Country 2025 & 2033
- Figure 38: Middle East & Africa Active Protection Systems Market Revenue (Million), by Production Analysis 2025 & 2033
- Figure 39: Middle East & Africa Active Protection Systems Market Revenue Share (%), by Production Analysis 2025 & 2033
- Figure 40: Middle East & Africa Active Protection Systems Market Revenue (Million), by Consumption Analysis 2025 & 2033
- Figure 41: Middle East & Africa Active Protection Systems Market Revenue Share (%), by Consumption Analysis 2025 & 2033
- Figure 42: Middle East & Africa Active Protection Systems Market Revenue (Million), by Import Market Analysis (Value & Volume) 2025 & 2033
- Figure 43: Middle East & Africa Active Protection Systems Market Revenue Share (%), by Import Market Analysis (Value & Volume) 2025 & 2033
- Figure 44: Middle East & Africa Active Protection Systems Market Revenue (Million), by Export Market Analysis (Value & Volume) 2025 & 2033
- Figure 45: Middle East & Africa Active Protection Systems Market Revenue Share (%), by Export Market Analysis (Value & Volume) 2025 & 2033
- Figure 46: Middle East & Africa Active Protection Systems Market Revenue (Million), by Price Trend Analysis 2025 & 2033
- Figure 47: Middle East & Africa Active Protection Systems Market Revenue Share (%), by Price Trend Analysis 2025 & 2033
- Figure 48: Middle East & Africa Active Protection Systems Market Revenue (Million), by Country 2025 & 2033
- Figure 49: Middle East & Africa Active Protection Systems Market Revenue Share (%), by Country 2025 & 2033
- Figure 50: Asia Pacific Active Protection Systems Market Revenue (Million), by Production Analysis 2025 & 2033
- Figure 51: Asia Pacific Active Protection Systems Market Revenue Share (%), by Production Analysis 2025 & 2033
- Figure 52: Asia Pacific Active Protection Systems Market Revenue (Million), by Consumption Analysis 2025 & 2033
- Figure 53: Asia Pacific Active Protection Systems Market Revenue Share (%), by Consumption Analysis 2025 & 2033
- Figure 54: Asia Pacific Active Protection Systems Market Revenue (Million), by Import Market Analysis (Value & Volume) 2025 & 2033
- Figure 55: Asia Pacific Active Protection Systems Market Revenue Share (%), by Import Market Analysis (Value & Volume) 2025 & 2033
- Figure 56: Asia Pacific Active Protection Systems Market Revenue (Million), by Export Market Analysis (Value & Volume) 2025 & 2033
- Figure 57: Asia Pacific Active Protection Systems Market Revenue Share (%), by Export Market Analysis (Value & Volume) 2025 & 2033
- Figure 58: Asia Pacific Active Protection Systems Market Revenue (Million), by Price Trend Analysis 2025 & 2033
- Figure 59: Asia Pacific Active Protection Systems Market Revenue Share (%), by Price Trend Analysis 2025 & 2033
- Figure 60: Asia Pacific Active Protection Systems Market Revenue (Million), by Country 2025 & 2033
- Figure 61: Asia Pacific Active Protection Systems Market Revenue Share (%), by Country 2025 & 2033
List of Tables
- Table 1: Global Active Protection Systems Market Revenue Million Forecast, by Production Analysis 2020 & 2033
- Table 2: Global Active Protection Systems Market Revenue Million Forecast, by Consumption Analysis 2020 & 2033
- Table 3: Global Active Protection Systems Market Revenue Million Forecast, by Import Market Analysis (Value & Volume) 2020 & 2033
- Table 4: Global Active Protection Systems Market Revenue Million Forecast, by Export Market Analysis (Value & Volume) 2020 & 2033
- Table 5: Global Active Protection Systems Market Revenue Million Forecast, by Price Trend Analysis 2020 & 2033
- Table 6: Global Active Protection Systems Market Revenue Million Forecast, by Region 2020 & 2033
- Table 7: Global Active Protection Systems Market Revenue Million Forecast, by Production Analysis 2020 & 2033
- Table 8: Global Active Protection Systems Market Revenue Million Forecast, by Consumption Analysis 2020 & 2033
- Table 9: Global Active Protection Systems Market Revenue Million Forecast, by Import Market Analysis (Value & Volume) 2020 & 2033
- Table 10: Global Active Protection Systems Market Revenue Million Forecast, by Export Market Analysis (Value & Volume) 2020 & 2033
- Table 11: Global Active Protection Systems Market Revenue Million Forecast, by Price Trend Analysis 2020 & 2033
- Table 12: Global Active Protection Systems Market Revenue Million Forecast, by Country 2020 & 2033
- Table 13: United States Active Protection Systems Market Revenue (Million) Forecast, by Application 2020 & 2033
- Table 14: Canada Active Protection Systems Market Revenue (Million) Forecast, by Application 2020 & 2033
- Table 15: Mexico Active Protection Systems Market Revenue (Million) Forecast, by Application 2020 & 2033
- Table 16: Global Active Protection Systems Market Revenue Million Forecast, by Production Analysis 2020 & 2033
- Table 17: Global Active Protection Systems Market Revenue Million Forecast, by Consumption Analysis 2020 & 2033
- Table 18: Global Active Protection Systems Market Revenue Million Forecast, by Import Market Analysis (Value & Volume) 2020 & 2033
- Table 19: Global Active Protection Systems Market Revenue Million Forecast, by Export Market Analysis (Value & Volume) 2020 & 2033
- Table 20: Global Active Protection Systems Market Revenue Million Forecast, by Price Trend Analysis 2020 & 2033
- Table 21: Global Active Protection Systems Market Revenue Million Forecast, by Country 2020 & 2033
- Table 22: Brazil Active Protection Systems Market Revenue (Million) Forecast, by Application 2020 & 2033
- Table 23: Argentina Active Protection Systems Market Revenue (Million) Forecast, by Application 2020 & 2033
- Table 24: Rest of South America Active Protection Systems Market Revenue (Million) Forecast, by Application 2020 & 2033
- Table 25: Global Active Protection Systems Market Revenue Million Forecast, by Production Analysis 2020 & 2033
- Table 26: Global Active Protection Systems Market Revenue Million Forecast, by Consumption Analysis 2020 & 2033
- Table 27: Global Active Protection Systems Market Revenue Million Forecast, by Import Market Analysis (Value & Volume) 2020 & 2033
- Table 28: Global Active Protection Systems Market Revenue Million Forecast, by Export Market Analysis (Value & Volume) 2020 & 2033
- Table 29: Global Active Protection Systems Market Revenue Million Forecast, by Price Trend Analysis 2020 & 2033
- Table 30: Global Active Protection Systems Market Revenue Million Forecast, by Country 2020 & 2033
- Table 31: United Kingdom Active Protection Systems Market Revenue (Million) Forecast, by Application 2020 & 2033
- Table 32: Germany Active Protection Systems Market Revenue (Million) Forecast, by Application 2020 & 2033
- Table 33: France Active Protection Systems Market Revenue (Million) Forecast, by Application 2020 & 2033
- Table 34: Italy Active Protection Systems Market Revenue (Million) Forecast, by Application 2020 & 2033
- Table 35: Spain Active Protection Systems Market Revenue (Million) Forecast, by Application 2020 & 2033
- Table 36: Russia Active Protection Systems Market Revenue (Million) Forecast, by Application 2020 & 2033
- Table 37: Benelux Active Protection Systems Market Revenue (Million) Forecast, by Application 2020 & 2033
- Table 38: Nordics Active Protection Systems Market Revenue (Million) Forecast, by Application 2020 & 2033
- Table 39: Rest of Europe Active Protection Systems Market Revenue (Million) Forecast, by Application 2020 & 2033
- Table 40: Global Active Protection Systems Market Revenue Million Forecast, by Production Analysis 2020 & 2033
- Table 41: Global Active Protection Systems Market Revenue Million Forecast, by Consumption Analysis 2020 & 2033
- Table 42: Global Active Protection Systems Market Revenue Million Forecast, by Import Market Analysis (Value & Volume) 2020 & 2033
- Table 43: Global Active Protection Systems Market Revenue Million Forecast, by Export Market Analysis (Value & Volume) 2020 & 2033
- Table 44: Global Active Protection Systems Market Revenue Million Forecast, by Price Trend Analysis 2020 & 2033
- Table 45: Global Active Protection Systems Market Revenue Million Forecast, by Country 2020 & 2033
- Table 46: Turkey Active Protection Systems Market Revenue (Million) Forecast, by Application 2020 & 2033
- Table 47: Israel Active Protection Systems Market Revenue (Million) Forecast, by Application 2020 & 2033
- Table 48: GCC Active Protection Systems Market Revenue (Million) Forecast, by Application 2020 & 2033
- Table 49: North Africa Active Protection Systems Market Revenue (Million) Forecast, by Application 2020 & 2033
- Table 50: South Africa Active Protection Systems Market Revenue (Million) Forecast, by Application 2020 & 2033
- Table 51: Rest of Middle East & Africa Active Protection Systems Market Revenue (Million) Forecast, by Application 2020 & 2033
- Table 52: Global Active Protection Systems Market Revenue Million Forecast, by Production Analysis 2020 & 2033
- Table 53: Global Active Protection Systems Market Revenue Million Forecast, by Consumption Analysis 2020 & 2033
- Table 54: Global Active Protection Systems Market Revenue Million Forecast, by Import Market Analysis (Value & Volume) 2020 & 2033
- Table 55: Global Active Protection Systems Market Revenue Million Forecast, by Export Market Analysis (Value & Volume) 2020 & 2033
- Table 56: Global Active Protection Systems Market Revenue Million Forecast, by Price Trend Analysis 2020 & 2033
- Table 57: Global Active Protection Systems Market Revenue Million Forecast, by Country 2020 & 2033
- Table 58: China Active Protection Systems Market Revenue (Million) Forecast, by Application 2020 & 2033
- Table 59: India Active Protection Systems Market Revenue (Million) Forecast, by Application 2020 & 2033
- Table 60: Japan Active Protection Systems Market Revenue (Million) Forecast, by Application 2020 & 2033
- Table 61: South Korea Active Protection Systems Market Revenue (Million) Forecast, by Application 2020 & 2033
- Table 62: ASEAN Active Protection Systems Market Revenue (Million) Forecast, by Application 2020 & 2033
- Table 63: Oceania Active Protection Systems Market Revenue (Million) Forecast, by Application 2020 & 2033
- Table 64: Rest of Asia Pacific Active Protection Systems Market Revenue (Million) Forecast, by Application 2020 & 2033
Frequently Asked Questions
1. What is the projected Compound Annual Growth Rate (CAGR) of the Active Protection Systems Market?
The projected CAGR is approximately 6.06%.
2. Which companies are prominent players in the Active Protection Systems Market?
Key companies in the market include THALES, General Dynamics Corporation, Rheinmetall AG, Elbit Systems Ltd, Kongsberg Gruppen ASA, Rostec State Corporatio, Rafael Advanced Defense Systems Ltd, RTX Corporation, Artis, Leonardo S p A, BAE Systems plc, Saab AB, ASELSAN A Ş.
3. What are the main segments of the Active Protection Systems Market?
The market segments include Production Analysis, Consumption Analysis, Import Market Analysis (Value & Volume), Export Market Analysis (Value & Volume), Price Trend Analysis.
4. Can you provide details about the market size?
The market size is estimated to be USD 4.23 Million as of 2022.
5. What are some drivers contributing to market growth?
; Increasing Number Of Air Passengers; Use Of Portable Electronic Devices.
6. What are the notable trends driving market growth?
The Terrestrial Segment Holds Highest Shares in the Market.
7. Are there any restraints impacting market growth?
; High Cost Of Connectivity Equipments.
8. Can you provide examples of recent developments in the market?
N/A
9. What pricing options are available for accessing the report?
Pricing options include single-user, multi-user, and enterprise licenses priced at USD 4750, USD 5250, and USD 8750 respectively.
10. Is the market size provided in terms of value or volume?
The market size is provided in terms of value, measured in Million.
11. Are there any specific market keywords associated with the report?
Yes, the market keyword associated with the report is "Active Protection Systems Market," which aids in identifying and referencing the specific market segment covered.
12. How do I determine which pricing option suits my needs best?
The pricing options vary based on user requirements and access needs. Individual users may opt for single-user licenses, while businesses requiring broader access may choose multi-user or enterprise licenses for cost-effective access to the report.
13. Are there any additional resources or data provided in the Active Protection Systems Market report?
While the report offers comprehensive insights, it's advisable to review the specific contents or supplementary materials provided to ascertain if additional resources or data are available.
14. How can I stay updated on further developments or reports in the Active Protection Systems Market?
To stay informed about further developments, trends, and reports in the Active Protection Systems Market, consider subscribing to industry newsletters, following relevant companies and organizations, or regularly checking reputable industry news sources and publications.
Methodology
Step 1 - Identification of Relevant Samples Size from Population Database


Step 2 - Approaches for Defining Global Market Size (Value, Volume* & Price*)

Note*: In applicable scenarios
Step 3 - Data Sources
Primary Research
- Web Analytics
- Survey Reports
- Research Institute
- Latest Research Reports
- Opinion Leaders
Secondary Research
- Annual Reports
- White Paper
- Latest Press Release
- Industry Association
- Paid Database
- Investor Presentations

Step 4 - Data Triangulation
Involves using different sources of information in order to increase the validity of a study
These sources are likely to be stakeholders in a program - participants, other researchers, program staff, other community members, and so on.
Then we put all data in single framework & apply various statistical tools to find out the dynamic on the market.
During the analysis stage, feedback from the stakeholder groups would be compared to determine areas of agreement as well as areas of divergence