

Key Insights
The global multimedia desk market is projected for significant expansion, driven by the increasing integration of technology in workspaces and residences. With an estimated market size of $63.8 billion in 2025, the sector is anticipated to achieve a Compound Annual Growth Rate (CAGR) of 7.4% through 2033. This growth is propelled by the escalating demand for ergonomic and technologically advanced workstations supporting seamless device integration. The sustained adoption of remote and hybrid work models is amplifying the need for sophisticated home office setups, directly benefiting the multimedia desk market. Moreover, advancements in smart furniture and integrated solutions for commercial and educational environments are fostering new market opportunities. The inherent versatility and diverse aesthetic appeal of multimedia desks, catering to various design preferences, further support their widespread adoption.
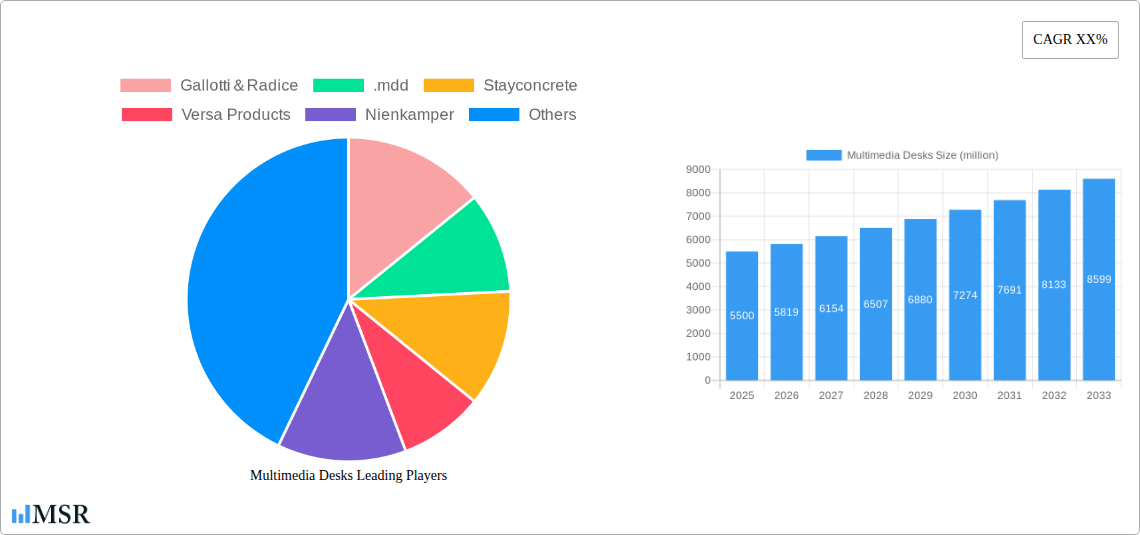
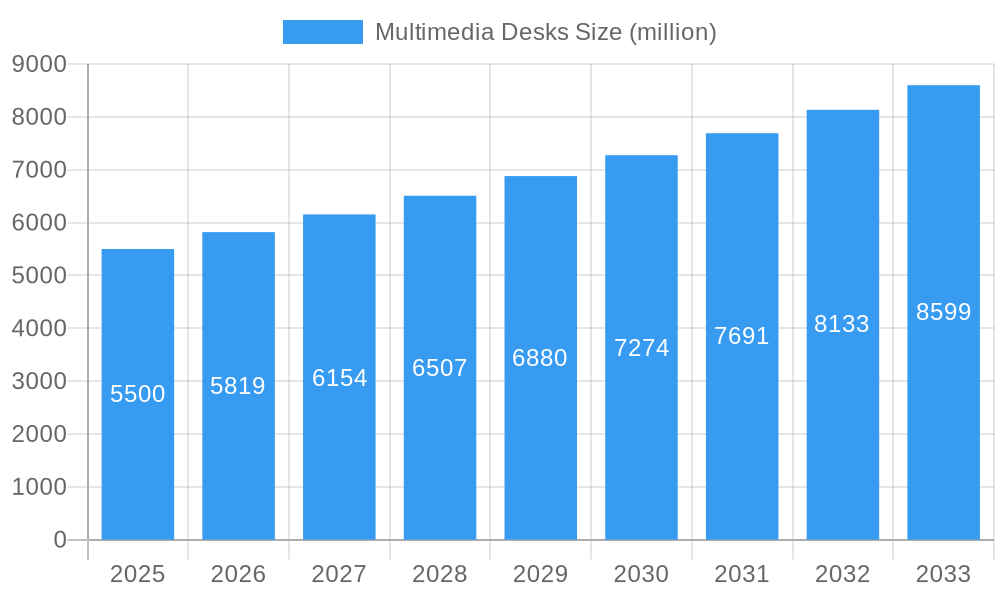
Multimedia Desks Market Size (In Billion)
Market segmentation indicates a strong preference for metal multimedia desks, owing to their durability and modern design, followed by wooden variants that offer a balance of style and utility. Residential and office applications are key growth drivers, reflecting the evolution of work and learning environments. While significant opportunities exist, potential challenges include the cost of advanced features and integrated electronics, which may impact adoption by price-sensitive consumers, and the rapid pace of technological obsolescence. However, ongoing innovation in smart furniture, including built-in charging, adjustable height features, and integrated cable management, is expected to mitigate these challenges, ensuring continued market dynamism and a positive outlook.
Multimedia Desks Company Market Share
Multimedia Desks Market Report: Unlocking Global Growth and Innovation (2019-2033)
Dive deep into the dynamic multimedia desks market with this comprehensive industry report. Covering the study period of 2019–2033, with a base year of 2025 and a forecast period of 2025–2033, this analysis provides unparalleled insights into market concentration, industry trends, key segments, product developments, challenges, growth drivers, emerging opportunities, leading players, and strategic outlook. Discover the forces shaping the global multimedia desks market, from technological advancements in metal multimedia desks and glass multimedia desks to evolving consumer preferences in residential and office applications. Understand the competitive landscape featuring giants like Gallotti&Radice, .mdd, Humanscale, and many more. This report is essential for furniture manufacturers, interior designers, architects, technology providers, and industry stakeholders seeking to capitalize on the burgeoning smart furniture market and ergonomic workspace solutions.
Multimedia Desks Market Concentration & Dynamics
The global multimedia desks market exhibits a moderate level of concentration, with a mix of established industry leaders and emerging innovative players. Market leaders are actively investing in research and development to integrate advanced technological features, driving innovation ecosystems. Regulatory frameworks, particularly concerning product safety and environmental sustainability for materials like plastic multimedia desks, are increasingly influencing market entry and product design. Substitute products, such as standard desks with add-on technology solutions, present a competitive challenge, necessitating a focus on integrated functionality and premium design. End-user trends are heavily skewed towards demand for ergonomic, space-saving, and technologically integrated solutions across office, residential, and school applications. Mergers and acquisitions (M&A) activities, while not at an extreme level, are strategically utilized by larger entities to acquire innovative technologies or expand market reach. For instance, the past historical period (2019-2024) saw approximately 15 significant M&A deals in the broader furniture and technology integration sector, indicating a growing consolidation trend. The overall market share of the top five players is estimated to be around 45% as of the base year 2025, with significant potential for growth for specialized and niche manufacturers.
Multimedia Desks Industry Insights & Trends
The multimedia desks market is poised for substantial growth, projected to reach a market size of approximately $25,000 million by 2033, with a compound annual growth rate (CAGR) of 6.5% during the forecast period (2025–2033). This expansion is fueled by a confluence of factors, including the increasing adoption of remote and hybrid work models, which necessitates optimized home office setups. Technological disruptions are a primary catalyst, with the integration of smart features like wireless charging, adjustable height mechanisms, built-in connectivity ports, and ambient lighting becoming standard expectations. The evolution of consumer behaviors emphasizes a demand for multi-functional furniture that seamlessly blends aesthetics with practicality. This includes a growing preference for wooden multimedia desks and glass multimedia desks that offer a sophisticated look while housing integrated technology. The post-pandemic era has accelerated the need for flexible and adaptable workspaces, driving innovation in modular desk designs. Furthermore, increasing awareness of ergonomics and employee well-being is pushing businesses to invest in advanced office furniture solutions, including smart desks that promote better posture and reduce physical strain. The school segment is also witnessing a surge in demand for interactive and technologically equipped desks to enhance digital learning experiences. The market size in 2025 is estimated to be around $15,500 million, underscoring the significant growth trajectory.
Key Markets & Segments Leading Multimedia Desks
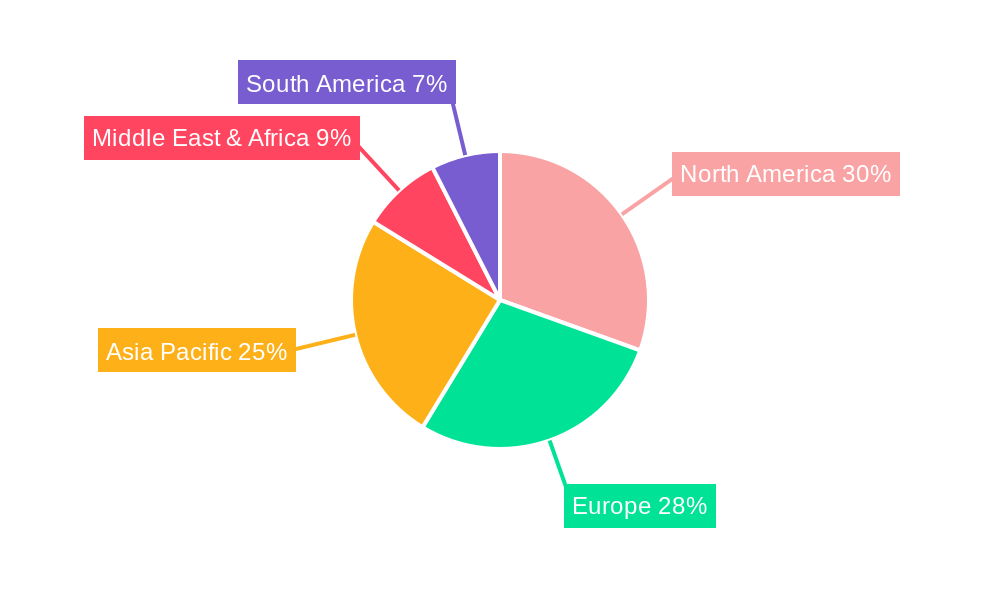
The global multimedia desks market is experiencing robust growth driven by specific regional demands and segment preferences. The Office application segment is a dominant force, projected to account for approximately 55% of the total market revenue by 2033. This dominance is attributed to the increasing corporate investment in creating modern, efficient, and technologically advanced workspaces to attract and retain talent, as well as to enhance productivity in hybrid work environments. Economic growth and infrastructure development in North America and Europe are key drivers in this segment.
Within the Types of multimedia desks, Metal Multimedia Desks are anticipated to lead, capturing an estimated market share of 35% by 2033. Their popularity stems from durability, modern aesthetics, and the ability to seamlessly integrate various technological components and cable management systems.
- Drivers for Office Dominance:
- Increased adoption of hybrid and remote work models.
- Corporate focus on employee well-being and productivity.
- Technological advancements in smart office solutions.
- Government incentives for modernizing workplaces.
- Demand for ergonomic and customizable furniture.
The Residential application segment is also a significant growth area, driven by the permanent shift towards home offices and the desire for integrated, stylish furniture solutions that complement home décor. The Wooden Multimedia Desks segment, known for its warmth, aesthetic appeal, and customization options, is expected to see a CAGR of 7.0% during the forecast period. The School segment, though smaller, presents a substantial growth opportunity as educational institutions globally are investing in technology-enhanced learning environments, leading to increased demand for interactive and durable multimedia desks. The Asia-Pacific region is emerging as a high-growth market due to rapid urbanization, rising disposable incomes, and a burgeoning IT sector driving demand for both office and residential multimedia desks.
Multimedia Desks Product Developments
Product innovation in the multimedia desks market is characterized by the seamless integration of technology and sophisticated design. Manufacturers are focusing on developing desks with built-in wireless charging pads, smart lighting systems controllable via mobile apps, integrated USB ports, and advanced cable management solutions. Ergonomic features such as electric height adjustability are becoming increasingly standard, catering to the growing emphasis on user well-being. The incorporation of durable and aesthetically pleasing materials like tempered glass and sustainable wood is also a key trend. These advancements are not only enhancing user experience but also providing a competitive edge for companies like .mdd and Humanscale, who are at the forefront of creating versatile and functional multimedia desks.
Challenges in the Multimedia Desks Market
The multimedia desks market faces several challenges that can impede its growth. High production costs associated with incorporating advanced technology can lead to premium pricing, limiting accessibility for a broader consumer base. Supply chain disruptions, as witnessed in the historical period (2019-2024), can impact material availability and delivery timelines, potentially leading to increased costs and delayed product launches. Intense competition from both established furniture brands and new tech-focused entrants necessitates continuous innovation and strategic pricing. Furthermore, evolving consumer preferences and the rapid pace of technological obsolescence require manufacturers to invest heavily in R&D to stay relevant. The estimated impact of supply chain volatility on the market in the near term is a potential 5-10% increase in production costs.
Forces Driving Multimedia Desks Growth
The multimedia desks market is propelled by powerful growth forces. The widespread adoption of remote and hybrid work arrangements globally is a primary driver, creating sustained demand for functional and technologically integrated home office solutions. Continuous technological advancements, including the miniaturization of components and the development of smarter integrated features like AI-powered desk adjustments, are enhancing product appeal and functionality. An increasing global focus on employee well-being and ergonomics is leading businesses and individuals to invest in furniture that promotes health and productivity. Economic development in emerging markets, coupled with rising disposable incomes, is also expanding the addressable market for premium multimedia desks.
Challenges in the Multimedia Desks Market
Long-term growth catalysts for the multimedia desks market lie in sustained innovation and strategic market expansion. The continuous integration of cutting-edge technologies, such as haptic feedback for ergonomic guidance or IoT capabilities for smart building integration, will further differentiate products. Strategic partnerships between furniture manufacturers and technology providers will be crucial in developing next-generation smart furniture solutions. Exploring untapped emerging markets and catering to diverse cultural preferences will also unlock new revenue streams. Furthermore, a focus on sustainability and eco-friendly materials will resonate with a growing environmentally conscious consumer base, driving long-term brand loyalty and market share.
Emerging Opportunities in Multimedia Desks
Emerging trends present significant opportunities within the multimedia desks market. The growing demand for personalized and modular furniture solutions that can adapt to evolving user needs and space constraints is a key trend. The integration of advanced health monitoring sensors and personalized wellness prompts within desks presents a lucrative opportunity in the health-tech furniture intersection. Furthermore, the expansion of e-commerce platforms and direct-to-consumer (DTC) sales models offers a direct channel to reach a wider customer base and gather valuable consumer feedback for product development. The rising popularity of smart home ecosystems also creates an opportunity for multimedia desks to become integral components of connected living spaces.
Leading Players in the Multimedia Desks Sector
- Gallotti&Radice
- .mdd
- Stayconcrete
- Versa Products
- Nienkamper
- Sedus Stoll
- GIORGETTI
- TEAM 7
- Martela
- DE LA ESPADA
- Humanscale
- Mobica+
Key Milestones in Multimedia Desks Industry
- 2019: Launch of integrated wireless charging solutions in premium office desks.
- 2020: Significant increase in demand for home office solutions due to the COVID-19 pandemic.
- 2021: Emergence of smart desks with AI-powered ergonomic adjustments.
- 2022: Increased focus on sustainable materials and eco-friendly manufacturing processes.
- 2023: Greater integration of connectivity features and smart home compatibility.
- 2024: Advancements in modular desk designs for enhanced flexibility.
- 2025 (Estimated): Widespread adoption of voice-activated desk controls.
Strategic Outlook for Multimedia Desks Market
The strategic outlook for the multimedia desks market is exceptionally promising, driven by a sustained demand for integrated technology, enhanced ergonomics, and flexible workspace solutions. Growth accelerators include continued investment in R&D for smart features, a focus on sustainable product development, and strategic expansion into emerging geographical markets. The increasing convergence of furniture and technology will create opportunities for innovative product lines that cater to both residential and commercial sectors. Manufacturers that prioritize user experience, design aesthetics, and technological integration are well-positioned to capture significant market share and drive long-term profitability in this dynamic industry. The forecast indicates a consistent upward trajectory, with substantial potential for market leaders to further consolidate their positions and for niche players to carve out significant market segments.
Multimedia Desks Segmentation
-
1. Application
- 1.1. Residential
- 1.2. Office
- 1.3. School
-
2. Types
- 2.1. Metal Multimedia Desks
- 2.2. Wooden Multimedia Desks
- 2.3. Glass Multimedia Desks
- 2.4. Plastic Multimedia Desks
Multimedia Desks Segmentation By Geography
-
1. North America
- 1.1. United States
- 1.2. Canada
- 1.3. Mexico
-
2. South America
- 2.1. Brazil
- 2.2. Argentina
- 2.3. Rest of South America
-
3. Europe
- 3.1. United Kingdom
- 3.2. Germany
- 3.3. France
- 3.4. Italy
- 3.5. Spain
- 3.6. Russia
- 3.7. Benelux
- 3.8. Nordics
- 3.9. Rest of Europe
-
4. Middle East & Africa
- 4.1. Turkey
- 4.2. Israel
- 4.3. GCC
- 4.4. North Africa
- 4.5. South Africa
- 4.6. Rest of Middle East & Africa
-
5. Asia Pacific
- 5.1. China
- 5.2. India
- 5.3. Japan
- 5.4. South Korea
- 5.5. ASEAN
- 5.6. Oceania
- 5.7. Rest of Asia Pacific
Multimedia Desks Regional Market Share
Geographic Coverage of Multimedia Desks
Multimedia Desks REPORT HIGHLIGHTS
| Aspects | Details |
|---|---|
| Study Period | 2020-2034 |
| Base Year | 2025 |
| Estimated Year | 2026 |
| Forecast Period | 2026-2034 |
| Historical Period | 2020-2025 |
| Growth Rate | CAGR of 7.4% from 2020-2034 |
| Segmentation |
|
Table of Contents
- 1. Introduction
- 1.1. Research Scope
- 1.2. Market Segmentation
- 1.3. Research Objective
- 1.4. Definitions and Assumptions
- 2. Executive Summary
- 2.1. Market Snapshot
- 3. Market Dynamics
- 3.1. Market Drivers
- 3.2. Market Restrains
- 3.3. Market Trends
- 3.4. Market Opportunities
- 4. Market Factor Analysis
- 4.1. Porters Five Forces
- 4.1.1. Bargaining Power of Suppliers
- 4.1.2. Bargaining Power of Buyers
- 4.1.3. Threat of New Entrants
- 4.1.4. Threat of Substitutes
- 4.1.5. Competitive Rivalry
- 4.2. PESTEL analysis
- 4.3. BCG Analysis
- 4.3.1. Stars (High Growth, High Market Share)
- 4.3.2. Cash Cows (Low Growth, High Market Share)
- 4.3.3. Question Mark (High Growth, Low Market Share)
- 4.3.4. Dogs (Low Growth, Low Market Share)
- 4.4. Ansoff Matrix Analysis
- 4.5. Supply Chain Analysis
- 4.6. Regulatory Landscape
- 4.7. Current Market Potential and Opportunity Assessment (TAM–SAM–SOM Framework)
- 4.8. MSR Analyst Note
- 4.1. Porters Five Forces
- 5. Market Analysis, Insights and Forecast 2021-2033
- 5.1. Market Analysis, Insights and Forecast - by Application
- 5.1.1. Residential
- 5.1.2. Office
- 5.1.3. School
- 5.2. Market Analysis, Insights and Forecast - by Types
- 5.2.1. Metal Multimedia Desks
- 5.2.2. Wooden Multimedia Desks
- 5.2.3. Glass Multimedia Desks
- 5.2.4. Plastic Multimedia Desks
- 5.3. Market Analysis, Insights and Forecast - by Region
- 5.3.1. North America
- 5.3.2. South America
- 5.3.3. Europe
- 5.3.4. Middle East & Africa
- 5.3.5. Asia Pacific
- 5.1. Market Analysis, Insights and Forecast - by Application
- 6. Global Multimedia Desks Analysis, Insights and Forecast, 2021-2033
- 6.1. Market Analysis, Insights and Forecast - by Application
- 6.1.1. Residential
- 6.1.2. Office
- 6.1.3. School
- 6.2. Market Analysis, Insights and Forecast - by Types
- 6.2.1. Metal Multimedia Desks
- 6.2.2. Wooden Multimedia Desks
- 6.2.3. Glass Multimedia Desks
- 6.2.4. Plastic Multimedia Desks
- 6.1. Market Analysis, Insights and Forecast - by Application
- 7. North America Multimedia Desks Analysis, Insights and Forecast, 2020-2032
- 7.1. Market Analysis, Insights and Forecast - by Application
- 7.1.1. Residential
- 7.1.2. Office
- 7.1.3. School
- 7.2. Market Analysis, Insights and Forecast - by Types
- 7.2.1. Metal Multimedia Desks
- 7.2.2. Wooden Multimedia Desks
- 7.2.3. Glass Multimedia Desks
- 7.2.4. Plastic Multimedia Desks
- 7.1. Market Analysis, Insights and Forecast - by Application
- 8. South America Multimedia Desks Analysis, Insights and Forecast, 2020-2032
- 8.1. Market Analysis, Insights and Forecast - by Application
- 8.1.1. Residential
- 8.1.2. Office
- 8.1.3. School
- 8.2. Market Analysis, Insights and Forecast - by Types
- 8.2.1. Metal Multimedia Desks
- 8.2.2. Wooden Multimedia Desks
- 8.2.3. Glass Multimedia Desks
- 8.2.4. Plastic Multimedia Desks
- 8.1. Market Analysis, Insights and Forecast - by Application
- 9. Europe Multimedia Desks Analysis, Insights and Forecast, 2020-2032
- 9.1. Market Analysis, Insights and Forecast - by Application
- 9.1.1. Residential
- 9.1.2. Office
- 9.1.3. School
- 9.2. Market Analysis, Insights and Forecast - by Types
- 9.2.1. Metal Multimedia Desks
- 9.2.2. Wooden Multimedia Desks
- 9.2.3. Glass Multimedia Desks
- 9.2.4. Plastic Multimedia Desks
- 9.1. Market Analysis, Insights and Forecast - by Application
- 10. Middle East & Africa Multimedia Desks Analysis, Insights and Forecast, 2020-2032
- 10.1. Market Analysis, Insights and Forecast - by Application
- 10.1.1. Residential
- 10.1.2. Office
- 10.1.3. School
- 10.2. Market Analysis, Insights and Forecast - by Types
- 10.2.1. Metal Multimedia Desks
- 10.2.2. Wooden Multimedia Desks
- 10.2.3. Glass Multimedia Desks
- 10.2.4. Plastic Multimedia Desks
- 10.1. Market Analysis, Insights and Forecast - by Application
- 11. Asia Pacific Multimedia Desks Analysis, Insights and Forecast, 2020-2032
- 11.1. Market Analysis, Insights and Forecast - by Application
- 11.1.1. Residential
- 11.1.2. Office
- 11.1.3. School
- 11.2. Market Analysis, Insights and Forecast - by Types
- 11.2.1. Metal Multimedia Desks
- 11.2.2. Wooden Multimedia Desks
- 11.2.3. Glass Multimedia Desks
- 11.2.4. Plastic Multimedia Desks
- 11.1. Market Analysis, Insights and Forecast - by Application
- 12. Competitive Analysis
- 12.1. Company Profiles
- 12.1.1 Gallotti&Radice
- 12.1.1.1. Company Overview
- 12.1.1.2. Products
- 12.1.1.3. Company Financials
- 12.1.1.4. SWOT Analysis
- 12.1.2 .mdd
- 12.1.2.1. Company Overview
- 12.1.2.2. Products
- 12.1.2.3. Company Financials
- 12.1.2.4. SWOT Analysis
- 12.1.3 Stayconcrete
- 12.1.3.1. Company Overview
- 12.1.3.2. Products
- 12.1.3.3. Company Financials
- 12.1.3.4. SWOT Analysis
- 12.1.4 Versa Products
- 12.1.4.1. Company Overview
- 12.1.4.2. Products
- 12.1.4.3. Company Financials
- 12.1.4.4. SWOT Analysis
- 12.1.5 Nienkamper
- 12.1.5.1. Company Overview
- 12.1.5.2. Products
- 12.1.5.3. Company Financials
- 12.1.5.4. SWOT Analysis
- 12.1.6 Sedus Stoll
- 12.1.6.1. Company Overview
- 12.1.6.2. Products
- 12.1.6.3. Company Financials
- 12.1.6.4. SWOT Analysis
- 12.1.7 GIORGETTI
- 12.1.7.1. Company Overview
- 12.1.7.2. Products
- 12.1.7.3. Company Financials
- 12.1.7.4. SWOT Analysis
- 12.1.8 TEAM 7
- 12.1.8.1. Company Overview
- 12.1.8.2. Products
- 12.1.8.3. Company Financials
- 12.1.8.4. SWOT Analysis
- 12.1.9 Martela
- 12.1.9.1. Company Overview
- 12.1.9.2. Products
- 12.1.9.3. Company Financials
- 12.1.9.4. SWOT Analysis
- 12.1.10 DE LA ESPADA
- 12.1.10.1. Company Overview
- 12.1.10.2. Products
- 12.1.10.3. Company Financials
- 12.1.10.4. SWOT Analysis
- 12.1.11 Humanscale
- 12.1.11.1. Company Overview
- 12.1.11.2. Products
- 12.1.11.3. Company Financials
- 12.1.11.4. SWOT Analysis
- 12.1.12 Mobica+
- 12.1.12.1. Company Overview
- 12.1.12.2. Products
- 12.1.12.3. Company Financials
- 12.1.12.4. SWOT Analysis
- 12.1.1 Gallotti&Radice
- 12.2. Market Entropy
- 12.2.1 Company's Key Areas Served
- 12.2.2 Recent Developments
- 12.3. Company Market Share Analysis 2025
- 12.3.1 Top 5 Companies Market Share Analysis
- 12.3.2 Top 3 Companies Market Share Analysis
- 12.4. List of Potential Customers
- 13. Research Methodology
List of Figures
- Figure 1: Global Multimedia Desks Revenue Breakdown (billion, %) by Region 2025 & 2033
- Figure 2: Global Multimedia Desks Volume Breakdown (K, %) by Region 2025 & 2033
- Figure 3: North America Multimedia Desks Revenue (billion), by Application 2025 & 2033
- Figure 4: North America Multimedia Desks Volume (K), by Application 2025 & 2033
- Figure 5: North America Multimedia Desks Revenue Share (%), by Application 2025 & 2033
- Figure 6: North America Multimedia Desks Volume Share (%), by Application 2025 & 2033
- Figure 7: North America Multimedia Desks Revenue (billion), by Types 2025 & 2033
- Figure 8: North America Multimedia Desks Volume (K), by Types 2025 & 2033
- Figure 9: North America Multimedia Desks Revenue Share (%), by Types 2025 & 2033
- Figure 10: North America Multimedia Desks Volume Share (%), by Types 2025 & 2033
- Figure 11: North America Multimedia Desks Revenue (billion), by Country 2025 & 2033
- Figure 12: North America Multimedia Desks Volume (K), by Country 2025 & 2033
- Figure 13: North America Multimedia Desks Revenue Share (%), by Country 2025 & 2033
- Figure 14: North America Multimedia Desks Volume Share (%), by Country 2025 & 2033
- Figure 15: South America Multimedia Desks Revenue (billion), by Application 2025 & 2033
- Figure 16: South America Multimedia Desks Volume (K), by Application 2025 & 2033
- Figure 17: South America Multimedia Desks Revenue Share (%), by Application 2025 & 2033
- Figure 18: South America Multimedia Desks Volume Share (%), by Application 2025 & 2033
- Figure 19: South America Multimedia Desks Revenue (billion), by Types 2025 & 2033
- Figure 20: South America Multimedia Desks Volume (K), by Types 2025 & 2033
- Figure 21: South America Multimedia Desks Revenue Share (%), by Types 2025 & 2033
- Figure 22: South America Multimedia Desks Volume Share (%), by Types 2025 & 2033
- Figure 23: South America Multimedia Desks Revenue (billion), by Country 2025 & 2033
- Figure 24: South America Multimedia Desks Volume (K), by Country 2025 & 2033
- Figure 25: South America Multimedia Desks Revenue Share (%), by Country 2025 & 2033
- Figure 26: South America Multimedia Desks Volume Share (%), by Country 2025 & 2033
- Figure 27: Europe Multimedia Desks Revenue (billion), by Application 2025 & 2033
- Figure 28: Europe Multimedia Desks Volume (K), by Application 2025 & 2033
- Figure 29: Europe Multimedia Desks Revenue Share (%), by Application 2025 & 2033
- Figure 30: Europe Multimedia Desks Volume Share (%), by Application 2025 & 2033
- Figure 31: Europe Multimedia Desks Revenue (billion), by Types 2025 & 2033
- Figure 32: Europe Multimedia Desks Volume (K), by Types 2025 & 2033
- Figure 33: Europe Multimedia Desks Revenue Share (%), by Types 2025 & 2033
- Figure 34: Europe Multimedia Desks Volume Share (%), by Types 2025 & 2033
- Figure 35: Europe Multimedia Desks Revenue (billion), by Country 2025 & 2033
- Figure 36: Europe Multimedia Desks Volume (K), by Country 2025 & 2033
- Figure 37: Europe Multimedia Desks Revenue Share (%), by Country 2025 & 2033
- Figure 38: Europe Multimedia Desks Volume Share (%), by Country 2025 & 2033
- Figure 39: Middle East & Africa Multimedia Desks Revenue (billion), by Application 2025 & 2033
- Figure 40: Middle East & Africa Multimedia Desks Volume (K), by Application 2025 & 2033
- Figure 41: Middle East & Africa Multimedia Desks Revenue Share (%), by Application 2025 & 2033
- Figure 42: Middle East & Africa Multimedia Desks Volume Share (%), by Application 2025 & 2033
- Figure 43: Middle East & Africa Multimedia Desks Revenue (billion), by Types 2025 & 2033
- Figure 44: Middle East & Africa Multimedia Desks Volume (K), by Types 2025 & 2033
- Figure 45: Middle East & Africa Multimedia Desks Revenue Share (%), by Types 2025 & 2033
- Figure 46: Middle East & Africa Multimedia Desks Volume Share (%), by Types 2025 & 2033
- Figure 47: Middle East & Africa Multimedia Desks Revenue (billion), by Country 2025 & 2033
- Figure 48: Middle East & Africa Multimedia Desks Volume (K), by Country 2025 & 2033
- Figure 49: Middle East & Africa Multimedia Desks Revenue Share (%), by Country 2025 & 2033
- Figure 50: Middle East & Africa Multimedia Desks Volume Share (%), by Country 2025 & 2033
- Figure 51: Asia Pacific Multimedia Desks Revenue (billion), by Application 2025 & 2033
- Figure 52: Asia Pacific Multimedia Desks Volume (K), by Application 2025 & 2033
- Figure 53: Asia Pacific Multimedia Desks Revenue Share (%), by Application 2025 & 2033
- Figure 54: Asia Pacific Multimedia Desks Volume Share (%), by Application 2025 & 2033
- Figure 55: Asia Pacific Multimedia Desks Revenue (billion), by Types 2025 & 2033
- Figure 56: Asia Pacific Multimedia Desks Volume (K), by Types 2025 & 2033
- Figure 57: Asia Pacific Multimedia Desks Revenue Share (%), by Types 2025 & 2033
- Figure 58: Asia Pacific Multimedia Desks Volume Share (%), by Types 2025 & 2033
- Figure 59: Asia Pacific Multimedia Desks Revenue (billion), by Country 2025 & 2033
- Figure 60: Asia Pacific Multimedia Desks Volume (K), by Country 2025 & 2033
- Figure 61: Asia Pacific Multimedia Desks Revenue Share (%), by Country 2025 & 2033
- Figure 62: Asia Pacific Multimedia Desks Volume Share (%), by Country 2025 & 2033
List of Tables
- Table 1: Global Multimedia Desks Revenue billion Forecast, by Application 2020 & 2033
- Table 2: Global Multimedia Desks Volume K Forecast, by Application 2020 & 2033
- Table 3: Global Multimedia Desks Revenue billion Forecast, by Types 2020 & 2033
- Table 4: Global Multimedia Desks Volume K Forecast, by Types 2020 & 2033
- Table 5: Global Multimedia Desks Revenue billion Forecast, by Region 2020 & 2033
- Table 6: Global Multimedia Desks Volume K Forecast, by Region 2020 & 2033
- Table 7: Global Multimedia Desks Revenue billion Forecast, by Application 2020 & 2033
- Table 8: Global Multimedia Desks Volume K Forecast, by Application 2020 & 2033
- Table 9: Global Multimedia Desks Revenue billion Forecast, by Types 2020 & 2033
- Table 10: Global Multimedia Desks Volume K Forecast, by Types 2020 & 2033
- Table 11: Global Multimedia Desks Revenue billion Forecast, by Country 2020 & 2033
- Table 12: Global Multimedia Desks Volume K Forecast, by Country 2020 & 2033
- Table 13: United States Multimedia Desks Revenue (billion) Forecast, by Application 2020 & 2033
- Table 14: United States Multimedia Desks Volume (K) Forecast, by Application 2020 & 2033
- Table 15: Canada Multimedia Desks Revenue (billion) Forecast, by Application 2020 & 2033
- Table 16: Canada Multimedia Desks Volume (K) Forecast, by Application 2020 & 2033
- Table 17: Mexico Multimedia Desks Revenue (billion) Forecast, by Application 2020 & 2033
- Table 18: Mexico Multimedia Desks Volume (K) Forecast, by Application 2020 & 2033
- Table 19: Global Multimedia Desks Revenue billion Forecast, by Application 2020 & 2033
- Table 20: Global Multimedia Desks Volume K Forecast, by Application 2020 & 2033
- Table 21: Global Multimedia Desks Revenue billion Forecast, by Types 2020 & 2033
- Table 22: Global Multimedia Desks Volume K Forecast, by Types 2020 & 2033
- Table 23: Global Multimedia Desks Revenue billion Forecast, by Country 2020 & 2033
- Table 24: Global Multimedia Desks Volume K Forecast, by Country 2020 & 2033
- Table 25: Brazil Multimedia Desks Revenue (billion) Forecast, by Application 2020 & 2033
- Table 26: Brazil Multimedia Desks Volume (K) Forecast, by Application 2020 & 2033
- Table 27: Argentina Multimedia Desks Revenue (billion) Forecast, by Application 2020 & 2033
- Table 28: Argentina Multimedia Desks Volume (K) Forecast, by Application 2020 & 2033
- Table 29: Rest of South America Multimedia Desks Revenue (billion) Forecast, by Application 2020 & 2033
- Table 30: Rest of South America Multimedia Desks Volume (K) Forecast, by Application 2020 & 2033
- Table 31: Global Multimedia Desks Revenue billion Forecast, by Application 2020 & 2033
- Table 32: Global Multimedia Desks Volume K Forecast, by Application 2020 & 2033
- Table 33: Global Multimedia Desks Revenue billion Forecast, by Types 2020 & 2033
- Table 34: Global Multimedia Desks Volume K Forecast, by Types 2020 & 2033
- Table 35: Global Multimedia Desks Revenue billion Forecast, by Country 2020 & 2033
- Table 36: Global Multimedia Desks Volume K Forecast, by Country 2020 & 2033
- Table 37: United Kingdom Multimedia Desks Revenue (billion) Forecast, by Application 2020 & 2033
- Table 38: United Kingdom Multimedia Desks Volume (K) Forecast, by Application 2020 & 2033
- Table 39: Germany Multimedia Desks Revenue (billion) Forecast, by Application 2020 & 2033
- Table 40: Germany Multimedia Desks Volume (K) Forecast, by Application 2020 & 2033
- Table 41: France Multimedia Desks Revenue (billion) Forecast, by Application 2020 & 2033
- Table 42: France Multimedia Desks Volume (K) Forecast, by Application 2020 & 2033
- Table 43: Italy Multimedia Desks Revenue (billion) Forecast, by Application 2020 & 2033
- Table 44: Italy Multimedia Desks Volume (K) Forecast, by Application 2020 & 2033
- Table 45: Spain Multimedia Desks Revenue (billion) Forecast, by Application 2020 & 2033
- Table 46: Spain Multimedia Desks Volume (K) Forecast, by Application 2020 & 2033
- Table 47: Russia Multimedia Desks Revenue (billion) Forecast, by Application 2020 & 2033
- Table 48: Russia Multimedia Desks Volume (K) Forecast, by Application 2020 & 2033
- Table 49: Benelux Multimedia Desks Revenue (billion) Forecast, by Application 2020 & 2033
- Table 50: Benelux Multimedia Desks Volume (K) Forecast, by Application 2020 & 2033
- Table 51: Nordics Multimedia Desks Revenue (billion) Forecast, by Application 2020 & 2033
- Table 52: Nordics Multimedia Desks Volume (K) Forecast, by Application 2020 & 2033
- Table 53: Rest of Europe Multimedia Desks Revenue (billion) Forecast, by Application 2020 & 2033
- Table 54: Rest of Europe Multimedia Desks Volume (K) Forecast, by Application 2020 & 2033
- Table 55: Global Multimedia Desks Revenue billion Forecast, by Application 2020 & 2033
- Table 56: Global Multimedia Desks Volume K Forecast, by Application 2020 & 2033
- Table 57: Global Multimedia Desks Revenue billion Forecast, by Types 2020 & 2033
- Table 58: Global Multimedia Desks Volume K Forecast, by Types 2020 & 2033
- Table 59: Global Multimedia Desks Revenue billion Forecast, by Country 2020 & 2033
- Table 60: Global Multimedia Desks Volume K Forecast, by Country 2020 & 2033
- Table 61: Turkey Multimedia Desks Revenue (billion) Forecast, by Application 2020 & 2033
- Table 62: Turkey Multimedia Desks Volume (K) Forecast, by Application 2020 & 2033
- Table 63: Israel Multimedia Desks Revenue (billion) Forecast, by Application 2020 & 2033
- Table 64: Israel Multimedia Desks Volume (K) Forecast, by Application 2020 & 2033
- Table 65: GCC Multimedia Desks Revenue (billion) Forecast, by Application 2020 & 2033
- Table 66: GCC Multimedia Desks Volume (K) Forecast, by Application 2020 & 2033
- Table 67: North Africa Multimedia Desks Revenue (billion) Forecast, by Application 2020 & 2033
- Table 68: North Africa Multimedia Desks Volume (K) Forecast, by Application 2020 & 2033
- Table 69: South Africa Multimedia Desks Revenue (billion) Forecast, by Application 2020 & 2033
- Table 70: South Africa Multimedia Desks Volume (K) Forecast, by Application 2020 & 2033
- Table 71: Rest of Middle East & Africa Multimedia Desks Revenue (billion) Forecast, by Application 2020 & 2033
- Table 72: Rest of Middle East & Africa Multimedia Desks Volume (K) Forecast, by Application 2020 & 2033
- Table 73: Global Multimedia Desks Revenue billion Forecast, by Application 2020 & 2033
- Table 74: Global Multimedia Desks Volume K Forecast, by Application 2020 & 2033
- Table 75: Global Multimedia Desks Revenue billion Forecast, by Types 2020 & 2033
- Table 76: Global Multimedia Desks Volume K Forecast, by Types 2020 & 2033
- Table 77: Global Multimedia Desks Revenue billion Forecast, by Country 2020 & 2033
- Table 78: Global Multimedia Desks Volume K Forecast, by Country 2020 & 2033
- Table 79: China Multimedia Desks Revenue (billion) Forecast, by Application 2020 & 2033
- Table 80: China Multimedia Desks Volume (K) Forecast, by Application 2020 & 2033
- Table 81: India Multimedia Desks Revenue (billion) Forecast, by Application 2020 & 2033
- Table 82: India Multimedia Desks Volume (K) Forecast, by Application 2020 & 2033
- Table 83: Japan Multimedia Desks Revenue (billion) Forecast, by Application 2020 & 2033
- Table 84: Japan Multimedia Desks Volume (K) Forecast, by Application 2020 & 2033
- Table 85: South Korea Multimedia Desks Revenue (billion) Forecast, by Application 2020 & 2033
- Table 86: South Korea Multimedia Desks Volume (K) Forecast, by Application 2020 & 2033
- Table 87: ASEAN Multimedia Desks Revenue (billion) Forecast, by Application 2020 & 2033
- Table 88: ASEAN Multimedia Desks Volume (K) Forecast, by Application 2020 & 2033
- Table 89: Oceania Multimedia Desks Revenue (billion) Forecast, by Application 2020 & 2033
- Table 90: Oceania Multimedia Desks Volume (K) Forecast, by Application 2020 & 2033
- Table 91: Rest of Asia Pacific Multimedia Desks Revenue (billion) Forecast, by Application 2020 & 2033
- Table 92: Rest of Asia Pacific Multimedia Desks Volume (K) Forecast, by Application 2020 & 2033
Frequently Asked Questions
1. What is the projected Compound Annual Growth Rate (CAGR) of the Multimedia Desks?
The projected CAGR is approximately 7.4%.
2. Which companies are prominent players in the Multimedia Desks?
Key companies in the market include Gallotti&Radice, .mdd, Stayconcrete, Versa Products, Nienkamper, Sedus Stoll, GIORGETTI, TEAM 7, Martela, DE LA ESPADA, Humanscale, Mobica+.
3. What are the main segments of the Multimedia Desks?
The market segments include Application, Types.
4. Can you provide details about the market size?
The market size is estimated to be USD 63.8 billion as of 2022.
5. What are some drivers contributing to market growth?
N/A
6. What are the notable trends driving market growth?
N/A
7. Are there any restraints impacting market growth?
N/A
8. Can you provide examples of recent developments in the market?
N/A
9. What pricing options are available for accessing the report?
Pricing options include single-user, multi-user, and enterprise licenses priced at USD 3950.00, USD 5925.00, and USD 7900.00 respectively.
10. Is the market size provided in terms of value or volume?
The market size is provided in terms of value, measured in billion and volume, measured in K.
11. Are there any specific market keywords associated with the report?
Yes, the market keyword associated with the report is "Multimedia Desks," which aids in identifying and referencing the specific market segment covered.
12. How do I determine which pricing option suits my needs best?
The pricing options vary based on user requirements and access needs. Individual users may opt for single-user licenses, while businesses requiring broader access may choose multi-user or enterprise licenses for cost-effective access to the report.
13. Are there any additional resources or data provided in the Multimedia Desks report?
While the report offers comprehensive insights, it's advisable to review the specific contents or supplementary materials provided to ascertain if additional resources or data are available.
14. How can I stay updated on further developments or reports in the Multimedia Desks?
To stay informed about further developments, trends, and reports in the Multimedia Desks, consider subscribing to industry newsletters, following relevant companies and organizations, or regularly checking reputable industry news sources and publications.
Methodology
Step 1 - Identification of Relevant Samples Size from Population Database


Step 2 - Approaches for Defining Global Market Size (Value, Volume* & Price*)

Note*: In applicable scenarios
Step 3 - Data Sources
Primary Research
- Web Analytics
- Survey Reports
- Research Institute
- Latest Research Reports
- Opinion Leaders
Secondary Research
- Annual Reports
- White Paper
- Latest Press Release
- Industry Association
- Paid Database
- Investor Presentations

Step 4 - Data Triangulation
Involves using different sources of information in order to increase the validity of a study
These sources are likely to be stakeholders in a program - participants, other researchers, program staff, other community members, and so on.
Then we put all data in single framework & apply various statistical tools to find out the dynamic on the market.
During the analysis stage, feedback from the stakeholder groups would be compared to determine areas of agreement as well as areas of divergence