

Key Insights
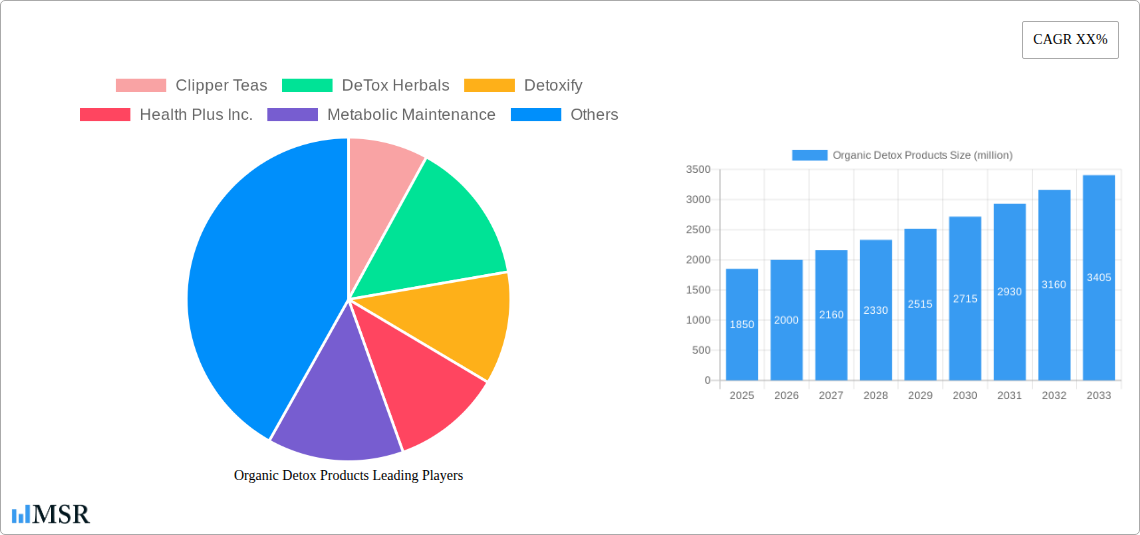
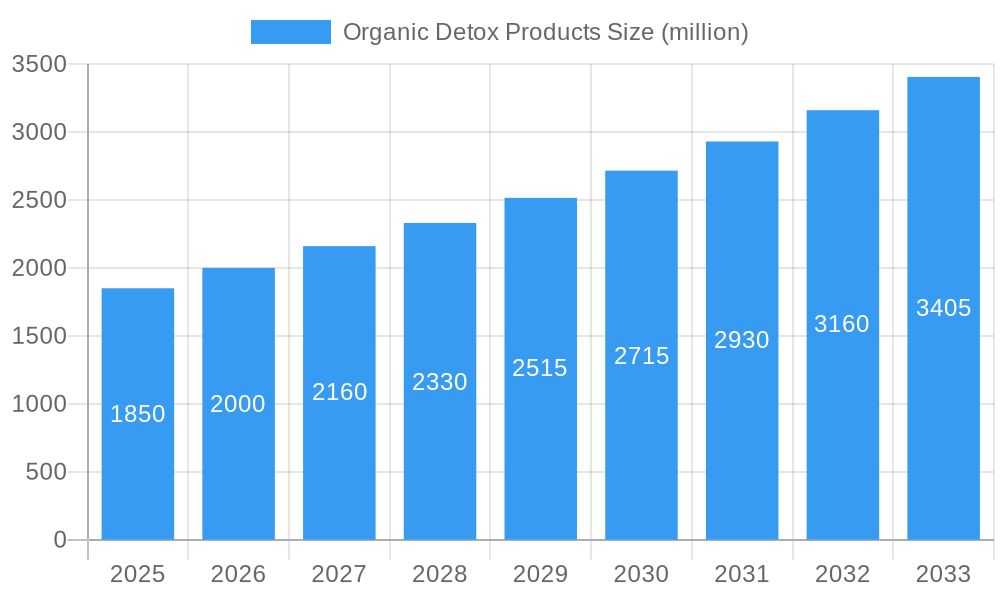
The global Organic Detox Products market is projected to reach an estimated $40.7 billion by 2025, demonstrating significant growth driven by increasing consumer focus on health and wellness. Demand for natural and organic alternatives to conventional health solutions is rising. The market is expected to grow at a Compound Annual Growth Rate (CAGR) of 5.9% from 2025 to 2033, fueled by heightened awareness of detoxification benefits for overall well-being, including improved digestion, energy levels, and skin health. Consumers are actively seeking products that support natural bodily cleansing, leading to greater adoption of organic detox teas, supplements, and specialized formulations. Enhanced e-commerce accessibility and expanding distribution networks further contribute to market expansion.
Organic Detox Products Market Size (In Billion)
Key drivers for the organic detox products market include the rising prevalence of lifestyle-related health issues and a proactive approach to preventive healthcare. Consumers are investing in healthier lifestyles, with detox products playing a crucial role. Demand for specific product types, such as Detox Herbal Products, is strong due to their natural ingredients and perceived gentler detoxification approach. Restraints include higher pricing for organic products and potential consumer skepticism regarding efficacy. However, ongoing research, development, and increased transparency in product labeling and ingredient sourcing are building consumer trust. Market segmentation highlights significant contributions from hypermarkets/supermarkets and e-commerce platforms, reflecting evolving consumer purchasing behaviors.
Organic Detox Products Company Market Share
This report offers a detailed analysis of the global organic detox products market, providing critical insights for industry stakeholders, investors, and decision-makers. Analyzing the historical period (2019–2024), base year (2025), and forecast period (to 2033), this analysis utilizes advanced methodologies for actionable intelligence. Explore the intricate dynamics, growth trajectories, and untapped potential within this rapidly evolving sector. With a projected market size exceeding $40.7 billion and a robust CAGR of 5.9%, this report is essential for navigating the future of organic wellness.
Organic Detox Products Market Concentration & Dynamics
The organic detox products market exhibits a dynamic and evolving concentration landscape, characterized by a growing number of innovative entrants challenging established players. The innovation ecosystem is flourishing, driven by increasing consumer demand for natural and sustainable wellness solutions. Key companies such as Thorne, The Himalaya Drug Company, and Teami LLC are actively investing in research and development, fostering a competitive environment. Regulatory frameworks, while generally supportive of natural product claims, can present varying hurdles across different geographies. Substitute products, including conventional detox regimens and DIY remedies, offer a degree of competition, but the distinct appeal of certified organic ingredients continues to drive segment growth. End-user trends highlight a strong preference for transparency, ethical sourcing, and scientifically validated efficacy. Merger and acquisition (M&A) activities are anticipated to increase as larger corporations seek to capture market share and integrate innovative organic offerings into their portfolios. Over the historical period, we observed approximately XX significant M&A deals, signaling a trend towards consolidation. The market share of key players like NINI Organics Limited and Okoko Cosmetiques has seen steady growth, reflecting their strong brand presence and product quality.
Organic Detox Products Industry Insights & Trends
The organic detox products industry is poised for significant expansion, fueled by a confluence of potent growth drivers and transformative trends. The overarching market size is projected to reach a staggering $20,000 million by 2033, demonstrating a compound annual growth rate (CAGR) of XX% over the forecast period. A primary market growth driver is the escalating global awareness surrounding the detrimental effects of environmental toxins and processed foods on human health. Consumers are increasingly proactively seeking natural and organic solutions to support their body’s natural detoxification processes, leading to a surge in demand for detox herbal products. Technological disruptions are also playing a pivotal role. Advances in extraction techniques, sustainable sourcing methodologies, and advanced formulation science are enabling the development of more potent and effective organic detox products. For instance, the incorporation of novel herbal blends and the development of sophisticated delivery systems are enhancing bioavailability and consumer experience. Evolving consumer behaviors are central to this market's trajectory. There's a discernible shift towards holistic wellness, with consumers viewing detox products not merely as temporary fixes but as integral components of a long-term healthy lifestyle. This includes a growing emphasis on preventative healthcare, mindful consumption, and a preference for brands that align with their ethical and environmental values. Furthermore, the rise of e-commerce platforms has democratized access to a wider range of organic detox products, enabling smaller brands to reach a global audience and fostering greater competition and innovation. The increasing availability of organic certifications and the growing trust in these labels further bolster consumer confidence in the efficacy and safety of these products. The health and wellness sector, in general, is experiencing unprecedented growth, and the organic detox segment is a significant beneficiary of this broader trend. The appeal extends across various demographics, driven by a shared aspiration for improved vitality and well-being.
Key Markets & Segments Leading Organic Detox Products
The organic detox products market showcases distinct regional and segment leadership, driven by a combination of economic prosperity, robust healthcare infrastructure, and evolving consumer preferences. E-commerce Websites have emerged as a dominant distribution channel, offering unparalleled convenience and access to a wide array of detox herbal products and detox pharmaceuticals products. This channel's dominance is propelled by increasing internet penetration, the proliferation of online marketplaces, and a growing consumer inclination towards digital shopping. For example, platforms like Amazon and specialized wellness e-tailers facilitate global reach for brands such as Teami LLC and DeTox Herbals.
- Drivers for E-commerce Dominance:
- Convenience and Accessibility: Consumers can shop anytime, anywhere, with doorstep delivery.
- Wider Product Selection: Access to a broader range of brands and product types than typically found in brick-and-mortar stores.
- Competitive Pricing and Promotions: Online platforms often feature competitive pricing and exclusive deals.
- Informed Purchasing Decisions: Rich product descriptions, customer reviews, and expert content empower consumers.
In terms of product type, Detox Herbal Products are currently leading the market, accounting for an estimated XX% of the total market share. This leadership is attributed to consumer preference for natural ingredients, the perceived gentleness of herbal remedies, and their long-standing traditional use. Companies like Clipper Teas and Health Plus Inc. have built strong portfolios in this segment.
- Drivers for Detox Herbal Products Dominance:
- Consumer Trust in Natural Ingredients: A widespread belief in the efficacy and safety of plant-based solutions.
- Growing Demand for Holistic Wellness: Herbal detox aligns with a broader interest in natural approaches to health.
- Traditional and Cultural Acceptance: Long-standing use of herbs for purification and well-being.
- Perceived Lower Risk of Side Effects: Compared to synthetic alternatives, herbal options are often viewed as milder.
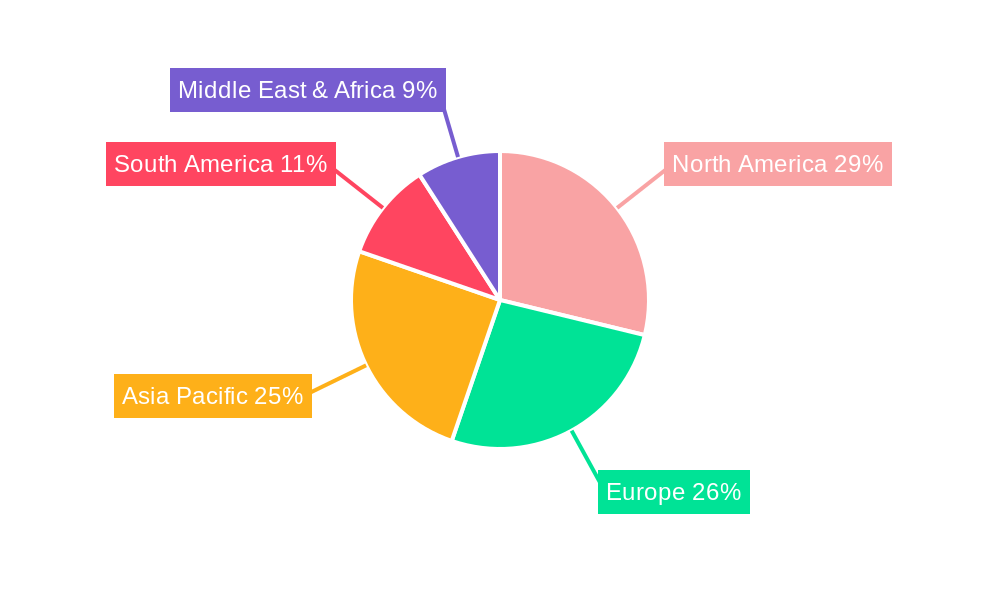
Geographically, North America and Europe represent the largest markets due to high disposable incomes, advanced healthcare systems, and a well-established wellness culture. However, the Asia-Pacific region is exhibiting the fastest growth rate, driven by increasing health consciousness and a burgeoning middle class. The dominance of Specialty Stores and Drug Stores as traditional retail channels continues, particularly for consumers seeking personalized advice and immediate availability, though their market share is gradually being influenced by the e-commerce surge. Hypermarket/Supermarkets also play a role, offering convenience and bulk purchasing options for popular organic detox items.
Organic Detox Products Product Developments
Product innovation in the organic detox products market is intensely focused on enhancing efficacy, bioavailability, and user experience through advanced formulations and sustainable sourcing. Companies are developing novel detox herbal products that combine potent botanical extracts with synergistic ingredients, such as probiotics and prebiotics, to support gut health alongside detoxification. Technological advancements in encapsulation and extraction are yielding more concentrated and faster-acting formulations. The market relevance is amplified by a growing consumer desire for convenient, ready-to-consume detox solutions, leading to the introduction of specialized detox teas, powders, and shot formulations. Competitive advantages are being forged through unique ingredient profiles, certified organic status, and transparent ingredient sourcing, ensuring both product quality and consumer trust.
Challenges in the Organic Detox Products Market
The organic detox products market faces several key challenges that can impact growth and profitability. Regulatory scrutiny over health claims associated with detox products can be stringent and vary significantly across regions, potentially limiting marketing efforts and product development. Supply chain complexities for sourcing premium organic ingredients, coupled with potential disruptions, can lead to increased costs and stockouts. Intense competition from both established brands and new market entrants, including a growing number of direct-to-consumer offerings, also poses a significant hurdle. Furthermore, the ongoing need for consumer education regarding the benefits and appropriate use of detox products is crucial to overcome skepticism and ensure responsible consumption.
Forces Driving Organic Detox Products Growth
Several powerful forces are propelling the organic detox products market forward. A fundamental driver is the escalating consumer awareness of environmental toxins and their impact on overall health, fostering a proactive approach to wellness. The increasing demand for natural and plant-based alternatives to conventional health solutions further fuels this growth. Technological advancements in extraction and formulation science are enabling the creation of more effective and bioavailable organic detox products. Economic factors, including rising disposable incomes in emerging economies and a growing middle class with greater purchasing power, are also contributing significantly. Finally, supportive government initiatives and a generally favorable regulatory environment for organic products create a conducive landscape for expansion.
Challenges in the Organic Detox Products Market
Long-term growth catalysts within the organic detox products market are deeply rooted in continuous innovation and strategic market expansion. The development of sophisticated product lines that address specific wellness concerns, such as gut health or immune support, will foster sustained consumer interest. Furthermore, strategic partnerships with healthcare professionals, wellness influencers, and complementary businesses can broaden reach and build credibility. Market expansion into underpenetrated regions, coupled with the localization of product offerings to meet diverse cultural needs, presents substantial growth potential. The unwavering commitment to sustainable sourcing and ethical manufacturing practices will also resonate with an increasingly conscious consumer base, solidifying brand loyalty.
Emerging Opportunities in Organic Detox Products
Emerging opportunities in the organic detox products market are characterized by untapped consumer needs and novel technological applications. The growing demand for personalized detox solutions, tailored to individual dietary needs and health goals, presents a significant avenue for growth through data-driven product development. Innovations in functional ingredients, such as adaptogens and specialized probiotics, are creating new product categories within the detox space. The burgeoning interest in preventative health and holistic wellness creates a fertile ground for integrated detox programs and subscription-based models. Furthermore, the exploration of emerging markets in Asia and Latin America, with their rapidly growing middle classes and increasing health consciousness, offers substantial untapped potential for market penetration and revenue generation.
Leading Players in the Organic Detox Products Sector
- Clipper Teas
- DeTox Herbals
- Detoxify
- Health Plus Inc.
- Metabolic Maintenance
- NINI Organics Limited
- Okoko Cosmetiques
- Teami LLC
- The Himalaya Drug Company
- Thorne
Key Milestones in Organic Detox Products Industry
- 2019: Increased consumer adoption of at-home wellness routines, driving demand for convenient detox solutions.
- 2020: Heightened global focus on immune health and detoxification due to the pandemic, boosting market interest.
- 2021: Rise in e-commerce sales of organic health products, expanding reach for niche brands.
- 2022: Greater emphasis on sustainable sourcing and eco-friendly packaging in product development.
- 2023: Introduction of specialized detox formulations targeting specific health concerns like gut health.
- 2024: Growing trend of integrating detox products into broader wellness and fitness regimes.
Strategic Outlook for Organic Detox Products Market
The strategic outlook for the organic detox products market is exceptionally promising, characterized by continuous innovation and expanding market penetration. Key growth accelerators include the development of advanced formulations that cater to increasingly sophisticated consumer demands for efficacy and convenience. Strategic partnerships with wellness influencers and healthcare professionals will be crucial for building trust and expanding consumer education. Market expansion into underserved regions, coupled with a sustained focus on ethical sourcing and transparent manufacturing, will solidify competitive advantages. The increasing integration of detox products into comprehensive wellness programs and subscription models also represents a significant avenue for long-term revenue growth and market leadership.
Organic Detox Products Segmentation
-
1. Application
- 1.1. Specialty Stores
- 1.2. Drug Stores
- 1.3. Hypermarket/Supermarket
- 1.4. E-commerce Websites
-
2. Types
- 2.1. Detox Herbal Products
- 2.2. Detox Pharmaceuticals Products
Organic Detox Products Segmentation By Geography
-
1. North America
- 1.1. United States
- 1.2. Canada
- 1.3. Mexico
-
2. South America
- 2.1. Brazil
- 2.2. Argentina
- 2.3. Rest of South America
-
3. Europe
- 3.1. United Kingdom
- 3.2. Germany
- 3.3. France
- 3.4. Italy
- 3.5. Spain
- 3.6. Russia
- 3.7. Benelux
- 3.8. Nordics
- 3.9. Rest of Europe
-
4. Middle East & Africa
- 4.1. Turkey
- 4.2. Israel
- 4.3. GCC
- 4.4. North Africa
- 4.5. South Africa
- 4.6. Rest of Middle East & Africa
-
5. Asia Pacific
- 5.1. China
- 5.2. India
- 5.3. Japan
- 5.4. South Korea
- 5.5. ASEAN
- 5.6. Oceania
- 5.7. Rest of Asia Pacific
Organic Detox Products Regional Market Share
Geographic Coverage of Organic Detox Products
Organic Detox Products REPORT HIGHLIGHTS
| Aspects | Details |
|---|---|
| Study Period | 2020-2034 |
| Base Year | 2025 |
| Estimated Year | 2026 |
| Forecast Period | 2026-2034 |
| Historical Period | 2020-2025 |
| Growth Rate | CAGR of 5.9% from 2020-2034 |
| Segmentation |
|
Table of Contents
- 1. Introduction
- 1.1. Research Scope
- 1.2. Market Segmentation
- 1.3. Research Objective
- 1.4. Definitions and Assumptions
- 2. Executive Summary
- 2.1. Market Snapshot
- 3. Market Dynamics
- 3.1. Market Drivers
- 3.2. Market Restrains
- 3.3. Market Trends
- 3.4. Market Opportunities
- 4. Market Factor Analysis
- 4.1. Porters Five Forces
- 4.1.1. Bargaining Power of Suppliers
- 4.1.2. Bargaining Power of Buyers
- 4.1.3. Threat of New Entrants
- 4.1.4. Threat of Substitutes
- 4.1.5. Competitive Rivalry
- 4.2. PESTEL analysis
- 4.3. BCG Analysis
- 4.3.1. Stars (High Growth, High Market Share)
- 4.3.2. Cash Cows (Low Growth, High Market Share)
- 4.3.3. Question Mark (High Growth, Low Market Share)
- 4.3.4. Dogs (Low Growth, Low Market Share)
- 4.4. Ansoff Matrix Analysis
- 4.5. Supply Chain Analysis
- 4.6. Regulatory Landscape
- 4.7. Current Market Potential and Opportunity Assessment (TAM–SAM–SOM Framework)
- 4.8. MSR Analyst Note
- 4.1. Porters Five Forces
- 5. Market Analysis, Insights and Forecast 2021-2033
- 5.1. Market Analysis, Insights and Forecast - by Application
- 5.1.1. Specialty Stores
- 5.1.2. Drug Stores
- 5.1.3. Hypermarket/Supermarket
- 5.1.4. E-commerce Websites
- 5.2. Market Analysis, Insights and Forecast - by Types
- 5.2.1. Detox Herbal Products
- 5.2.2. Detox Pharmaceuticals Products
- 5.3. Market Analysis, Insights and Forecast - by Region
- 5.3.1. North America
- 5.3.2. South America
- 5.3.3. Europe
- 5.3.4. Middle East & Africa
- 5.3.5. Asia Pacific
- 5.1. Market Analysis, Insights and Forecast - by Application
- 6. Global Organic Detox Products Analysis, Insights and Forecast, 2021-2033
- 6.1. Market Analysis, Insights and Forecast - by Application
- 6.1.1. Specialty Stores
- 6.1.2. Drug Stores
- 6.1.3. Hypermarket/Supermarket
- 6.1.4. E-commerce Websites
- 6.2. Market Analysis, Insights and Forecast - by Types
- 6.2.1. Detox Herbal Products
- 6.2.2. Detox Pharmaceuticals Products
- 6.1. Market Analysis, Insights and Forecast - by Application
- 7. North America Organic Detox Products Analysis, Insights and Forecast, 2020-2032
- 7.1. Market Analysis, Insights and Forecast - by Application
- 7.1.1. Specialty Stores
- 7.1.2. Drug Stores
- 7.1.3. Hypermarket/Supermarket
- 7.1.4. E-commerce Websites
- 7.2. Market Analysis, Insights and Forecast - by Types
- 7.2.1. Detox Herbal Products
- 7.2.2. Detox Pharmaceuticals Products
- 7.1. Market Analysis, Insights and Forecast - by Application
- 8. South America Organic Detox Products Analysis, Insights and Forecast, 2020-2032
- 8.1. Market Analysis, Insights and Forecast - by Application
- 8.1.1. Specialty Stores
- 8.1.2. Drug Stores
- 8.1.3. Hypermarket/Supermarket
- 8.1.4. E-commerce Websites
- 8.2. Market Analysis, Insights and Forecast - by Types
- 8.2.1. Detox Herbal Products
- 8.2.2. Detox Pharmaceuticals Products
- 8.1. Market Analysis, Insights and Forecast - by Application
- 9. Europe Organic Detox Products Analysis, Insights and Forecast, 2020-2032
- 9.1. Market Analysis, Insights and Forecast - by Application
- 9.1.1. Specialty Stores
- 9.1.2. Drug Stores
- 9.1.3. Hypermarket/Supermarket
- 9.1.4. E-commerce Websites
- 9.2. Market Analysis, Insights and Forecast - by Types
- 9.2.1. Detox Herbal Products
- 9.2.2. Detox Pharmaceuticals Products
- 9.1. Market Analysis, Insights and Forecast - by Application
- 10. Middle East & Africa Organic Detox Products Analysis, Insights and Forecast, 2020-2032
- 10.1. Market Analysis, Insights and Forecast - by Application
- 10.1.1. Specialty Stores
- 10.1.2. Drug Stores
- 10.1.3. Hypermarket/Supermarket
- 10.1.4. E-commerce Websites
- 10.2. Market Analysis, Insights and Forecast - by Types
- 10.2.1. Detox Herbal Products
- 10.2.2. Detox Pharmaceuticals Products
- 10.1. Market Analysis, Insights and Forecast - by Application
- 11. Asia Pacific Organic Detox Products Analysis, Insights and Forecast, 2020-2032
- 11.1. Market Analysis, Insights and Forecast - by Application
- 11.1.1. Specialty Stores
- 11.1.2. Drug Stores
- 11.1.3. Hypermarket/Supermarket
- 11.1.4. E-commerce Websites
- 11.2. Market Analysis, Insights and Forecast - by Types
- 11.2.1. Detox Herbal Products
- 11.2.2. Detox Pharmaceuticals Products
- 11.1. Market Analysis, Insights and Forecast - by Application
- 12. Competitive Analysis
- 12.1. Company Profiles
- 12.1.1 Clipper Teas
- 12.1.1.1. Company Overview
- 12.1.1.2. Products
- 12.1.1.3. Company Financials
- 12.1.1.4. SWOT Analysis
- 12.1.2 DeTox Herbals
- 12.1.2.1. Company Overview
- 12.1.2.2. Products
- 12.1.2.3. Company Financials
- 12.1.2.4. SWOT Analysis
- 12.1.3 Detoxify
- 12.1.3.1. Company Overview
- 12.1.3.2. Products
- 12.1.3.3. Company Financials
- 12.1.3.4. SWOT Analysis
- 12.1.4 Health Plus Inc.
- 12.1.4.1. Company Overview
- 12.1.4.2. Products
- 12.1.4.3. Company Financials
- 12.1.4.4. SWOT Analysis
- 12.1.5 Metabolic Maintenance
- 12.1.5.1. Company Overview
- 12.1.5.2. Products
- 12.1.5.3. Company Financials
- 12.1.5.4. SWOT Analysis
- 12.1.6 NINI Organics Limited
- 12.1.6.1. Company Overview
- 12.1.6.2. Products
- 12.1.6.3. Company Financials
- 12.1.6.4. SWOT Analysis
- 12.1.7 Okoko Cosmetiques
- 12.1.7.1. Company Overview
- 12.1.7.2. Products
- 12.1.7.3. Company Financials
- 12.1.7.4. SWOT Analysis
- 12.1.8 Teami LLC
- 12.1.8.1. Company Overview
- 12.1.8.2. Products
- 12.1.8.3. Company Financials
- 12.1.8.4. SWOT Analysis
- 12.1.9 The Himalaya Drug Company
- 12.1.9.1. Company Overview
- 12.1.9.2. Products
- 12.1.9.3. Company Financials
- 12.1.9.4. SWOT Analysis
- 12.1.10 Thorne
- 12.1.10.1. Company Overview
- 12.1.10.2. Products
- 12.1.10.3. Company Financials
- 12.1.10.4. SWOT Analysis
- 12.1.1 Clipper Teas
- 12.2. Market Entropy
- 12.2.1 Company's Key Areas Served
- 12.2.2 Recent Developments
- 12.3. Company Market Share Analysis 2025
- 12.3.1 Top 5 Companies Market Share Analysis
- 12.3.2 Top 3 Companies Market Share Analysis
- 12.4. List of Potential Customers
- 13. Research Methodology
List of Figures
- Figure 1: Global Organic Detox Products Revenue Breakdown (billion, %) by Region 2025 & 2033
- Figure 2: Global Organic Detox Products Volume Breakdown (K, %) by Region 2025 & 2033
- Figure 3: North America Organic Detox Products Revenue (billion), by Application 2025 & 2033
- Figure 4: North America Organic Detox Products Volume (K), by Application 2025 & 2033
- Figure 5: North America Organic Detox Products Revenue Share (%), by Application 2025 & 2033
- Figure 6: North America Organic Detox Products Volume Share (%), by Application 2025 & 2033
- Figure 7: North America Organic Detox Products Revenue (billion), by Types 2025 & 2033
- Figure 8: North America Organic Detox Products Volume (K), by Types 2025 & 2033
- Figure 9: North America Organic Detox Products Revenue Share (%), by Types 2025 & 2033
- Figure 10: North America Organic Detox Products Volume Share (%), by Types 2025 & 2033
- Figure 11: North America Organic Detox Products Revenue (billion), by Country 2025 & 2033
- Figure 12: North America Organic Detox Products Volume (K), by Country 2025 & 2033
- Figure 13: North America Organic Detox Products Revenue Share (%), by Country 2025 & 2033
- Figure 14: North America Organic Detox Products Volume Share (%), by Country 2025 & 2033
- Figure 15: South America Organic Detox Products Revenue (billion), by Application 2025 & 2033
- Figure 16: South America Organic Detox Products Volume (K), by Application 2025 & 2033
- Figure 17: South America Organic Detox Products Revenue Share (%), by Application 2025 & 2033
- Figure 18: South America Organic Detox Products Volume Share (%), by Application 2025 & 2033
- Figure 19: South America Organic Detox Products Revenue (billion), by Types 2025 & 2033
- Figure 20: South America Organic Detox Products Volume (K), by Types 2025 & 2033
- Figure 21: South America Organic Detox Products Revenue Share (%), by Types 2025 & 2033
- Figure 22: South America Organic Detox Products Volume Share (%), by Types 2025 & 2033
- Figure 23: South America Organic Detox Products Revenue (billion), by Country 2025 & 2033
- Figure 24: South America Organic Detox Products Volume (K), by Country 2025 & 2033
- Figure 25: South America Organic Detox Products Revenue Share (%), by Country 2025 & 2033
- Figure 26: South America Organic Detox Products Volume Share (%), by Country 2025 & 2033
- Figure 27: Europe Organic Detox Products Revenue (billion), by Application 2025 & 2033
- Figure 28: Europe Organic Detox Products Volume (K), by Application 2025 & 2033
- Figure 29: Europe Organic Detox Products Revenue Share (%), by Application 2025 & 2033
- Figure 30: Europe Organic Detox Products Volume Share (%), by Application 2025 & 2033
- Figure 31: Europe Organic Detox Products Revenue (billion), by Types 2025 & 2033
- Figure 32: Europe Organic Detox Products Volume (K), by Types 2025 & 2033
- Figure 33: Europe Organic Detox Products Revenue Share (%), by Types 2025 & 2033
- Figure 34: Europe Organic Detox Products Volume Share (%), by Types 2025 & 2033
- Figure 35: Europe Organic Detox Products Revenue (billion), by Country 2025 & 2033
- Figure 36: Europe Organic Detox Products Volume (K), by Country 2025 & 2033
- Figure 37: Europe Organic Detox Products Revenue Share (%), by Country 2025 & 2033
- Figure 38: Europe Organic Detox Products Volume Share (%), by Country 2025 & 2033
- Figure 39: Middle East & Africa Organic Detox Products Revenue (billion), by Application 2025 & 2033
- Figure 40: Middle East & Africa Organic Detox Products Volume (K), by Application 2025 & 2033
- Figure 41: Middle East & Africa Organic Detox Products Revenue Share (%), by Application 2025 & 2033
- Figure 42: Middle East & Africa Organic Detox Products Volume Share (%), by Application 2025 & 2033
- Figure 43: Middle East & Africa Organic Detox Products Revenue (billion), by Types 2025 & 2033
- Figure 44: Middle East & Africa Organic Detox Products Volume (K), by Types 2025 & 2033
- Figure 45: Middle East & Africa Organic Detox Products Revenue Share (%), by Types 2025 & 2033
- Figure 46: Middle East & Africa Organic Detox Products Volume Share (%), by Types 2025 & 2033
- Figure 47: Middle East & Africa Organic Detox Products Revenue (billion), by Country 2025 & 2033
- Figure 48: Middle East & Africa Organic Detox Products Volume (K), by Country 2025 & 2033
- Figure 49: Middle East & Africa Organic Detox Products Revenue Share (%), by Country 2025 & 2033
- Figure 50: Middle East & Africa Organic Detox Products Volume Share (%), by Country 2025 & 2033
- Figure 51: Asia Pacific Organic Detox Products Revenue (billion), by Application 2025 & 2033
- Figure 52: Asia Pacific Organic Detox Products Volume (K), by Application 2025 & 2033
- Figure 53: Asia Pacific Organic Detox Products Revenue Share (%), by Application 2025 & 2033
- Figure 54: Asia Pacific Organic Detox Products Volume Share (%), by Application 2025 & 2033
- Figure 55: Asia Pacific Organic Detox Products Revenue (billion), by Types 2025 & 2033
- Figure 56: Asia Pacific Organic Detox Products Volume (K), by Types 2025 & 2033
- Figure 57: Asia Pacific Organic Detox Products Revenue Share (%), by Types 2025 & 2033
- Figure 58: Asia Pacific Organic Detox Products Volume Share (%), by Types 2025 & 2033
- Figure 59: Asia Pacific Organic Detox Products Revenue (billion), by Country 2025 & 2033
- Figure 60: Asia Pacific Organic Detox Products Volume (K), by Country 2025 & 2033
- Figure 61: Asia Pacific Organic Detox Products Revenue Share (%), by Country 2025 & 2033
- Figure 62: Asia Pacific Organic Detox Products Volume Share (%), by Country 2025 & 2033
List of Tables
- Table 1: Global Organic Detox Products Revenue billion Forecast, by Application 2020 & 2033
- Table 2: Global Organic Detox Products Volume K Forecast, by Application 2020 & 2033
- Table 3: Global Organic Detox Products Revenue billion Forecast, by Types 2020 & 2033
- Table 4: Global Organic Detox Products Volume K Forecast, by Types 2020 & 2033
- Table 5: Global Organic Detox Products Revenue billion Forecast, by Region 2020 & 2033
- Table 6: Global Organic Detox Products Volume K Forecast, by Region 2020 & 2033
- Table 7: Global Organic Detox Products Revenue billion Forecast, by Application 2020 & 2033
- Table 8: Global Organic Detox Products Volume K Forecast, by Application 2020 & 2033
- Table 9: Global Organic Detox Products Revenue billion Forecast, by Types 2020 & 2033
- Table 10: Global Organic Detox Products Volume K Forecast, by Types 2020 & 2033
- Table 11: Global Organic Detox Products Revenue billion Forecast, by Country 2020 & 2033
- Table 12: Global Organic Detox Products Volume K Forecast, by Country 2020 & 2033
- Table 13: United States Organic Detox Products Revenue (billion) Forecast, by Application 2020 & 2033
- Table 14: United States Organic Detox Products Volume (K) Forecast, by Application 2020 & 2033
- Table 15: Canada Organic Detox Products Revenue (billion) Forecast, by Application 2020 & 2033
- Table 16: Canada Organic Detox Products Volume (K) Forecast, by Application 2020 & 2033
- Table 17: Mexico Organic Detox Products Revenue (billion) Forecast, by Application 2020 & 2033
- Table 18: Mexico Organic Detox Products Volume (K) Forecast, by Application 2020 & 2033
- Table 19: Global Organic Detox Products Revenue billion Forecast, by Application 2020 & 2033
- Table 20: Global Organic Detox Products Volume K Forecast, by Application 2020 & 2033
- Table 21: Global Organic Detox Products Revenue billion Forecast, by Types 2020 & 2033
- Table 22: Global Organic Detox Products Volume K Forecast, by Types 2020 & 2033
- Table 23: Global Organic Detox Products Revenue billion Forecast, by Country 2020 & 2033
- Table 24: Global Organic Detox Products Volume K Forecast, by Country 2020 & 2033
- Table 25: Brazil Organic Detox Products Revenue (billion) Forecast, by Application 2020 & 2033
- Table 26: Brazil Organic Detox Products Volume (K) Forecast, by Application 2020 & 2033
- Table 27: Argentina Organic Detox Products Revenue (billion) Forecast, by Application 2020 & 2033
- Table 28: Argentina Organic Detox Products Volume (K) Forecast, by Application 2020 & 2033
- Table 29: Rest of South America Organic Detox Products Revenue (billion) Forecast, by Application 2020 & 2033
- Table 30: Rest of South America Organic Detox Products Volume (K) Forecast, by Application 2020 & 2033
- Table 31: Global Organic Detox Products Revenue billion Forecast, by Application 2020 & 2033
- Table 32: Global Organic Detox Products Volume K Forecast, by Application 2020 & 2033
- Table 33: Global Organic Detox Products Revenue billion Forecast, by Types 2020 & 2033
- Table 34: Global Organic Detox Products Volume K Forecast, by Types 2020 & 2033
- Table 35: Global Organic Detox Products Revenue billion Forecast, by Country 2020 & 2033
- Table 36: Global Organic Detox Products Volume K Forecast, by Country 2020 & 2033
- Table 37: United Kingdom Organic Detox Products Revenue (billion) Forecast, by Application 2020 & 2033
- Table 38: United Kingdom Organic Detox Products Volume (K) Forecast, by Application 2020 & 2033
- Table 39: Germany Organic Detox Products Revenue (billion) Forecast, by Application 2020 & 2033
- Table 40: Germany Organic Detox Products Volume (K) Forecast, by Application 2020 & 2033
- Table 41: France Organic Detox Products Revenue (billion) Forecast, by Application 2020 & 2033
- Table 42: France Organic Detox Products Volume (K) Forecast, by Application 2020 & 2033
- Table 43: Italy Organic Detox Products Revenue (billion) Forecast, by Application 2020 & 2033
- Table 44: Italy Organic Detox Products Volume (K) Forecast, by Application 2020 & 2033
- Table 45: Spain Organic Detox Products Revenue (billion) Forecast, by Application 2020 & 2033
- Table 46: Spain Organic Detox Products Volume (K) Forecast, by Application 2020 & 2033
- Table 47: Russia Organic Detox Products Revenue (billion) Forecast, by Application 2020 & 2033
- Table 48: Russia Organic Detox Products Volume (K) Forecast, by Application 2020 & 2033
- Table 49: Benelux Organic Detox Products Revenue (billion) Forecast, by Application 2020 & 2033
- Table 50: Benelux Organic Detox Products Volume (K) Forecast, by Application 2020 & 2033
- Table 51: Nordics Organic Detox Products Revenue (billion) Forecast, by Application 2020 & 2033
- Table 52: Nordics Organic Detox Products Volume (K) Forecast, by Application 2020 & 2033
- Table 53: Rest of Europe Organic Detox Products Revenue (billion) Forecast, by Application 2020 & 2033
- Table 54: Rest of Europe Organic Detox Products Volume (K) Forecast, by Application 2020 & 2033
- Table 55: Global Organic Detox Products Revenue billion Forecast, by Application 2020 & 2033
- Table 56: Global Organic Detox Products Volume K Forecast, by Application 2020 & 2033
- Table 57: Global Organic Detox Products Revenue billion Forecast, by Types 2020 & 2033
- Table 58: Global Organic Detox Products Volume K Forecast, by Types 2020 & 2033
- Table 59: Global Organic Detox Products Revenue billion Forecast, by Country 2020 & 2033
- Table 60: Global Organic Detox Products Volume K Forecast, by Country 2020 & 2033
- Table 61: Turkey Organic Detox Products Revenue (billion) Forecast, by Application 2020 & 2033
- Table 62: Turkey Organic Detox Products Volume (K) Forecast, by Application 2020 & 2033
- Table 63: Israel Organic Detox Products Revenue (billion) Forecast, by Application 2020 & 2033
- Table 64: Israel Organic Detox Products Volume (K) Forecast, by Application 2020 & 2033
- Table 65: GCC Organic Detox Products Revenue (billion) Forecast, by Application 2020 & 2033
- Table 66: GCC Organic Detox Products Volume (K) Forecast, by Application 2020 & 2033
- Table 67: North Africa Organic Detox Products Revenue (billion) Forecast, by Application 2020 & 2033
- Table 68: North Africa Organic Detox Products Volume (K) Forecast, by Application 2020 & 2033
- Table 69: South Africa Organic Detox Products Revenue (billion) Forecast, by Application 2020 & 2033
- Table 70: South Africa Organic Detox Products Volume (K) Forecast, by Application 2020 & 2033
- Table 71: Rest of Middle East & Africa Organic Detox Products Revenue (billion) Forecast, by Application 2020 & 2033
- Table 72: Rest of Middle East & Africa Organic Detox Products Volume (K) Forecast, by Application 2020 & 2033
- Table 73: Global Organic Detox Products Revenue billion Forecast, by Application 2020 & 2033
- Table 74: Global Organic Detox Products Volume K Forecast, by Application 2020 & 2033
- Table 75: Global Organic Detox Products Revenue billion Forecast, by Types 2020 & 2033
- Table 76: Global Organic Detox Products Volume K Forecast, by Types 2020 & 2033
- Table 77: Global Organic Detox Products Revenue billion Forecast, by Country 2020 & 2033
- Table 78: Global Organic Detox Products Volume K Forecast, by Country 2020 & 2033
- Table 79: China Organic Detox Products Revenue (billion) Forecast, by Application 2020 & 2033
- Table 80: China Organic Detox Products Volume (K) Forecast, by Application 2020 & 2033
- Table 81: India Organic Detox Products Revenue (billion) Forecast, by Application 2020 & 2033
- Table 82: India Organic Detox Products Volume (K) Forecast, by Application 2020 & 2033
- Table 83: Japan Organic Detox Products Revenue (billion) Forecast, by Application 2020 & 2033
- Table 84: Japan Organic Detox Products Volume (K) Forecast, by Application 2020 & 2033
- Table 85: South Korea Organic Detox Products Revenue (billion) Forecast, by Application 2020 & 2033
- Table 86: South Korea Organic Detox Products Volume (K) Forecast, by Application 2020 & 2033
- Table 87: ASEAN Organic Detox Products Revenue (billion) Forecast, by Application 2020 & 2033
- Table 88: ASEAN Organic Detox Products Volume (K) Forecast, by Application 2020 & 2033
- Table 89: Oceania Organic Detox Products Revenue (billion) Forecast, by Application 2020 & 2033
- Table 90: Oceania Organic Detox Products Volume (K) Forecast, by Application 2020 & 2033
- Table 91: Rest of Asia Pacific Organic Detox Products Revenue (billion) Forecast, by Application 2020 & 2033
- Table 92: Rest of Asia Pacific Organic Detox Products Volume (K) Forecast, by Application 2020 & 2033
Frequently Asked Questions
1. What is the projected Compound Annual Growth Rate (CAGR) of the Organic Detox Products?
The projected CAGR is approximately 5.9%.
2. Which companies are prominent players in the Organic Detox Products?
Key companies in the market include Clipper Teas, DeTox Herbals, Detoxify, Health Plus Inc., Metabolic Maintenance, NINI Organics Limited, Okoko Cosmetiques, Teami LLC, The Himalaya Drug Company, Thorne.
3. What are the main segments of the Organic Detox Products?
The market segments include Application, Types.
4. Can you provide details about the market size?
The market size is estimated to be USD 40.7 billion as of 2022.
5. What are some drivers contributing to market growth?
N/A
6. What are the notable trends driving market growth?
N/A
7. Are there any restraints impacting market growth?
N/A
8. Can you provide examples of recent developments in the market?
N/A
9. What pricing options are available for accessing the report?
Pricing options include single-user, multi-user, and enterprise licenses priced at USD 3950.00, USD 5925.00, and USD 7900.00 respectively.
10. Is the market size provided in terms of value or volume?
The market size is provided in terms of value, measured in billion and volume, measured in K.
11. Are there any specific market keywords associated with the report?
Yes, the market keyword associated with the report is "Organic Detox Products," which aids in identifying and referencing the specific market segment covered.
12. How do I determine which pricing option suits my needs best?
The pricing options vary based on user requirements and access needs. Individual users may opt for single-user licenses, while businesses requiring broader access may choose multi-user or enterprise licenses for cost-effective access to the report.
13. Are there any additional resources or data provided in the Organic Detox Products report?
While the report offers comprehensive insights, it's advisable to review the specific contents or supplementary materials provided to ascertain if additional resources or data are available.
14. How can I stay updated on further developments or reports in the Organic Detox Products?
To stay informed about further developments, trends, and reports in the Organic Detox Products, consider subscribing to industry newsletters, following relevant companies and organizations, or regularly checking reputable industry news sources and publications.
Methodology
Step 1 - Identification of Relevant Samples Size from Population Database


Step 2 - Approaches for Defining Global Market Size (Value, Volume* & Price*)

Note*: In applicable scenarios
Step 3 - Data Sources
Primary Research
- Web Analytics
- Survey Reports
- Research Institute
- Latest Research Reports
- Opinion Leaders
Secondary Research
- Annual Reports
- White Paper
- Latest Press Release
- Industry Association
- Paid Database
- Investor Presentations

Step 4 - Data Triangulation
Involves using different sources of information in order to increase the validity of a study
These sources are likely to be stakeholders in a program - participants, other researchers, program staff, other community members, and so on.
Then we put all data in single framework & apply various statistical tools to find out the dynamic on the market.
During the analysis stage, feedback from the stakeholder groups would be compared to determine areas of agreement as well as areas of divergence