

Key Insights
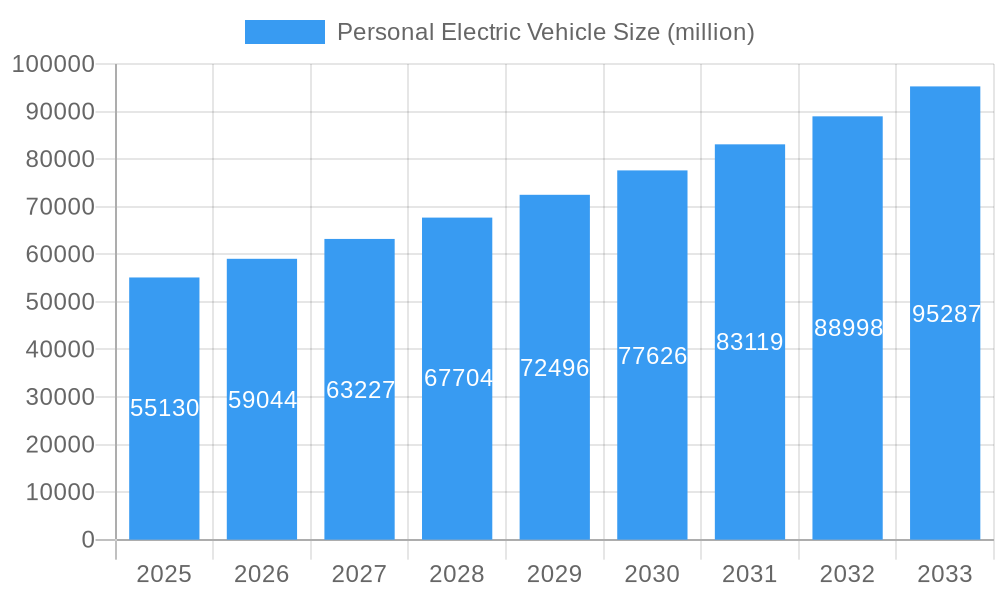
The global personal electric vehicle (PEV) market is poised for substantial expansion, projected to reach a market size of approximately USD 55,130 million by 2025 and demonstrating a robust Compound Annual Growth Rate (CAGR) of 7.6% through 2033. This upward trajectory is primarily fueled by increasing environmental consciousness, a growing demand for sustainable urban mobility solutions, and the escalating price of traditional fuel. Furthermore, government initiatives promoting electric mobility, coupled with advancements in battery technology leading to longer ranges and faster charging times, are significant drivers. The market is characterized by a diverse range of products, with electric scooters and electric bikes leading the charge in terms of adoption due to their affordability, convenience, and maneuverability in congested urban environments. The "Personal Use" application segment is expected to dominate, driven by individual commuters seeking efficient and eco-friendly transportation.
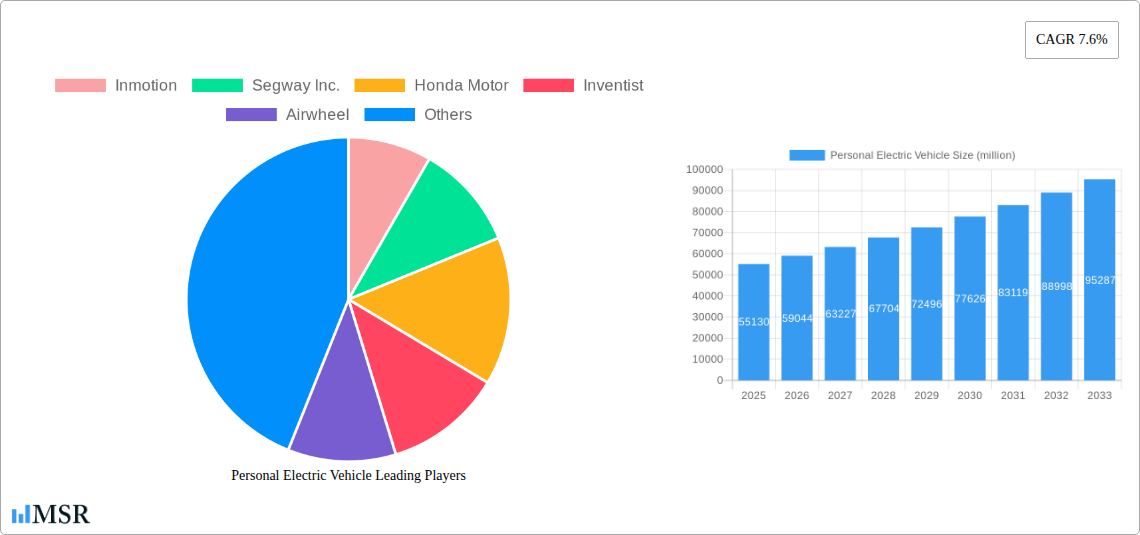
Personal Electric Vehicle Market Size (In Billion)
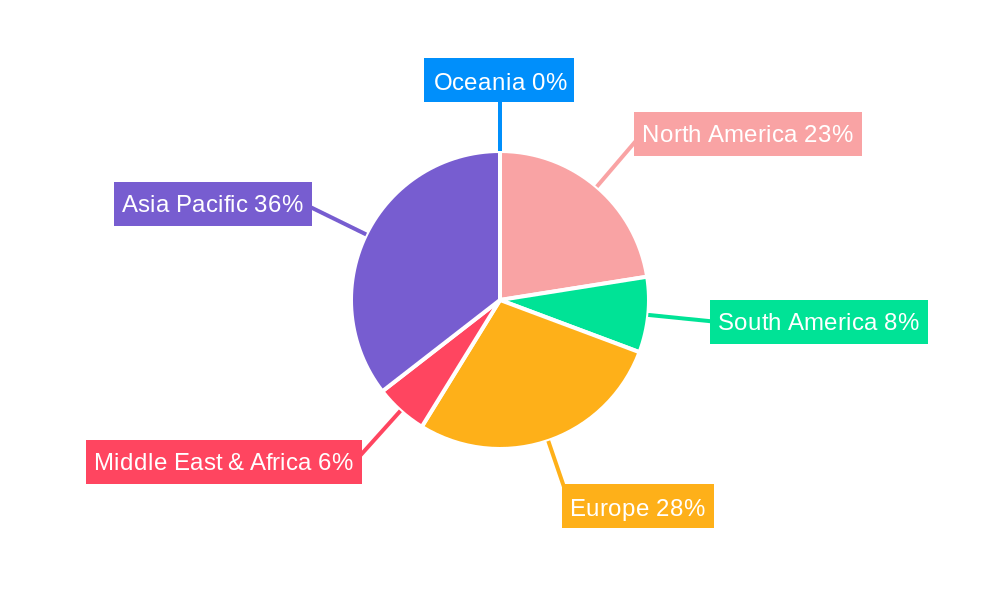
The competitive landscape is vibrant, featuring a mix of established automotive giants like Honda Motor and emerging innovators such as Segway Inc., Inmotion, and Xiaomi. These companies are continuously investing in research and development to introduce lighter, more powerful, and feature-rich PEVs. Trends such as the integration of smart technologies, including GPS tracking, anti-theft systems, and app connectivity, are becoming standard. However, the market faces certain restraints, including the initial high cost of some PEV models, limited charging infrastructure in certain regions, and evolving regulatory frameworks that can impact adoption rates. Despite these challenges, the Asia Pacific region, led by China, is anticipated to be the largest and fastest-growing market, owing to a strong manufacturing base, supportive government policies, and a massive consumer population embracing micro-mobility. North America and Europe are also significant contributors, with increasing urban population density and a growing preference for sustainable transport options.
Personal Electric Vehicle Company Market Share
Unlocking the Future of Urban Mobility: Personal Electric Vehicle Market Report 2024-2033
This comprehensive report provides an in-depth analysis of the Personal Electric Vehicle (PEV) market, a rapidly expanding sector revolutionizing urban commuting and personal transportation. With a projected market size exceeding $500 million by 2033, this study offers critical insights for manufacturers, investors, and policymakers navigating the dynamic landscape of electric bikes, electric scooters, electric hoverboards, electric unicycles, and electric 4-wheel bicycles. The report covers the historical period from 2019–2024, with a base year of 2025 and a forecast period extending to 2033, offering a robust understanding of market concentration, industry trends, key markets, product developments, challenges, growth drivers, and emerging opportunities.
Personal Electric Vehicle Market Concentration & Dynamics
The Personal Electric Vehicle (PEV) market exhibits a moderate to high concentration, with key players like Segway Inc., Inmotion, and Xiaomi holding significant market share. Innovation ecosystems are thriving, driven by continuous advancements in battery technology, motor efficiency, and smart connectivity features. Regulatory frameworks are evolving globally, with many regions implementing dedicated policies and infrastructure to support the adoption of PEVs, aiming to reduce carbon emissions and traffic congestion. Substitute products, primarily traditional bicycles and public transportation, are being increasingly challenged by the convenience, cost-effectiveness, and eco-friendliness of PEVs. End-user trends indicate a strong preference for sustainable, efficient, and personalized mobility solutions, especially within urban environments. Mergers and acquisitions (M&A) activities are on the rise, with approximately 20 M&A deals observed in the historical period (2019-2024), signaling consolidation and strategic expansion by leading companies like Yadea and TAILG. The market share of leading electric scooter manufacturers is estimated to be around 35%, with electric bikes close behind at 30%.
Personal Electric Vehicle Industry Insights & Trends
The Personal Electric Vehicle (PEV) industry is poised for substantial growth, driven by a confluence of factors including increasing environmental awareness, rising fuel prices, and the persistent demand for last-mile connectivity solutions. The global PEV market size is estimated to reach approximately $350 million in the base year 2025, with a Compound Annual Growth Rate (CAGR) of over 15% projected for the forecast period (2025–2033). Technological disruptions are at the forefront, with advancements in lighter, more powerful batteries, enhanced motor technologies, and the integration of AI-powered safety features and navigation systems. Consumer behavior is shifting towards embracing flexible, on-demand transportation options, with a growing interest in shared PEV services and personalized ownership models. The increasing urbanization globally further fuels the demand for compact, efficient, and emission-free personal mobility devices, making PEVs an attractive alternative to traditional vehicles. The average market penetration for electric scooters in major metropolitan areas is anticipated to exceed 25% by 2033.
Key Markets & Segments Leading Personal Electric Vehicle
The Personal Electric Vehicle (PEV) market is experiencing robust growth across several key segments and regions.
Dominant Region: Asia-Pacific, particularly China, remains the largest market for PEVs, driven by strong government support, extensive manufacturing capabilities, and a vast consumer base embracing electric mobility. The region's market share is estimated to be over 60% of the global PEV market.
- Drivers in Asia-Pacific:
- Government incentives and subsidies for electric vehicle adoption.
- Rapid urbanization and increasing traffic congestion.
- Developed charging infrastructure and battery recycling programs.
- Cost-effectiveness and accessibility of PEVs for personal use.
- Drivers in Asia-Pacific:
Dominant Segment (Application): Personal Use
- The Personal Use segment constitutes the largest application, accounting for an estimated 75% of the total PEV market. Consumers are increasingly opting for PEVs for their daily commutes, recreational activities, and as a convenient mode of transport within cities.
- Drivers for Personal Use:
- Convenience and flexibility for individual travel.
- Cost savings compared to traditional vehicles and fuel expenses.
- Environmental consciousness and a desire for sustainable transport.
- Advancements in design and features catering to individual preferences.
Dominant Segment (Type): Electric Scooter
- The Electric Scooter segment is leading the PEV market in terms of volume and revenue, projected to capture over 45% of the market share by 2033. Their portability, ease of use, and affordability make them highly popular for short-distance travel and last-mile connectivity.
- Drivers for Electric Scooters:
- Compact design for easy storage and portability.
- Relatively low price point compared to other PEV types.
- Growing adoption by ride-sharing services.
- Continuous improvements in speed, range, and durability.
Emerging Segments:
- Electric Bikes: Showing significant growth, especially in regions with longer commuting distances and a preference for active transport.
- Electric Unicycles: Gaining traction among enthusiasts and for specialized urban navigation.
- Electric 4-Wheel Bicycles: Offering a more stable and comfortable alternative for individuals seeking enhanced balance and cargo capacity.
The continued development of smart features, improved battery life, and enhanced safety protocols across all PEV types will further solidify their dominance in the personal transportation landscape.
Personal Electric Vehicle Product Developments
Product innovations in the Personal Electric Vehicle (PEV) market are driving significant advancements. Manufacturers are focusing on developing lighter, more durable materials for frames and components, alongside enhanced battery management systems for extended range and faster charging times, with some achieving ranges of over 100 miles on a single charge. Smart features like GPS tracking, anti-theft systems, and app integration are becoming standard, offering users greater convenience and security. Companies like Inmotion and Kingsong are pushing boundaries with advanced suspension systems and foldable designs for improved portability. The market relevance of these developments lies in their ability to address consumer pain points such as range anxiety, charging duration, and user experience, thereby accelerating adoption and solidifying the competitive edge of leading PEV brands.
Challenges in the Personal Electric Vehicle Market
The Personal Electric Vehicle (PEV) market faces several significant challenges that could impact its growth trajectory. Regulatory hurdles remain a primary concern, with varying laws regarding speed limits, helmet usage, and sidewalk riding across different municipalities. The estimated impact of these inconsistent regulations could lead to a 10% slowdown in adoption in certain regions. Supply chain disruptions, exacerbated by global component shortages and geopolitical factors, continue to affect production volumes and pricing, potentially increasing costs by up to 15%. Intense competitive pressures among numerous manufacturers, including giants like Honda Motor and emerging players, are driving down profit margins. Furthermore, the perceived safety of PEVs, particularly electric scooters and hoverboards, can deter some potential consumers, leading to a missed market opportunity of approximately $50 million in the short term.
Forces Driving Personal Electric Vehicle Growth
Several key forces are propelling the Personal Electric Vehicle (PEV) market forward. Technological advancements in battery technology, leading to higher energy density and faster charging capabilities, are significantly reducing range anxiety and improving user convenience. Government initiatives worldwide promoting sustainable transportation and offering incentives for EV adoption create a favorable market environment. For instance, tax credits in some European countries have boosted PEV sales by an estimated 20%. The rising cost of fossil fuels makes PEVs an economically attractive alternative for consumers seeking to reduce their transportation expenses. Furthermore, increasing urbanization and the growing need for efficient last-mile connectivity solutions are creating a consistent demand for compact and agile PEVs.
Challenges in the Personal Electric Vehicle Market
Long-term growth catalysts for the Personal Electric Vehicle (PEV) market lie in continuous innovation and strategic market expansion. The development of advanced battery chemistries promising longer lifespans and even faster charging will be crucial. Partnerships between PEV manufacturers and smart city initiatives, focusing on integrated charging infrastructure and dedicated PEV lanes, will foster wider adoption and improved user experience. Market expansions into developing economies, where urbanization is rapidly increasing and disposable incomes are rising, present significant untapped potential. For example, an estimated $100 million market opportunity exists in Southeast Asian cities alone by 2030, driven by affordable PEV models and supportive infrastructure.
Emerging Opportunities in Personal Electric Vehicle
Emerging opportunities in the Personal Electric Vehicle (PEV) market are abundant, driven by evolving consumer preferences and technological breakthroughs. The integration of AI and IoT capabilities for predictive maintenance, enhanced safety features like collision avoidance, and personalized riding experiences presents a significant avenue for differentiation. The development of modular and customizable PEVs catering to specific user needs, such as ruggedized models for off-road use or lightweight, foldable options for commuters, will unlock new consumer segments. Furthermore, the growing trend towards subscription-based PEV services and integrated mobility platforms offers recurring revenue streams and a more accessible entry point for consumers. The potential market size for these integrated mobility solutions is estimated to reach $200 million by 2030.
Leading Players in the Personal Electric Vehicle Sector
- Inmotion
- Segway Inc.
- Honda Motor
- Inventist
- Airwheel
- T3 Motion
- Razor
- AIMA
- Yadea
- Sunra
- Incalcu
- Lima
- BYVIN
- Lvyuan
- TAILG
- Supaq
- E-TWOW
- EcoReco
- Glion Dolly
- Jetson
- Xiaomi
- Taotao
- Kugoo
- JOYOR
- Joybold
- Okai
- Onewheel
- BOXX Corp.
- Hangzhou CHIC Intelligent
- Kingsong
Key Milestones in Personal Electric Vehicle Industry
- 2019: Launch of advanced battery management systems significantly improving range and charging times across various PEV types.
- 2020: Increased government investments in urban micro-mobility infrastructure, including dedicated lanes and charging stations, boosting PEV adoption.
- 2021: Introduction of AI-powered safety features in electric scooters and hoverboards, enhancing user security and confidence.
- 2022: Significant surge in the adoption of shared electric scooter services, with operational fleets exceeding 5 million globally.
- 2023: Key manufacturers like Yadea and TAILG announce ambitious targets for producing over 10 million electric bikes and scooters annually.
- 2024 (Estimated): Emergence of smart, connected PEVs with integrated navigation and anti-theft features becoming mainstream, with an estimated 30% market penetration for such models.
Strategic Outlook for Personal Electric Vehicle Market
The strategic outlook for the Personal Electric Vehicle (PEV) market is exceptionally positive, driven by sustained innovation and growing consumer demand for sustainable mobility. The future lies in developing more integrated mobility ecosystems, where PEVs seamlessly connect with public transportation and smart city infrastructure. Continued investment in advanced battery technology, aiming for greater energy density and faster charging, will be paramount. Strategic partnerships between PEV manufacturers, technology providers, and urban planners will accelerate the development of user-friendly charging solutions and dedicated infrastructure. The market is expected to witness further consolidation as key players like Segway Inc. and Xiaomi continue to expand their product portfolios and global reach, driving the overall market growth towards an estimated $500 million valuation by 2033.
Personal Electric Vehicle Segmentation
-
1. Application
- 1.1. Personal Use
- 1.2. Shared
-
2. Types
- 2.1. Electric Bike
- 2.2. Electric Scooter
- 2.3. Electric Hoverboard
- 2.4. Electric Unicycle
- 2.5. Electric 4 Wheel Bicycle
- 2.6. Others
Personal Electric Vehicle Segmentation By Geography
-
1. North America
- 1.1. United States
- 1.2. Canada
- 1.3. Mexico
-
2. South America
- 2.1. Brazil
- 2.2. Argentina
- 2.3. Rest of South America
-
3. Europe
- 3.1. United Kingdom
- 3.2. Germany
- 3.3. France
- 3.4. Italy
- 3.5. Spain
- 3.6. Russia
- 3.7. Benelux
- 3.8. Nordics
- 3.9. Rest of Europe
-
4. Middle East & Africa
- 4.1. Turkey
- 4.2. Israel
- 4.3. GCC
- 4.4. North Africa
- 4.5. South Africa
- 4.6. Rest of Middle East & Africa
-
5. Asia Pacific
- 5.1. China
- 5.2. India
- 5.3. Japan
- 5.4. South Korea
- 5.5. ASEAN
- 5.6. Oceania
- 5.7. Rest of Asia Pacific
Personal Electric Vehicle Regional Market Share
Geographic Coverage of Personal Electric Vehicle
Personal Electric Vehicle REPORT HIGHLIGHTS
| Aspects | Details |
|---|---|
| Study Period | 2020-2034 |
| Base Year | 2025 |
| Estimated Year | 2026 |
| Forecast Period | 2026-2034 |
| Historical Period | 2020-2025 |
| Growth Rate | CAGR of 7.6% from 2020-2034 |
| Segmentation |
|
Table of Contents
- 1. Introduction
- 1.1. Research Scope
- 1.2. Market Segmentation
- 1.3. Research Objective
- 1.4. Definitions and Assumptions
- 2. Executive Summary
- 2.1. Market Snapshot
- 3. Market Dynamics
- 3.1. Market Drivers
- 3.2. Market Restrains
- 3.3. Market Trends
- 3.4. Market Opportunities
- 4. Market Factor Analysis
- 4.1. Porters Five Forces
- 4.1.1. Bargaining Power of Suppliers
- 4.1.2. Bargaining Power of Buyers
- 4.1.3. Threat of New Entrants
- 4.1.4. Threat of Substitutes
- 4.1.5. Competitive Rivalry
- 4.2. PESTEL analysis
- 4.3. BCG Analysis
- 4.3.1. Stars (High Growth, High Market Share)
- 4.3.2. Cash Cows (Low Growth, High Market Share)
- 4.3.3. Question Mark (High Growth, Low Market Share)
- 4.3.4. Dogs (Low Growth, Low Market Share)
- 4.4. Ansoff Matrix Analysis
- 4.5. Supply Chain Analysis
- 4.6. Regulatory Landscape
- 4.7. Current Market Potential and Opportunity Assessment (TAM–SAM–SOM Framework)
- 4.8. MSR Analyst Note
- 4.1. Porters Five Forces
- 5. Market Analysis, Insights and Forecast 2021-2033
- 5.1. Market Analysis, Insights and Forecast - by Application
- 5.1.1. Personal Use
- 5.1.2. Shared
- 5.2. Market Analysis, Insights and Forecast - by Types
- 5.2.1. Electric Bike
- 5.2.2. Electric Scooter
- 5.2.3. Electric Hoverboard
- 5.2.4. Electric Unicycle
- 5.2.5. Electric 4 Wheel Bicycle
- 5.2.6. Others
- 5.3. Market Analysis, Insights and Forecast - by Region
- 5.3.1. North America
- 5.3.2. South America
- 5.3.3. Europe
- 5.3.4. Middle East & Africa
- 5.3.5. Asia Pacific
- 5.1. Market Analysis, Insights and Forecast - by Application
- 6. Global Personal Electric Vehicle Analysis, Insights and Forecast, 2021-2033
- 6.1. Market Analysis, Insights and Forecast - by Application
- 6.1.1. Personal Use
- 6.1.2. Shared
- 6.2. Market Analysis, Insights and Forecast - by Types
- 6.2.1. Electric Bike
- 6.2.2. Electric Scooter
- 6.2.3. Electric Hoverboard
- 6.2.4. Electric Unicycle
- 6.2.5. Electric 4 Wheel Bicycle
- 6.2.6. Others
- 6.1. Market Analysis, Insights and Forecast - by Application
- 7. North America Personal Electric Vehicle Analysis, Insights and Forecast, 2020-2032
- 7.1. Market Analysis, Insights and Forecast - by Application
- 7.1.1. Personal Use
- 7.1.2. Shared
- 7.2. Market Analysis, Insights and Forecast - by Types
- 7.2.1. Electric Bike
- 7.2.2. Electric Scooter
- 7.2.3. Electric Hoverboard
- 7.2.4. Electric Unicycle
- 7.2.5. Electric 4 Wheel Bicycle
- 7.2.6. Others
- 7.1. Market Analysis, Insights and Forecast - by Application
- 8. South America Personal Electric Vehicle Analysis, Insights and Forecast, 2020-2032
- 8.1. Market Analysis, Insights and Forecast - by Application
- 8.1.1. Personal Use
- 8.1.2. Shared
- 8.2. Market Analysis, Insights and Forecast - by Types
- 8.2.1. Electric Bike
- 8.2.2. Electric Scooter
- 8.2.3. Electric Hoverboard
- 8.2.4. Electric Unicycle
- 8.2.5. Electric 4 Wheel Bicycle
- 8.2.6. Others
- 8.1. Market Analysis, Insights and Forecast - by Application
- 9. Europe Personal Electric Vehicle Analysis, Insights and Forecast, 2020-2032
- 9.1. Market Analysis, Insights and Forecast - by Application
- 9.1.1. Personal Use
- 9.1.2. Shared
- 9.2. Market Analysis, Insights and Forecast - by Types
- 9.2.1. Electric Bike
- 9.2.2. Electric Scooter
- 9.2.3. Electric Hoverboard
- 9.2.4. Electric Unicycle
- 9.2.5. Electric 4 Wheel Bicycle
- 9.2.6. Others
- 9.1. Market Analysis, Insights and Forecast - by Application
- 10. Middle East & Africa Personal Electric Vehicle Analysis, Insights and Forecast, 2020-2032
- 10.1. Market Analysis, Insights and Forecast - by Application
- 10.1.1. Personal Use
- 10.1.2. Shared
- 10.2. Market Analysis, Insights and Forecast - by Types
- 10.2.1. Electric Bike
- 10.2.2. Electric Scooter
- 10.2.3. Electric Hoverboard
- 10.2.4. Electric Unicycle
- 10.2.5. Electric 4 Wheel Bicycle
- 10.2.6. Others
- 10.1. Market Analysis, Insights and Forecast - by Application
- 11. Asia Pacific Personal Electric Vehicle Analysis, Insights and Forecast, 2020-2032
- 11.1. Market Analysis, Insights and Forecast - by Application
- 11.1.1. Personal Use
- 11.1.2. Shared
- 11.2. Market Analysis, Insights and Forecast - by Types
- 11.2.1. Electric Bike
- 11.2.2. Electric Scooter
- 11.2.3. Electric Hoverboard
- 11.2.4. Electric Unicycle
- 11.2.5. Electric 4 Wheel Bicycle
- 11.2.6. Others
- 11.1. Market Analysis, Insights and Forecast - by Application
- 12. Competitive Analysis
- 12.1. Company Profiles
- 12.1.1 Inmotion
- 12.1.1.1. Company Overview
- 12.1.1.2. Products
- 12.1.1.3. Company Financials
- 12.1.1.4. SWOT Analysis
- 12.1.2 Segway Inc.
- 12.1.2.1. Company Overview
- 12.1.2.2. Products
- 12.1.2.3. Company Financials
- 12.1.2.4. SWOT Analysis
- 12.1.3 Honda Motor
- 12.1.3.1. Company Overview
- 12.1.3.2. Products
- 12.1.3.3. Company Financials
- 12.1.3.4. SWOT Analysis
- 12.1.4 Inventist
- 12.1.4.1. Company Overview
- 12.1.4.2. Products
- 12.1.4.3. Company Financials
- 12.1.4.4. SWOT Analysis
- 12.1.5 Airwheel
- 12.1.5.1. Company Overview
- 12.1.5.2. Products
- 12.1.5.3. Company Financials
- 12.1.5.4. SWOT Analysis
- 12.1.6 T3 Motion
- 12.1.6.1. Company Overview
- 12.1.6.2. Products
- 12.1.6.3. Company Financials
- 12.1.6.4. SWOT Analysis
- 12.1.7 Razor
- 12.1.7.1. Company Overview
- 12.1.7.2. Products
- 12.1.7.3. Company Financials
- 12.1.7.4. SWOT Analysis
- 12.1.8 AIMA
- 12.1.8.1. Company Overview
- 12.1.8.2. Products
- 12.1.8.3. Company Financials
- 12.1.8.4. SWOT Analysis
- 12.1.9 Yadea
- 12.1.9.1. Company Overview
- 12.1.9.2. Products
- 12.1.9.3. Company Financials
- 12.1.9.4. SWOT Analysis
- 12.1.10 Sunra
- 12.1.10.1. Company Overview
- 12.1.10.2. Products
- 12.1.10.3. Company Financials
- 12.1.10.4. SWOT Analysis
- 12.1.11 Incalcu
- 12.1.11.1. Company Overview
- 12.1.11.2. Products
- 12.1.11.3. Company Financials
- 12.1.11.4. SWOT Analysis
- 12.1.12 Lima
- 12.1.12.1. Company Overview
- 12.1.12.2. Products
- 12.1.12.3. Company Financials
- 12.1.12.4. SWOT Analysis
- 12.1.13 BYVIN
- 12.1.13.1. Company Overview
- 12.1.13.2. Products
- 12.1.13.3. Company Financials
- 12.1.13.4. SWOT Analysis
- 12.1.14 Lvyuan
- 12.1.14.1. Company Overview
- 12.1.14.2. Products
- 12.1.14.3. Company Financials
- 12.1.14.4. SWOT Analysis
- 12.1.15 TAILG
- 12.1.15.1. Company Overview
- 12.1.15.2. Products
- 12.1.15.3. Company Financials
- 12.1.15.4. SWOT Analysis
- 12.1.16 Supaq
- 12.1.16.1. Company Overview
- 12.1.16.2. Products
- 12.1.16.3. Company Financials
- 12.1.16.4. SWOT Analysis
- 12.1.17 E-TWOW
- 12.1.17.1. Company Overview
- 12.1.17.2. Products
- 12.1.17.3. Company Financials
- 12.1.17.4. SWOT Analysis
- 12.1.18 EcoReco
- 12.1.18.1. Company Overview
- 12.1.18.2. Products
- 12.1.18.3. Company Financials
- 12.1.18.4. SWOT Analysis
- 12.1.19 Glion Dolly
- 12.1.19.1. Company Overview
- 12.1.19.2. Products
- 12.1.19.3. Company Financials
- 12.1.19.4. SWOT Analysis
- 12.1.20 Jetson
- 12.1.20.1. Company Overview
- 12.1.20.2. Products
- 12.1.20.3. Company Financials
- 12.1.20.4. SWOT Analysis
- 12.1.21 Xiaomi
- 12.1.21.1. Company Overview
- 12.1.21.2. Products
- 12.1.21.3. Company Financials
- 12.1.21.4. SWOT Analysis
- 12.1.22 Taotao
- 12.1.22.1. Company Overview
- 12.1.22.2. Products
- 12.1.22.3. Company Financials
- 12.1.22.4. SWOT Analysis
- 12.1.23 Kugoo
- 12.1.23.1. Company Overview
- 12.1.23.2. Products
- 12.1.23.3. Company Financials
- 12.1.23.4. SWOT Analysis
- 12.1.24 JOYOR
- 12.1.24.1. Company Overview
- 12.1.24.2. Products
- 12.1.24.3. Company Financials
- 12.1.24.4. SWOT Analysis
- 12.1.25 Joybold
- 12.1.25.1. Company Overview
- 12.1.25.2. Products
- 12.1.25.3. Company Financials
- 12.1.25.4. SWOT Analysis
- 12.1.26 Okai
- 12.1.26.1. Company Overview
- 12.1.26.2. Products
- 12.1.26.3. Company Financials
- 12.1.26.4. SWOT Analysis
- 12.1.27 Onewheel
- 12.1.27.1. Company Overview
- 12.1.27.2. Products
- 12.1.27.3. Company Financials
- 12.1.27.4. SWOT Analysis
- 12.1.28 BOXX Corp.
- 12.1.28.1. Company Overview
- 12.1.28.2. Products
- 12.1.28.3. Company Financials
- 12.1.28.4. SWOT Analysis
- 12.1.29 Hangzhou CHIC Intelligent
- 12.1.29.1. Company Overview
- 12.1.29.2. Products
- 12.1.29.3. Company Financials
- 12.1.29.4. SWOT Analysis
- 12.1.30 Kingsong
- 12.1.30.1. Company Overview
- 12.1.30.2. Products
- 12.1.30.3. Company Financials
- 12.1.30.4. SWOT Analysis
- 12.1.1 Inmotion
- 12.2. Market Entropy
- 12.2.1 Company's Key Areas Served
- 12.2.2 Recent Developments
- 12.3. Company Market Share Analysis 2025
- 12.3.1 Top 5 Companies Market Share Analysis
- 12.3.2 Top 3 Companies Market Share Analysis
- 12.4. List of Potential Customers
- 13. Research Methodology
List of Figures
- Figure 1: Global Personal Electric Vehicle Revenue Breakdown (million, %) by Region 2025 & 2033
- Figure 2: Global Personal Electric Vehicle Volume Breakdown (K, %) by Region 2025 & 2033
- Figure 3: North America Personal Electric Vehicle Revenue (million), by Application 2025 & 2033
- Figure 4: North America Personal Electric Vehicle Volume (K), by Application 2025 & 2033
- Figure 5: North America Personal Electric Vehicle Revenue Share (%), by Application 2025 & 2033
- Figure 6: North America Personal Electric Vehicle Volume Share (%), by Application 2025 & 2033
- Figure 7: North America Personal Electric Vehicle Revenue (million), by Types 2025 & 2033
- Figure 8: North America Personal Electric Vehicle Volume (K), by Types 2025 & 2033
- Figure 9: North America Personal Electric Vehicle Revenue Share (%), by Types 2025 & 2033
- Figure 10: North America Personal Electric Vehicle Volume Share (%), by Types 2025 & 2033
- Figure 11: North America Personal Electric Vehicle Revenue (million), by Country 2025 & 2033
- Figure 12: North America Personal Electric Vehicle Volume (K), by Country 2025 & 2033
- Figure 13: North America Personal Electric Vehicle Revenue Share (%), by Country 2025 & 2033
- Figure 14: North America Personal Electric Vehicle Volume Share (%), by Country 2025 & 2033
- Figure 15: South America Personal Electric Vehicle Revenue (million), by Application 2025 & 2033
- Figure 16: South America Personal Electric Vehicle Volume (K), by Application 2025 & 2033
- Figure 17: South America Personal Electric Vehicle Revenue Share (%), by Application 2025 & 2033
- Figure 18: South America Personal Electric Vehicle Volume Share (%), by Application 2025 & 2033
- Figure 19: South America Personal Electric Vehicle Revenue (million), by Types 2025 & 2033
- Figure 20: South America Personal Electric Vehicle Volume (K), by Types 2025 & 2033
- Figure 21: South America Personal Electric Vehicle Revenue Share (%), by Types 2025 & 2033
- Figure 22: South America Personal Electric Vehicle Volume Share (%), by Types 2025 & 2033
- Figure 23: South America Personal Electric Vehicle Revenue (million), by Country 2025 & 2033
- Figure 24: South America Personal Electric Vehicle Volume (K), by Country 2025 & 2033
- Figure 25: South America Personal Electric Vehicle Revenue Share (%), by Country 2025 & 2033
- Figure 26: South America Personal Electric Vehicle Volume Share (%), by Country 2025 & 2033
- Figure 27: Europe Personal Electric Vehicle Revenue (million), by Application 2025 & 2033
- Figure 28: Europe Personal Electric Vehicle Volume (K), by Application 2025 & 2033
- Figure 29: Europe Personal Electric Vehicle Revenue Share (%), by Application 2025 & 2033
- Figure 30: Europe Personal Electric Vehicle Volume Share (%), by Application 2025 & 2033
- Figure 31: Europe Personal Electric Vehicle Revenue (million), by Types 2025 & 2033
- Figure 32: Europe Personal Electric Vehicle Volume (K), by Types 2025 & 2033
- Figure 33: Europe Personal Electric Vehicle Revenue Share (%), by Types 2025 & 2033
- Figure 34: Europe Personal Electric Vehicle Volume Share (%), by Types 2025 & 2033
- Figure 35: Europe Personal Electric Vehicle Revenue (million), by Country 2025 & 2033
- Figure 36: Europe Personal Electric Vehicle Volume (K), by Country 2025 & 2033
- Figure 37: Europe Personal Electric Vehicle Revenue Share (%), by Country 2025 & 2033
- Figure 38: Europe Personal Electric Vehicle Volume Share (%), by Country 2025 & 2033
- Figure 39: Middle East & Africa Personal Electric Vehicle Revenue (million), by Application 2025 & 2033
- Figure 40: Middle East & Africa Personal Electric Vehicle Volume (K), by Application 2025 & 2033
- Figure 41: Middle East & Africa Personal Electric Vehicle Revenue Share (%), by Application 2025 & 2033
- Figure 42: Middle East & Africa Personal Electric Vehicle Volume Share (%), by Application 2025 & 2033
- Figure 43: Middle East & Africa Personal Electric Vehicle Revenue (million), by Types 2025 & 2033
- Figure 44: Middle East & Africa Personal Electric Vehicle Volume (K), by Types 2025 & 2033
- Figure 45: Middle East & Africa Personal Electric Vehicle Revenue Share (%), by Types 2025 & 2033
- Figure 46: Middle East & Africa Personal Electric Vehicle Volume Share (%), by Types 2025 & 2033
- Figure 47: Middle East & Africa Personal Electric Vehicle Revenue (million), by Country 2025 & 2033
- Figure 48: Middle East & Africa Personal Electric Vehicle Volume (K), by Country 2025 & 2033
- Figure 49: Middle East & Africa Personal Electric Vehicle Revenue Share (%), by Country 2025 & 2033
- Figure 50: Middle East & Africa Personal Electric Vehicle Volume Share (%), by Country 2025 & 2033
- Figure 51: Asia Pacific Personal Electric Vehicle Revenue (million), by Application 2025 & 2033
- Figure 52: Asia Pacific Personal Electric Vehicle Volume (K), by Application 2025 & 2033
- Figure 53: Asia Pacific Personal Electric Vehicle Revenue Share (%), by Application 2025 & 2033
- Figure 54: Asia Pacific Personal Electric Vehicle Volume Share (%), by Application 2025 & 2033
- Figure 55: Asia Pacific Personal Electric Vehicle Revenue (million), by Types 2025 & 2033
- Figure 56: Asia Pacific Personal Electric Vehicle Volume (K), by Types 2025 & 2033
- Figure 57: Asia Pacific Personal Electric Vehicle Revenue Share (%), by Types 2025 & 2033
- Figure 58: Asia Pacific Personal Electric Vehicle Volume Share (%), by Types 2025 & 2033
- Figure 59: Asia Pacific Personal Electric Vehicle Revenue (million), by Country 2025 & 2033
- Figure 60: Asia Pacific Personal Electric Vehicle Volume (K), by Country 2025 & 2033
- Figure 61: Asia Pacific Personal Electric Vehicle Revenue Share (%), by Country 2025 & 2033
- Figure 62: Asia Pacific Personal Electric Vehicle Volume Share (%), by Country 2025 & 2033
List of Tables
- Table 1: Global Personal Electric Vehicle Revenue million Forecast, by Application 2020 & 2033
- Table 2: Global Personal Electric Vehicle Volume K Forecast, by Application 2020 & 2033
- Table 3: Global Personal Electric Vehicle Revenue million Forecast, by Types 2020 & 2033
- Table 4: Global Personal Electric Vehicle Volume K Forecast, by Types 2020 & 2033
- Table 5: Global Personal Electric Vehicle Revenue million Forecast, by Region 2020 & 2033
- Table 6: Global Personal Electric Vehicle Volume K Forecast, by Region 2020 & 2033
- Table 7: Global Personal Electric Vehicle Revenue million Forecast, by Application 2020 & 2033
- Table 8: Global Personal Electric Vehicle Volume K Forecast, by Application 2020 & 2033
- Table 9: Global Personal Electric Vehicle Revenue million Forecast, by Types 2020 & 2033
- Table 10: Global Personal Electric Vehicle Volume K Forecast, by Types 2020 & 2033
- Table 11: Global Personal Electric Vehicle Revenue million Forecast, by Country 2020 & 2033
- Table 12: Global Personal Electric Vehicle Volume K Forecast, by Country 2020 & 2033
- Table 13: United States Personal Electric Vehicle Revenue (million) Forecast, by Application 2020 & 2033
- Table 14: United States Personal Electric Vehicle Volume (K) Forecast, by Application 2020 & 2033
- Table 15: Canada Personal Electric Vehicle Revenue (million) Forecast, by Application 2020 & 2033
- Table 16: Canada Personal Electric Vehicle Volume (K) Forecast, by Application 2020 & 2033
- Table 17: Mexico Personal Electric Vehicle Revenue (million) Forecast, by Application 2020 & 2033
- Table 18: Mexico Personal Electric Vehicle Volume (K) Forecast, by Application 2020 & 2033
- Table 19: Global Personal Electric Vehicle Revenue million Forecast, by Application 2020 & 2033
- Table 20: Global Personal Electric Vehicle Volume K Forecast, by Application 2020 & 2033
- Table 21: Global Personal Electric Vehicle Revenue million Forecast, by Types 2020 & 2033
- Table 22: Global Personal Electric Vehicle Volume K Forecast, by Types 2020 & 2033
- Table 23: Global Personal Electric Vehicle Revenue million Forecast, by Country 2020 & 2033
- Table 24: Global Personal Electric Vehicle Volume K Forecast, by Country 2020 & 2033
- Table 25: Brazil Personal Electric Vehicle Revenue (million) Forecast, by Application 2020 & 2033
- Table 26: Brazil Personal Electric Vehicle Volume (K) Forecast, by Application 2020 & 2033
- Table 27: Argentina Personal Electric Vehicle Revenue (million) Forecast, by Application 2020 & 2033
- Table 28: Argentina Personal Electric Vehicle Volume (K) Forecast, by Application 2020 & 2033
- Table 29: Rest of South America Personal Electric Vehicle Revenue (million) Forecast, by Application 2020 & 2033
- Table 30: Rest of South America Personal Electric Vehicle Volume (K) Forecast, by Application 2020 & 2033
- Table 31: Global Personal Electric Vehicle Revenue million Forecast, by Application 2020 & 2033
- Table 32: Global Personal Electric Vehicle Volume K Forecast, by Application 2020 & 2033
- Table 33: Global Personal Electric Vehicle Revenue million Forecast, by Types 2020 & 2033
- Table 34: Global Personal Electric Vehicle Volume K Forecast, by Types 2020 & 2033
- Table 35: Global Personal Electric Vehicle Revenue million Forecast, by Country 2020 & 2033
- Table 36: Global Personal Electric Vehicle Volume K Forecast, by Country 2020 & 2033
- Table 37: United Kingdom Personal Electric Vehicle Revenue (million) Forecast, by Application 2020 & 2033
- Table 38: United Kingdom Personal Electric Vehicle Volume (K) Forecast, by Application 2020 & 2033
- Table 39: Germany Personal Electric Vehicle Revenue (million) Forecast, by Application 2020 & 2033
- Table 40: Germany Personal Electric Vehicle Volume (K) Forecast, by Application 2020 & 2033
- Table 41: France Personal Electric Vehicle Revenue (million) Forecast, by Application 2020 & 2033
- Table 42: France Personal Electric Vehicle Volume (K) Forecast, by Application 2020 & 2033
- Table 43: Italy Personal Electric Vehicle Revenue (million) Forecast, by Application 2020 & 2033
- Table 44: Italy Personal Electric Vehicle Volume (K) Forecast, by Application 2020 & 2033
- Table 45: Spain Personal Electric Vehicle Revenue (million) Forecast, by Application 2020 & 2033
- Table 46: Spain Personal Electric Vehicle Volume (K) Forecast, by Application 2020 & 2033
- Table 47: Russia Personal Electric Vehicle Revenue (million) Forecast, by Application 2020 & 2033
- Table 48: Russia Personal Electric Vehicle Volume (K) Forecast, by Application 2020 & 2033
- Table 49: Benelux Personal Electric Vehicle Revenue (million) Forecast, by Application 2020 & 2033
- Table 50: Benelux Personal Electric Vehicle Volume (K) Forecast, by Application 2020 & 2033
- Table 51: Nordics Personal Electric Vehicle Revenue (million) Forecast, by Application 2020 & 2033
- Table 52: Nordics Personal Electric Vehicle Volume (K) Forecast, by Application 2020 & 2033
- Table 53: Rest of Europe Personal Electric Vehicle Revenue (million) Forecast, by Application 2020 & 2033
- Table 54: Rest of Europe Personal Electric Vehicle Volume (K) Forecast, by Application 2020 & 2033
- Table 55: Global Personal Electric Vehicle Revenue million Forecast, by Application 2020 & 2033
- Table 56: Global Personal Electric Vehicle Volume K Forecast, by Application 2020 & 2033
- Table 57: Global Personal Electric Vehicle Revenue million Forecast, by Types 2020 & 2033
- Table 58: Global Personal Electric Vehicle Volume K Forecast, by Types 2020 & 2033
- Table 59: Global Personal Electric Vehicle Revenue million Forecast, by Country 2020 & 2033
- Table 60: Global Personal Electric Vehicle Volume K Forecast, by Country 2020 & 2033
- Table 61: Turkey Personal Electric Vehicle Revenue (million) Forecast, by Application 2020 & 2033
- Table 62: Turkey Personal Electric Vehicle Volume (K) Forecast, by Application 2020 & 2033
- Table 63: Israel Personal Electric Vehicle Revenue (million) Forecast, by Application 2020 & 2033
- Table 64: Israel Personal Electric Vehicle Volume (K) Forecast, by Application 2020 & 2033
- Table 65: GCC Personal Electric Vehicle Revenue (million) Forecast, by Application 2020 & 2033
- Table 66: GCC Personal Electric Vehicle Volume (K) Forecast, by Application 2020 & 2033
- Table 67: North Africa Personal Electric Vehicle Revenue (million) Forecast, by Application 2020 & 2033
- Table 68: North Africa Personal Electric Vehicle Volume (K) Forecast, by Application 2020 & 2033
- Table 69: South Africa Personal Electric Vehicle Revenue (million) Forecast, by Application 2020 & 2033
- Table 70: South Africa Personal Electric Vehicle Volume (K) Forecast, by Application 2020 & 2033
- Table 71: Rest of Middle East & Africa Personal Electric Vehicle Revenue (million) Forecast, by Application 2020 & 2033
- Table 72: Rest of Middle East & Africa Personal Electric Vehicle Volume (K) Forecast, by Application 2020 & 2033
- Table 73: Global Personal Electric Vehicle Revenue million Forecast, by Application 2020 & 2033
- Table 74: Global Personal Electric Vehicle Volume K Forecast, by Application 2020 & 2033
- Table 75: Global Personal Electric Vehicle Revenue million Forecast, by Types 2020 & 2033
- Table 76: Global Personal Electric Vehicle Volume K Forecast, by Types 2020 & 2033
- Table 77: Global Personal Electric Vehicle Revenue million Forecast, by Country 2020 & 2033
- Table 78: Global Personal Electric Vehicle Volume K Forecast, by Country 2020 & 2033
- Table 79: China Personal Electric Vehicle Revenue (million) Forecast, by Application 2020 & 2033
- Table 80: China Personal Electric Vehicle Volume (K) Forecast, by Application 2020 & 2033
- Table 81: India Personal Electric Vehicle Revenue (million) Forecast, by Application 2020 & 2033
- Table 82: India Personal Electric Vehicle Volume (K) Forecast, by Application 2020 & 2033
- Table 83: Japan Personal Electric Vehicle Revenue (million) Forecast, by Application 2020 & 2033
- Table 84: Japan Personal Electric Vehicle Volume (K) Forecast, by Application 2020 & 2033
- Table 85: South Korea Personal Electric Vehicle Revenue (million) Forecast, by Application 2020 & 2033
- Table 86: South Korea Personal Electric Vehicle Volume (K) Forecast, by Application 2020 & 2033
- Table 87: ASEAN Personal Electric Vehicle Revenue (million) Forecast, by Application 2020 & 2033
- Table 88: ASEAN Personal Electric Vehicle Volume (K) Forecast, by Application 2020 & 2033
- Table 89: Oceania Personal Electric Vehicle Revenue (million) Forecast, by Application 2020 & 2033
- Table 90: Oceania Personal Electric Vehicle Volume (K) Forecast, by Application 2020 & 2033
- Table 91: Rest of Asia Pacific Personal Electric Vehicle Revenue (million) Forecast, by Application 2020 & 2033
- Table 92: Rest of Asia Pacific Personal Electric Vehicle Volume (K) Forecast, by Application 2020 & 2033
Frequently Asked Questions
1. What is the projected Compound Annual Growth Rate (CAGR) of the Personal Electric Vehicle?
The projected CAGR is approximately 7.6%.
2. Which companies are prominent players in the Personal Electric Vehicle?
Key companies in the market include Inmotion, Segway Inc., Honda Motor, Inventist, Airwheel, T3 Motion, Razor, AIMA, Yadea, Sunra, Incalcu, Lima, BYVIN, Lvyuan, TAILG, Supaq, E-TWOW, EcoReco, Glion Dolly, Jetson, Xiaomi, Taotao, Kugoo, JOYOR, Joybold, Okai, Onewheel, BOXX Corp., Hangzhou CHIC Intelligent, Kingsong.
3. What are the main segments of the Personal Electric Vehicle?
The market segments include Application, Types.
4. Can you provide details about the market size?
The market size is estimated to be USD 55130 million as of 2022.
5. What are some drivers contributing to market growth?
N/A
6. What are the notable trends driving market growth?
N/A
7. Are there any restraints impacting market growth?
N/A
8. Can you provide examples of recent developments in the market?
N/A
9. What pricing options are available for accessing the report?
Pricing options include single-user, multi-user, and enterprise licenses priced at USD 3950.00, USD 5925.00, and USD 7900.00 respectively.
10. Is the market size provided in terms of value or volume?
The market size is provided in terms of value, measured in million and volume, measured in K.
11. Are there any specific market keywords associated with the report?
Yes, the market keyword associated with the report is "Personal Electric Vehicle," which aids in identifying and referencing the specific market segment covered.
12. How do I determine which pricing option suits my needs best?
The pricing options vary based on user requirements and access needs. Individual users may opt for single-user licenses, while businesses requiring broader access may choose multi-user or enterprise licenses for cost-effective access to the report.
13. Are there any additional resources or data provided in the Personal Electric Vehicle report?
While the report offers comprehensive insights, it's advisable to review the specific contents or supplementary materials provided to ascertain if additional resources or data are available.
14. How can I stay updated on further developments or reports in the Personal Electric Vehicle?
To stay informed about further developments, trends, and reports in the Personal Electric Vehicle, consider subscribing to industry newsletters, following relevant companies and organizations, or regularly checking reputable industry news sources and publications.
Methodology
Step 1 - Identification of Relevant Samples Size from Population Database


Step 2 - Approaches for Defining Global Market Size (Value, Volume* & Price*)

Note*: In applicable scenarios
Step 3 - Data Sources
Primary Research
- Web Analytics
- Survey Reports
- Research Institute
- Latest Research Reports
- Opinion Leaders
Secondary Research
- Annual Reports
- White Paper
- Latest Press Release
- Industry Association
- Paid Database
- Investor Presentations

Step 4 - Data Triangulation
Involves using different sources of information in order to increase the validity of a study
These sources are likely to be stakeholders in a program - participants, other researchers, program staff, other community members, and so on.
Then we put all data in single framework & apply various statistical tools to find out the dynamic on the market.
During the analysis stage, feedback from the stakeholder groups would be compared to determine areas of agreement as well as areas of divergence