

Key Insights
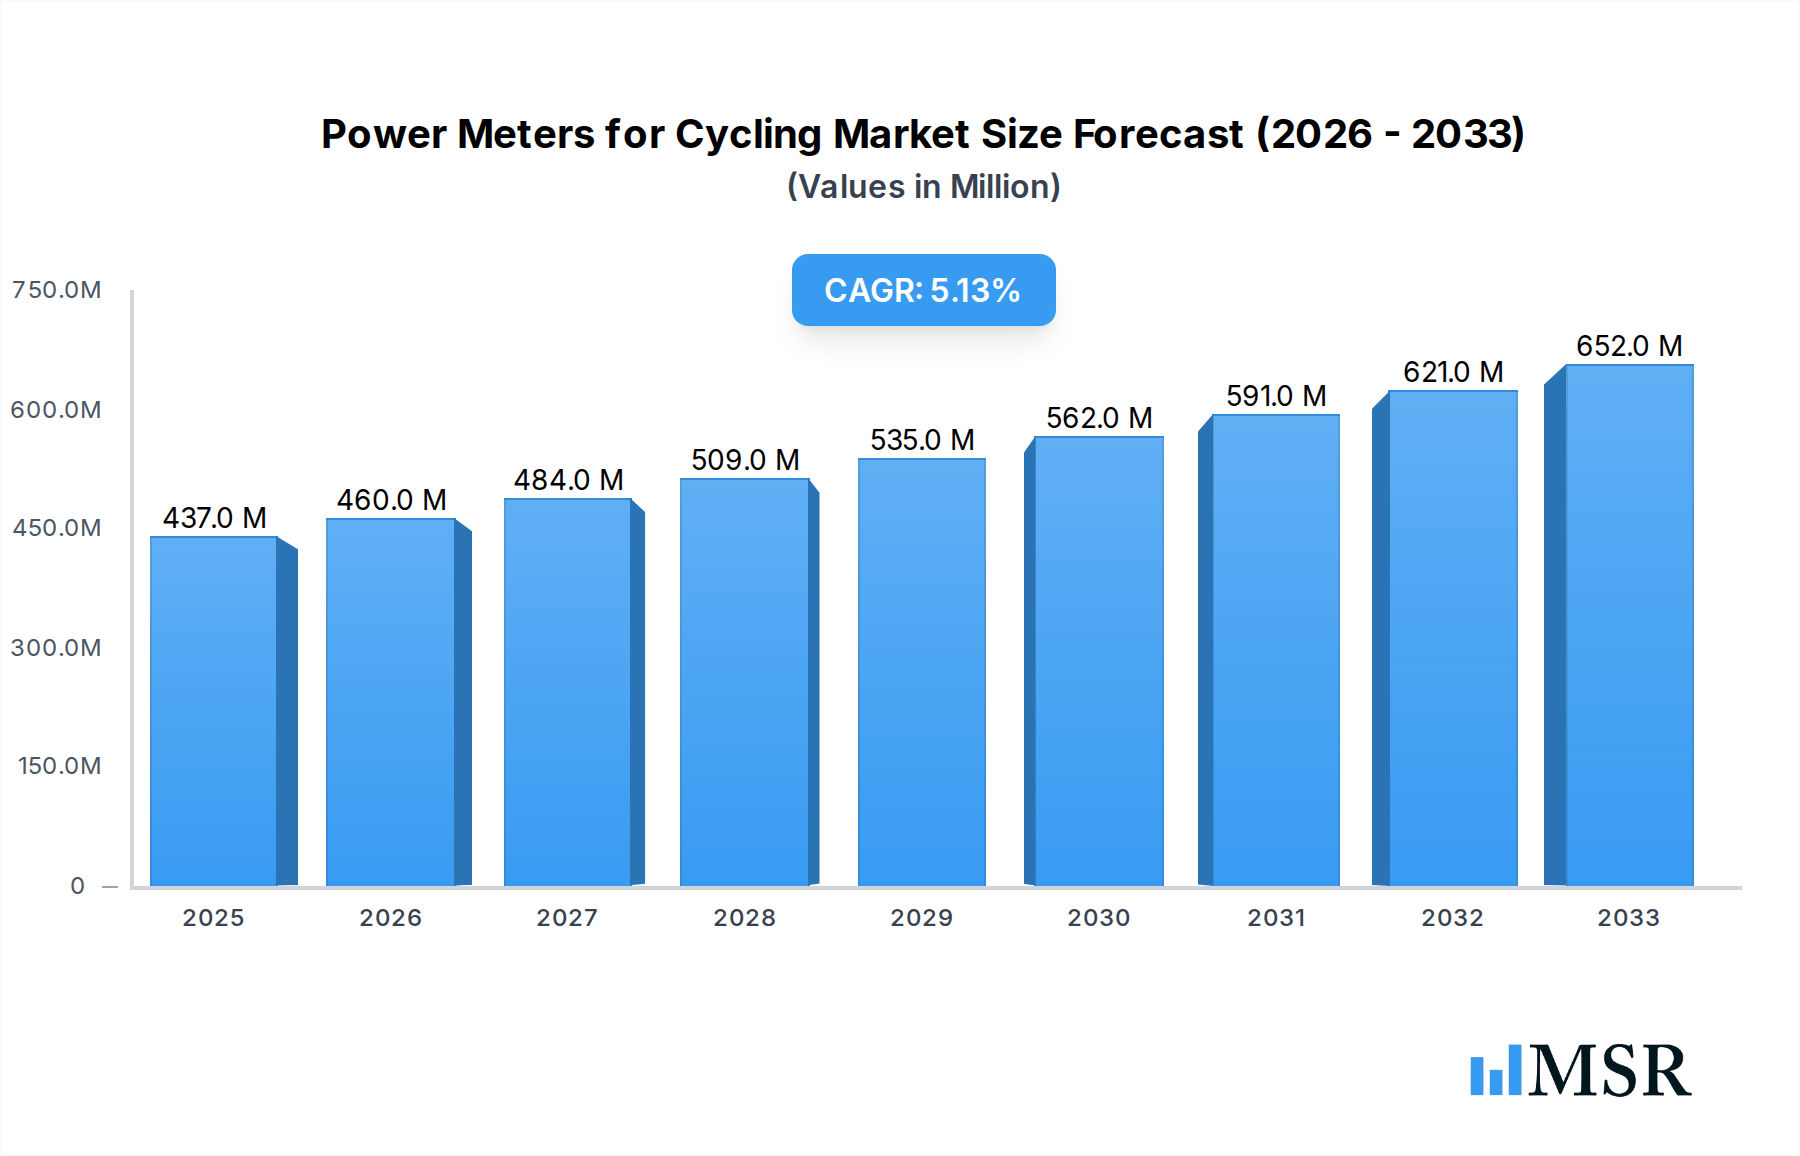
The global power meters for cycling market is poised for substantial growth, projected to reach USD 437 million by 2025. This expansion is driven by an increasing adoption of performance-enhancing technologies among both professional and amateur cyclists, a growing awareness of the benefits of data-driven training, and the rising popularity of cycling as a recreational and competitive sport. The market's CAGR of 5.1% over the forecast period (2025-2033) signals a robust and sustained upward trajectory. Key drivers include advancements in sensor technology leading to more accurate and affordable power meters, the integration of power meters with smart training platforms, and the growing demand for advanced analytics to optimize training regimens and race strategies. The expanding e-commerce landscape is also facilitating wider accessibility to these sophisticated devices.

Power Meters for Cycling Market Size (In Million)
The market is segmented into various applications, including road bikes, mountain bikes, and others, with road bikes currently dominating due to their widespread use in competitive and performance-oriented cycling. By type, crank-based power meters hold a significant market share, followed by spider-mounted and pedal power meters, each offering distinct advantages in terms of installation, compatibility, and price point. Major players like Stages Cycling, Garmin, and Quarq (SRAM) are actively innovating, introducing lighter, more durable, and more precise power meters. Emerging markets in Asia Pacific, particularly China and India, are expected to witness rapid growth, fueled by a burgeoning middle class and increased investment in sports infrastructure. Despite the positive outlook, potential restraints such as the high initial cost of some advanced units and the need for greater consumer education regarding the practical application of power meter data could pose challenges. However, the overarching trend towards data-driven athletic improvement and the continuous innovation within the industry are expected to overcome these hurdles.
Power Meters for Cycling Company Market Share
Power Meters for Cycling Market Analysis: Growth, Trends, and Competitive Landscape (2019-2033)
This comprehensive report delves into the dynamic global market for power meters for cycling. With a study period spanning from 2019 to 2033, a base year of 2025, and a forecast period from 2025 to 2033, this analysis provides deep insights into market concentration, industry trends, key segments, product innovations, challenges, growth drivers, emerging opportunities, leading players, and strategic outlook. We examine critical data points including market size projected to reach several million dollars, CAGR, and M&A activities, offering actionable intelligence for industry stakeholders.
Power Meters for Cycling Market Concentration & Dynamics
The global power meters for cycling market exhibits a moderate to high concentration, driven by significant investments in research and development and strategic acquisitions. Key players like SRAM (Quarq), Shimano, and Garmin dominate, holding substantial market shares estimated in the millions. The innovation ecosystem is robust, with companies continuously introducing advanced technologies to enhance accuracy, durability, and user experience. Regulatory frameworks, while generally supportive of technological advancement, focus on product safety and interoperability. Substitute products, such as advanced GPS devices with estimated power output calculations, pose a minor threat, but dedicated power meters offer superior precision. End-user trends reveal a growing demand for data-driven training among professional and amateur cyclists, pushing the adoption of these sophisticated devices. Mergers and acquisitions (M&A) activity is a notable trend, with an estimated number of xx deals over the historical period, consolidating market power and expanding product portfolios, further shaping the competitive landscape.
Power Meters for Cycling Industry Insights & Trends
The power meters for cycling industry is poised for significant expansion, with the market size projected to reach several million dollars by 2025 and continue its upward trajectory. The Compound Annual Growth Rate (CAGR) is estimated to be robust, driven by several interconnected factors. Technological disruptions are at the forefront, with advancements in strain gauge technology, Bluetooth connectivity, and AI-powered data analysis leading to more accurate and user-friendly devices. Evolving consumer behaviors are also a major catalyst; cyclists, from elite professionals to dedicated amateurs, increasingly recognize the value of precise power data for optimizing training regimens, preventing overtraining, and achieving performance gains. The proliferation of cycling analytics platforms and apps further fuels this trend, creating a demand for seamless integration with power meter data. Emerging applications beyond traditional road and mountain biking, such as gravel and e-bikes, are opening new avenues for growth. Furthermore, the increasing affordability of advanced power meter technology, coupled with promotional activities and a growing awareness of its benefits, is democratizing access to these performance-enhancing tools, attracting a wider segment of the cycling community. The market is witnessing a shift towards smaller, lighter, and more integrated power meter solutions, further enhancing their appeal.
Key Markets & Segments Leading Power Meters for Cycling
The global power meters for cycling market is characterized by dominant regions and segments, each contributing to the overall growth.
Dominant Region: North America currently leads the market, with significant contributions from the United States and Canada.
- Drivers: High disposable income, a well-established cycling culture, strong presence of professional cycling teams and events, and advanced technological adoption among consumers drive market dominance.
- Economic Growth: Robust economic conditions enable higher consumer spending on premium cycling equipment.
- Infrastructure: Extensive network of cycling paths and organized cycling events encourages participation and performance enhancement.
- Technological Adoption: Consumers readily embrace new technologies for performance tracking and improvement.
Dominant Application Segment: Road Bikes represent the largest application segment within the power meters for cycling market.
- Drivers: The inherent focus on performance optimization and quantifiable metrics in professional and competitive road cycling fuels demand.
- Training Methodology: Road cyclists extensively utilize power data for structured training, interval work, and race pacing strategies.
- Product Development: Manufacturers have historically prioritized power meter development for road bikes, leading to a wider array of options and greater market penetration.
Dominant Type Segment: Crank-based Power Meters continue to hold the largest market share.
- Drivers: These power meters offer a balance of accuracy, reliability, and integration, making them a popular choice for a wide range of cyclists.
- Accuracy: Crank-based systems are known for their consistent and precise power measurement, capturing the entire power output of the rider.
- Durability: They are typically integrated into durable cranksets, designed to withstand the rigors of cycling.
- Brand Integration: Major component manufacturers like Shimano and SRAM offer integrated crank-based power meter solutions, further cementing their market position.
Mountain Bikes and Other segments, including gravel and e-bikes, are experiencing substantial growth, indicating a broadening market appeal and increasing adoption of power meter technology across diverse cycling disciplines. Pedal-based power meters are also gaining traction due to their ease of installation and compatibility across multiple bikes.
Power Meters for Cycling Product Developments
Product innovation in the power meters for cycling market is relentless, with companies focusing on enhanced accuracy, reduced weight, and seamless integration. Advancements include the development of multi-directional strain gauges for more precise readings across various pedaling techniques and the introduction of dual-sided power measurement for a comprehensive understanding of rider biomechanics. Companies are also prioritizing improved battery life and faster data transmission protocols like Bluetooth 5.0 and ANT+. The market relevance of these innovations lies in their ability to provide cyclists with richer, more actionable data, enabling personalized training and performance gains. Competitive edges are gained through proprietary sensor technology, user-friendly app interfaces, and robust build quality, catering to the evolving demands of serious cyclists.
Challenges in the Power Meters for Cycling Market
Despite strong growth, the power meters for cycling market faces several challenges. The high initial cost of advanced power meters can be a barrier for casual cyclists, limiting broader market penetration. Supply chain disruptions, particularly for electronic components, can impact production volumes and lead times. Intense competition among established brands and emerging players can lead to price wars, affecting profit margins. Furthermore, ensuring compatibility and interoperability across different bike platforms and cycling computers remains a technical hurdle. The market also faces challenges in educating a wider audience about the benefits and practical applications of power meter technology beyond elite athletes.
Forces Driving Power Meters for Cycling Growth
Several powerful forces are propelling the growth of the power meters for cycling market. Technologically, advancements in sensor accuracy, wireless connectivity (Bluetooth, ANT+), and data analytics software are making power meters more sophisticated and accessible. Economically, rising disposable incomes in developed and emerging markets allow more consumers to invest in high-performance cycling equipment. Regulatory factors, while not a primary driver, foster innovation by supporting technological standards and intellectual property protection. The increasing professionalization of amateur cycling and a growing emphasis on data-driven training among all levels of cyclists are significant behavioral drivers. Finally, the expansion of the e-bike market is creating new opportunities for integrated power meter solutions.
Challenges in the Power Meters for Cycling Market
The long-term growth catalysts for the power meters for cycling market are multifaceted. Continued innovation in sensor technology, focusing on even greater accuracy and durability, will be crucial. Partnerships between power meter manufacturers and cycling computer brands are essential for seamless data integration and enhanced user experience. Market expansions into developing regions, coupled with educational initiatives to highlight the benefits of power-based training, will unlock new customer bases. The development of more affordable, entry-level power meter options will democratize access and foster broader adoption. Furthermore, the integration of AI and machine learning for advanced performance analysis and personalized coaching recommendations will drive future demand.
Emerging Opportunities in Power Meters for Cycling
Emerging opportunities in the power meters for cycling market are abundant. The rapidly growing gravel cycling segment presents a significant untapped market for rugged and reliable power meters. The e-bike revolution is creating demand for integrated and sophisticated power measurement systems that can complement electric assistance. The development of AI-powered training platforms that leverage power data for personalized coaching and injury prevention offers a substantial growth avenue. Furthermore, there's an opportunity to develop more compact and aesthetically integrated power meter solutions that appeal to cyclists concerned with bike aesthetics. Expansion into emerging markets with growing cycling populations and increasing disposable incomes represents another key opportunity.
Leading Players in the Power Meters for Cycling Sector
- SRM (Schoberer Rad Messtechnik)
- Quarq (SRAM)
- Stages Cycling
- Garmin
- Favero Electronics
- 4iiii Innovations
- Power2Max
- Rotor Bike Components
- Easton Cycling
- Wahoo Fitness
- Shimano
- Verve
- Velocomp
- Magene
- iQsquare
- Pioneer
Key Milestones in Power Meters for Cycling Industry
- 2019: Introduction of next-generation crank-based power meters with improved accuracy and battery life.
- 2020: Significant advancements in pedal-based power meter technology, offering enhanced ease of installation and cross-compatibility.
- 2021: Increased adoption of ANT+ FE-C (Fitness Equipment Control) protocol, enabling better integration with smart trainers.
- 2022: Major players launched dual-sided power meters with advanced metrics like left/right balance and pedal smoothness, becoming increasingly standard.
- 2023: Growth in the "other" applications segment, with power meters becoming more prevalent in gravel and e-bikes.
- 2024: Continued innovation in firmware and software, offering more sophisticated data analysis and training insights through companion apps.
Strategic Outlook for Power Meters for Cycling Market
The strategic outlook for the power meters for cycling market is exceptionally positive, characterized by sustained growth accelerators. Companies will likely focus on enhancing data analytics capabilities, integrating AI for personalized training insights, and developing more compact and aesthetically pleasing designs. Partnerships with cycling computer manufacturers and sports apparel brands will be crucial for creating comprehensive ecosystem solutions. Expansion into emerging markets through targeted marketing and distribution strategies will unlock new revenue streams. Furthermore, the development of more affordable and user-friendly power meter solutions will be key to broadening market penetration and solidifying the position of power meters as an essential tool for cyclists of all levels.
Power Meters for Cycling Segmentation
-
1. Application
- 1.1. Road Bikes
- 1.2. Mountain Bikes
- 1.3. Others
-
2. Types
- 2.1. Crank-based Power Meters
- 2.2. Apider-mounted Power Meters
- 2.3. Pedal Power Meters
Power Meters for Cycling Segmentation By Geography
-
1. North America
- 1.1. United States
- 1.2. Canada
- 1.3. Mexico
-
2. South America
- 2.1. Brazil
- 2.2. Argentina
- 2.3. Rest of South America
-
3. Europe
- 3.1. United Kingdom
- 3.2. Germany
- 3.3. France
- 3.4. Italy
- 3.5. Spain
- 3.6. Russia
- 3.7. Benelux
- 3.8. Nordics
- 3.9. Rest of Europe
-
4. Middle East & Africa
- 4.1. Turkey
- 4.2. Israel
- 4.3. GCC
- 4.4. North Africa
- 4.5. South Africa
- 4.6. Rest of Middle East & Africa
-
5. Asia Pacific
- 5.1. China
- 5.2. India
- 5.3. Japan
- 5.4. South Korea
- 5.5. ASEAN
- 5.6. Oceania
- 5.7. Rest of Asia Pacific
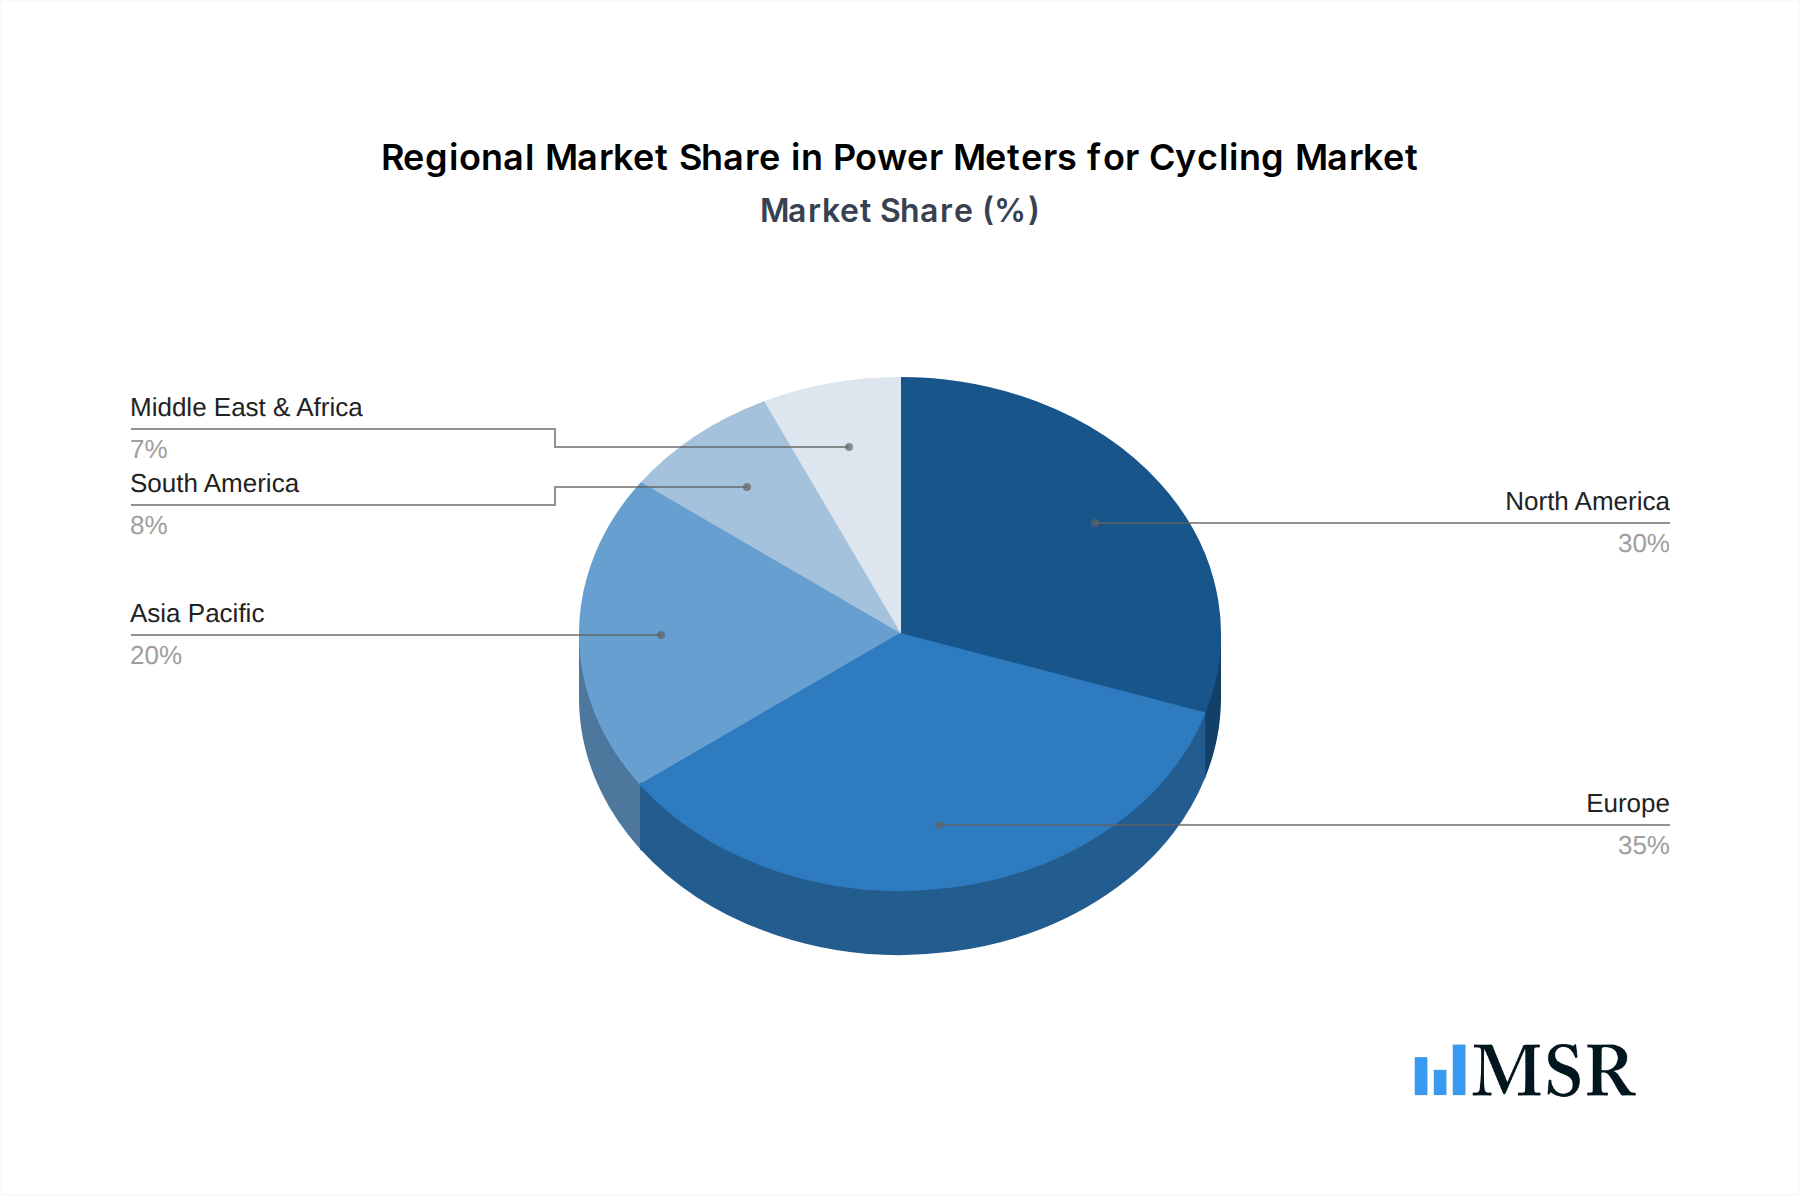
Power Meters for Cycling Regional Market Share
Geographic Coverage of Power Meters for Cycling
Power Meters for Cycling REPORT HIGHLIGHTS
| Aspects | Details |
|---|---|
| Study Period | 2020-2034 |
| Base Year | 2025 |
| Estimated Year | 2026 |
| Forecast Period | 2026-2034 |
| Historical Period | 2020-2025 |
| Growth Rate | CAGR of 5.1% from 2020-2034 |
| Segmentation |
|
Table of Contents
- 1. Introduction
- 1.1. Research Scope
- 1.2. Market Segmentation
- 1.3. Research Objective
- 1.4. Definitions and Assumptions
- 2. Executive Summary
- 2.1. Market Snapshot
- 3. Market Dynamics
- 3.1. Market Drivers
- 3.2. Market Restrains
- 3.3. Market Trends
- 3.4. Market Opportunities
- 4. Market Factor Analysis
- 4.1. Porters Five Forces
- 4.1.1. Bargaining Power of Suppliers
- 4.1.2. Bargaining Power of Buyers
- 4.1.3. Threat of New Entrants
- 4.1.4. Threat of Substitutes
- 4.1.5. Competitive Rivalry
- 4.2. PESTEL analysis
- 4.3. BCG Analysis
- 4.3.1. Stars (High Growth, High Market Share)
- 4.3.2. Cash Cows (Low Growth, High Market Share)
- 4.3.3. Question Mark (High Growth, Low Market Share)
- 4.3.4. Dogs (Low Growth, Low Market Share)
- 4.4. Ansoff Matrix Analysis
- 4.5. Supply Chain Analysis
- 4.6. Regulatory Landscape
- 4.7. Current Market Potential and Opportunity Assessment (TAM–SAM–SOM Framework)
- 4.8. MSR Analyst Note
- 4.1. Porters Five Forces
- 5. Market Analysis, Insights and Forecast 2021-2033
- 5.1. Market Analysis, Insights and Forecast - by Application
- 5.1.1. Road Bikes
- 5.1.2. Mountain Bikes
- 5.1.3. Others
- 5.2. Market Analysis, Insights and Forecast - by Types
- 5.2.1. Crank-based Power Meters
- 5.2.2. Apider-mounted Power Meters
- 5.2.3. Pedal Power Meters
- 5.3. Market Analysis, Insights and Forecast - by Region
- 5.3.1. North America
- 5.3.2. South America
- 5.3.3. Europe
- 5.3.4. Middle East & Africa
- 5.3.5. Asia Pacific
- 5.1. Market Analysis, Insights and Forecast - by Application
- 6. Global Power Meters for Cycling Analysis, Insights and Forecast, 2021-2033
- 6.1. Market Analysis, Insights and Forecast - by Application
- 6.1.1. Road Bikes
- 6.1.2. Mountain Bikes
- 6.1.3. Others
- 6.2. Market Analysis, Insights and Forecast - by Types
- 6.2.1. Crank-based Power Meters
- 6.2.2. Apider-mounted Power Meters
- 6.2.3. Pedal Power Meters
- 6.1. Market Analysis, Insights and Forecast - by Application
- 7. North America Power Meters for Cycling Analysis, Insights and Forecast, 2020-2032
- 7.1. Market Analysis, Insights and Forecast - by Application
- 7.1.1. Road Bikes
- 7.1.2. Mountain Bikes
- 7.1.3. Others
- 7.2. Market Analysis, Insights and Forecast - by Types
- 7.2.1. Crank-based Power Meters
- 7.2.2. Apider-mounted Power Meters
- 7.2.3. Pedal Power Meters
- 7.1. Market Analysis, Insights and Forecast - by Application
- 8. South America Power Meters for Cycling Analysis, Insights and Forecast, 2020-2032
- 8.1. Market Analysis, Insights and Forecast - by Application
- 8.1.1. Road Bikes
- 8.1.2. Mountain Bikes
- 8.1.3. Others
- 8.2. Market Analysis, Insights and Forecast - by Types
- 8.2.1. Crank-based Power Meters
- 8.2.2. Apider-mounted Power Meters
- 8.2.3. Pedal Power Meters
- 8.1. Market Analysis, Insights and Forecast - by Application
- 9. Europe Power Meters for Cycling Analysis, Insights and Forecast, 2020-2032
- 9.1. Market Analysis, Insights and Forecast - by Application
- 9.1.1. Road Bikes
- 9.1.2. Mountain Bikes
- 9.1.3. Others
- 9.2. Market Analysis, Insights and Forecast - by Types
- 9.2.1. Crank-based Power Meters
- 9.2.2. Apider-mounted Power Meters
- 9.2.3. Pedal Power Meters
- 9.1. Market Analysis, Insights and Forecast - by Application
- 10. Middle East & Africa Power Meters for Cycling Analysis, Insights and Forecast, 2020-2032
- 10.1. Market Analysis, Insights and Forecast - by Application
- 10.1.1. Road Bikes
- 10.1.2. Mountain Bikes
- 10.1.3. Others
- 10.2. Market Analysis, Insights and Forecast - by Types
- 10.2.1. Crank-based Power Meters
- 10.2.2. Apider-mounted Power Meters
- 10.2.3. Pedal Power Meters
- 10.1. Market Analysis, Insights and Forecast - by Application
- 11. Asia Pacific Power Meters for Cycling Analysis, Insights and Forecast, 2020-2032
- 11.1. Market Analysis, Insights and Forecast - by Application
- 11.1.1. Road Bikes
- 11.1.2. Mountain Bikes
- 11.1.3. Others
- 11.2. Market Analysis, Insights and Forecast - by Types
- 11.2.1. Crank-based Power Meters
- 11.2.2. Apider-mounted Power Meters
- 11.2.3. Pedal Power Meters
- 11.1. Market Analysis, Insights and Forecast - by Application
- 12. Competitive Analysis
- 12.1. Company Profiles
- 12.1.1 SRM (Schoberer Rad Messtechnik)
- 12.1.1.1. Company Overview
- 12.1.1.2. Products
- 12.1.1.3. Company Financials
- 12.1.1.4. SWOT Analysis
- 12.1.2 Quarq (SRAM)
- 12.1.2.1. Company Overview
- 12.1.2.2. Products
- 12.1.2.3. Company Financials
- 12.1.2.4. SWOT Analysis
- 12.1.3 Stages Cycling
- 12.1.3.1. Company Overview
- 12.1.3.2. Products
- 12.1.3.3. Company Financials
- 12.1.3.4. SWOT Analysis
- 12.1.4 Garmin
- 12.1.4.1. Company Overview
- 12.1.4.2. Products
- 12.1.4.3. Company Financials
- 12.1.4.4. SWOT Analysis
- 12.1.5 Favero Electronics
- 12.1.5.1. Company Overview
- 12.1.5.2. Products
- 12.1.5.3. Company Financials
- 12.1.5.4. SWOT Analysis
- 12.1.6 4iiii Innovations
- 12.1.6.1. Company Overview
- 12.1.6.2. Products
- 12.1.6.3. Company Financials
- 12.1.6.4. SWOT Analysis
- 12.1.7 Power2Max
- 12.1.7.1. Company Overview
- 12.1.7.2. Products
- 12.1.7.3. Company Financials
- 12.1.7.4. SWOT Analysis
- 12.1.8 Rotor Bike Components
- 12.1.8.1. Company Overview
- 12.1.8.2. Products
- 12.1.8.3. Company Financials
- 12.1.8.4. SWOT Analysis
- 12.1.9 Easton Cycling
- 12.1.9.1. Company Overview
- 12.1.9.2. Products
- 12.1.9.3. Company Financials
- 12.1.9.4. SWOT Analysis
- 12.1.10 Wahoo Fitness
- 12.1.10.1. Company Overview
- 12.1.10.2. Products
- 12.1.10.3. Company Financials
- 12.1.10.4. SWOT Analysis
- 12.1.11 Shimano
- 12.1.11.1. Company Overview
- 12.1.11.2. Products
- 12.1.11.3. Company Financials
- 12.1.11.4. SWOT Analysis
- 12.1.12 Verve
- 12.1.12.1. Company Overview
- 12.1.12.2. Products
- 12.1.12.3. Company Financials
- 12.1.12.4. SWOT Analysis
- 12.1.13 Velocomp
- 12.1.13.1. Company Overview
- 12.1.13.2. Products
- 12.1.13.3. Company Financials
- 12.1.13.4. SWOT Analysis
- 12.1.14 Magene
- 12.1.14.1. Company Overview
- 12.1.14.2. Products
- 12.1.14.3. Company Financials
- 12.1.14.4. SWOT Analysis
- 12.1.15 iQsquare
- 12.1.15.1. Company Overview
- 12.1.15.2. Products
- 12.1.15.3. Company Financials
- 12.1.15.4. SWOT Analysis
- 12.1.16 Pioneer
- 12.1.16.1. Company Overview
- 12.1.16.2. Products
- 12.1.16.3. Company Financials
- 12.1.16.4. SWOT Analysis
- 12.1.1 SRM (Schoberer Rad Messtechnik)
- 12.2. Market Entropy
- 12.2.1 Company's Key Areas Served
- 12.2.2 Recent Developments
- 12.3. Company Market Share Analysis 2025
- 12.3.1 Top 5 Companies Market Share Analysis
- 12.3.2 Top 3 Companies Market Share Analysis
- 12.4. List of Potential Customers
- 13. Research Methodology
List of Figures
- Figure 1: Global Power Meters for Cycling Revenue Breakdown (undefined, %) by Region 2025 & 2033
- Figure 2: North America Power Meters for Cycling Revenue (undefined), by Application 2025 & 2033
- Figure 3: North America Power Meters for Cycling Revenue Share (%), by Application 2025 & 2033
- Figure 4: North America Power Meters for Cycling Revenue (undefined), by Types 2025 & 2033
- Figure 5: North America Power Meters for Cycling Revenue Share (%), by Types 2025 & 2033
- Figure 6: North America Power Meters for Cycling Revenue (undefined), by Country 2025 & 2033
- Figure 7: North America Power Meters for Cycling Revenue Share (%), by Country 2025 & 2033
- Figure 8: South America Power Meters for Cycling Revenue (undefined), by Application 2025 & 2033
- Figure 9: South America Power Meters for Cycling Revenue Share (%), by Application 2025 & 2033
- Figure 10: South America Power Meters for Cycling Revenue (undefined), by Types 2025 & 2033
- Figure 11: South America Power Meters for Cycling Revenue Share (%), by Types 2025 & 2033
- Figure 12: South America Power Meters for Cycling Revenue (undefined), by Country 2025 & 2033
- Figure 13: South America Power Meters for Cycling Revenue Share (%), by Country 2025 & 2033
- Figure 14: Europe Power Meters for Cycling Revenue (undefined), by Application 2025 & 2033
- Figure 15: Europe Power Meters for Cycling Revenue Share (%), by Application 2025 & 2033
- Figure 16: Europe Power Meters for Cycling Revenue (undefined), by Types 2025 & 2033
- Figure 17: Europe Power Meters for Cycling Revenue Share (%), by Types 2025 & 2033
- Figure 18: Europe Power Meters for Cycling Revenue (undefined), by Country 2025 & 2033
- Figure 19: Europe Power Meters for Cycling Revenue Share (%), by Country 2025 & 2033
- Figure 20: Middle East & Africa Power Meters for Cycling Revenue (undefined), by Application 2025 & 2033
- Figure 21: Middle East & Africa Power Meters for Cycling Revenue Share (%), by Application 2025 & 2033
- Figure 22: Middle East & Africa Power Meters for Cycling Revenue (undefined), by Types 2025 & 2033
- Figure 23: Middle East & Africa Power Meters for Cycling Revenue Share (%), by Types 2025 & 2033
- Figure 24: Middle East & Africa Power Meters for Cycling Revenue (undefined), by Country 2025 & 2033
- Figure 25: Middle East & Africa Power Meters for Cycling Revenue Share (%), by Country 2025 & 2033
- Figure 26: Asia Pacific Power Meters for Cycling Revenue (undefined), by Application 2025 & 2033
- Figure 27: Asia Pacific Power Meters for Cycling Revenue Share (%), by Application 2025 & 2033
- Figure 28: Asia Pacific Power Meters for Cycling Revenue (undefined), by Types 2025 & 2033
- Figure 29: Asia Pacific Power Meters for Cycling Revenue Share (%), by Types 2025 & 2033
- Figure 30: Asia Pacific Power Meters for Cycling Revenue (undefined), by Country 2025 & 2033
- Figure 31: Asia Pacific Power Meters for Cycling Revenue Share (%), by Country 2025 & 2033
List of Tables
- Table 1: Global Power Meters for Cycling Revenue undefined Forecast, by Application 2020 & 2033
- Table 2: Global Power Meters for Cycling Revenue undefined Forecast, by Types 2020 & 2033
- Table 3: Global Power Meters for Cycling Revenue undefined Forecast, by Region 2020 & 2033
- Table 4: Global Power Meters for Cycling Revenue undefined Forecast, by Application 2020 & 2033
- Table 5: Global Power Meters for Cycling Revenue undefined Forecast, by Types 2020 & 2033
- Table 6: Global Power Meters for Cycling Revenue undefined Forecast, by Country 2020 & 2033
- Table 7: United States Power Meters for Cycling Revenue (undefined) Forecast, by Application 2020 & 2033
- Table 8: Canada Power Meters for Cycling Revenue (undefined) Forecast, by Application 2020 & 2033
- Table 9: Mexico Power Meters for Cycling Revenue (undefined) Forecast, by Application 2020 & 2033
- Table 10: Global Power Meters for Cycling Revenue undefined Forecast, by Application 2020 & 2033
- Table 11: Global Power Meters for Cycling Revenue undefined Forecast, by Types 2020 & 2033
- Table 12: Global Power Meters for Cycling Revenue undefined Forecast, by Country 2020 & 2033
- Table 13: Brazil Power Meters for Cycling Revenue (undefined) Forecast, by Application 2020 & 2033
- Table 14: Argentina Power Meters for Cycling Revenue (undefined) Forecast, by Application 2020 & 2033
- Table 15: Rest of South America Power Meters for Cycling Revenue (undefined) Forecast, by Application 2020 & 2033
- Table 16: Global Power Meters for Cycling Revenue undefined Forecast, by Application 2020 & 2033
- Table 17: Global Power Meters for Cycling Revenue undefined Forecast, by Types 2020 & 2033
- Table 18: Global Power Meters for Cycling Revenue undefined Forecast, by Country 2020 & 2033
- Table 19: United Kingdom Power Meters for Cycling Revenue (undefined) Forecast, by Application 2020 & 2033
- Table 20: Germany Power Meters for Cycling Revenue (undefined) Forecast, by Application 2020 & 2033
- Table 21: France Power Meters for Cycling Revenue (undefined) Forecast, by Application 2020 & 2033
- Table 22: Italy Power Meters for Cycling Revenue (undefined) Forecast, by Application 2020 & 2033
- Table 23: Spain Power Meters for Cycling Revenue (undefined) Forecast, by Application 2020 & 2033
- Table 24: Russia Power Meters for Cycling Revenue (undefined) Forecast, by Application 2020 & 2033
- Table 25: Benelux Power Meters for Cycling Revenue (undefined) Forecast, by Application 2020 & 2033
- Table 26: Nordics Power Meters for Cycling Revenue (undefined) Forecast, by Application 2020 & 2033
- Table 27: Rest of Europe Power Meters for Cycling Revenue (undefined) Forecast, by Application 2020 & 2033
- Table 28: Global Power Meters for Cycling Revenue undefined Forecast, by Application 2020 & 2033
- Table 29: Global Power Meters for Cycling Revenue undefined Forecast, by Types 2020 & 2033
- Table 30: Global Power Meters for Cycling Revenue undefined Forecast, by Country 2020 & 2033
- Table 31: Turkey Power Meters for Cycling Revenue (undefined) Forecast, by Application 2020 & 2033
- Table 32: Israel Power Meters for Cycling Revenue (undefined) Forecast, by Application 2020 & 2033
- Table 33: GCC Power Meters for Cycling Revenue (undefined) Forecast, by Application 2020 & 2033
- Table 34: North Africa Power Meters for Cycling Revenue (undefined) Forecast, by Application 2020 & 2033
- Table 35: South Africa Power Meters for Cycling Revenue (undefined) Forecast, by Application 2020 & 2033
- Table 36: Rest of Middle East & Africa Power Meters for Cycling Revenue (undefined) Forecast, by Application 2020 & 2033
- Table 37: Global Power Meters for Cycling Revenue undefined Forecast, by Application 2020 & 2033
- Table 38: Global Power Meters for Cycling Revenue undefined Forecast, by Types 2020 & 2033
- Table 39: Global Power Meters for Cycling Revenue undefined Forecast, by Country 2020 & 2033
- Table 40: China Power Meters for Cycling Revenue (undefined) Forecast, by Application 2020 & 2033
- Table 41: India Power Meters for Cycling Revenue (undefined) Forecast, by Application 2020 & 2033
- Table 42: Japan Power Meters for Cycling Revenue (undefined) Forecast, by Application 2020 & 2033
- Table 43: South Korea Power Meters for Cycling Revenue (undefined) Forecast, by Application 2020 & 2033
- Table 44: ASEAN Power Meters for Cycling Revenue (undefined) Forecast, by Application 2020 & 2033
- Table 45: Oceania Power Meters for Cycling Revenue (undefined) Forecast, by Application 2020 & 2033
- Table 46: Rest of Asia Pacific Power Meters for Cycling Revenue (undefined) Forecast, by Application 2020 & 2033
Frequently Asked Questions
1. What is the projected Compound Annual Growth Rate (CAGR) of the Power Meters for Cycling?
The projected CAGR is approximately 5.1%.
2. Which companies are prominent players in the Power Meters for Cycling?
Key companies in the market include SRM (Schoberer Rad Messtechnik), Quarq (SRAM), Stages Cycling, Garmin, Favero Electronics, 4iiii Innovations, Power2Max, Rotor Bike Components, Easton Cycling, Wahoo Fitness, Shimano, Verve, Velocomp, Magene, iQsquare, Pioneer.
3. What are the main segments of the Power Meters for Cycling?
The market segments include Application, Types.
4. Can you provide details about the market size?
The market size is estimated to be USD XXX N/A as of 2022.
5. What are some drivers contributing to market growth?
N/A
6. What are the notable trends driving market growth?
N/A
7. Are there any restraints impacting market growth?
N/A
8. Can you provide examples of recent developments in the market?
N/A
9. What pricing options are available for accessing the report?
Pricing options include single-user, multi-user, and enterprise licenses priced at USD 2900.00, USD 4350.00, and USD 5800.00 respectively.
10. Is the market size provided in terms of value or volume?
The market size is provided in terms of value, measured in N/A.
11. Are there any specific market keywords associated with the report?
Yes, the market keyword associated with the report is "Power Meters for Cycling," which aids in identifying and referencing the specific market segment covered.
12. How do I determine which pricing option suits my needs best?
The pricing options vary based on user requirements and access needs. Individual users may opt for single-user licenses, while businesses requiring broader access may choose multi-user or enterprise licenses for cost-effective access to the report.
13. Are there any additional resources or data provided in the Power Meters for Cycling report?
While the report offers comprehensive insights, it's advisable to review the specific contents or supplementary materials provided to ascertain if additional resources or data are available.
14. How can I stay updated on further developments or reports in the Power Meters for Cycling?
To stay informed about further developments, trends, and reports in the Power Meters for Cycling, consider subscribing to industry newsletters, following relevant companies and organizations, or regularly checking reputable industry news sources and publications.
Methodology
Step 1 - Identification of Relevant Samples Size from Population Database


Step 2 - Approaches for Defining Global Market Size (Value, Volume* & Price*)

Note*: In applicable scenarios
Step 3 - Data Sources
Primary Research
- Web Analytics
- Survey Reports
- Research Institute
- Latest Research Reports
- Opinion Leaders
Secondary Research
- Annual Reports
- White Paper
- Latest Press Release
- Industry Association
- Paid Database
- Investor Presentations

Step 4 - Data Triangulation
Involves using different sources of information in order to increase the validity of a study
These sources are likely to be stakeholders in a program - participants, other researchers, program staff, other community members, and so on.
Then we put all data in single framework & apply various statistical tools to find out the dynamic on the market.
During the analysis stage, feedback from the stakeholder groups would be compared to determine areas of agreement as well as areas of divergence