

Key Insights
The global market for Scented Garbage Bags is poised for steady expansion, projected to reach $300.77 million in 2025, with a compelling Compound Annual Growth Rate (CAGR) of 3.5% through 2033. This growth is primarily fueled by increasing consumer demand for enhanced home hygiene and odor control solutions. The convenience and aesthetic appeal of scented garbage bags, which effectively neutralize unpleasant odors, are driving their adoption across both residential and institutional settings. Key market drivers include rising disposable incomes, greater awareness of sanitation practices, and the growing popularity of pleasant home environments. The "Retail & Consumer" segment is expected to lead market demand, as households prioritize odor management in their daily waste disposal.
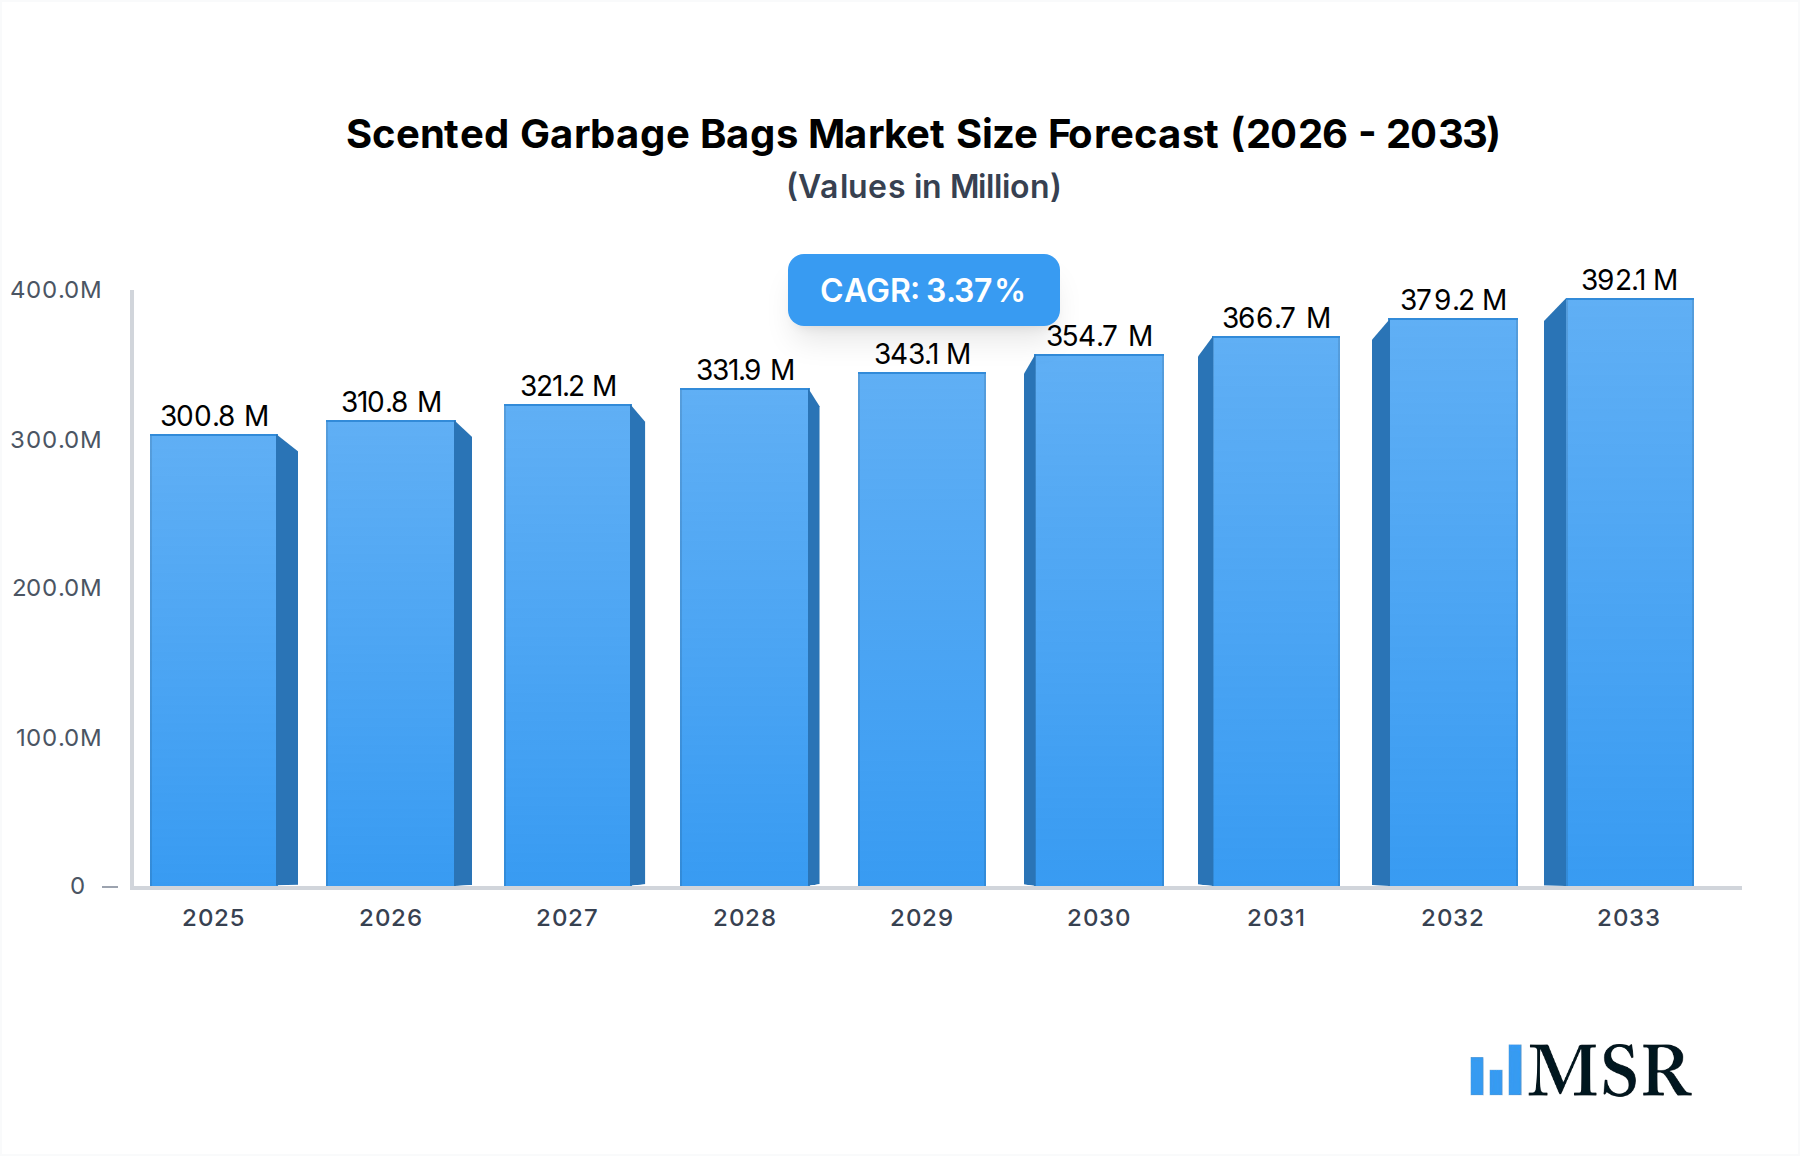
Scented Garbage Bags Market Size (In Million)
Technological advancements in bioplastics and the development of new, sustainable scent infusion techniques are shaping the market's trajectory. While the dominance of Polyethylene (PE) and Polypropylene (PP) is anticipated to continue, the emergence of bioplastic alternatives presents a significant growth opportunity, aligning with global sustainability initiatives. The market, however, faces certain restraints, including the premium pricing of scented varieties compared to conventional bags and potential consumer concerns regarding the chemical composition of scents. Despite these challenges, strategic product innovations, competitive pricing, and targeted marketing campaigns by leading companies like Berry Global, Reynolds Consumer Products, and Poly-America will be instrumental in navigating these complexities and capturing market share in the forecast period.

Scented Garbage Bags Company Market Share
Report Description: Scented Garbage Bags Market Analysis 2024-2033
This comprehensive market research report offers an in-depth analysis of the global scented garbage bags market, a rapidly evolving sector driven by increasing consumer demand for hygiene, odor control, and sustainable waste management solutions. Spanning the study period 2019–2033, with a base year of 2025 and a detailed forecast period of 2025–2033, this report provides critical insights for industry stakeholders, including manufacturers, distributors, investors, and raw material suppliers. Our analysis encompasses historical trends from 2019–2024, offering a robust foundation for understanding market dynamics. We examine key segments like Polyethylene (PE), Polypropylene (PP), and innovative Bioplastic options, alongside diverse applications across Retail & Consumer, Institutional, and Industrial sectors.
Scented Garbage Bags Market Concentration & Dynamics
The global scented garbage bags market exhibits a dynamic concentration, characterized by the presence of both large, established players and emerging innovators. Market share is influenced by brand recognition, product innovation, and distribution networks. Leading companies such as Reynolds Consumer Products (Hefty) and Glad command significant portions of the retail & consumer segment, while specialized manufacturers cater to niche institutional and industrial needs. The innovation ecosystem is robust, with a growing emphasis on developing eco-friendly and high-performance bioplastic garbage bags. Regulatory frameworks concerning plastic usage and waste management are increasingly influencing market strategies, pushing for more sustainable alternatives. The threat of substitute products, such as reusable bins or alternative odor-control solutions, remains a consideration, though the convenience and disposability of scented garbage bags continue to drive demand. End-user trends lean towards enhanced hygiene and a pleasant home environment, particularly in urban settings. Mergers and acquisitions (M&A) activity, with an estimated XX M&A deals in the historical period and projected to reach XX million by 2033, indicates consolidation and strategic expansion by key players to enhance their market reach and technological capabilities.
Scented Garbage Bags Industry Insights & Trends
The scented garbage bags industry is poised for significant growth, driven by a confluence of factors including increasing urbanization, rising hygiene consciousness, and a growing preference for odor-free living spaces. The market size, valued at approximately $2,500 million in the base year 2025, is projected to expand at a Compound Annual Growth Rate (CAGR) of 5.8% during the forecast period 2025–2033, reaching an estimated $4,200 million by the end of the period. Technological disruptions are playing a pivotal role, with advancements in materials science leading to the development of stronger, more tear-resistant, and increasingly biodegradable bioplastic garbage bags. These innovations address growing environmental concerns and cater to a segment of consumers actively seeking sustainable options. Evolving consumer behaviors are a key growth driver. As disposable incomes rise globally, consumers are willing to invest in products that enhance their quality of life, with odor control and a pleasant home environment becoming paramount. The retail & consumer segment, accounting for over 65% of the market revenue in 2025, is expected to continue its dominance due to widespread household adoption. The institutional sector, including healthcare facilities, hospitality, and food service, also presents substantial growth opportunities, driven by stringent hygiene standards and the need for effective odor management. The industrial segment, while smaller, is seeing increased adoption driven by specialized waste disposal requirements. The rising popularity of scented garbage bags is further amplified by effective marketing campaigns that highlight their benefits beyond simple waste containment. This includes promoting a cleaner, healthier, and more aesthetically pleasing living and working environment. Furthermore, the growing awareness about the spread of germs and diseases is indirectly boosting the demand for hygienic waste disposal solutions, with scented garbage bags offering an added layer of protection and comfort. The shift towards smaller household sizes and apartment living in urban areas also contributes to the demand for convenience-oriented products like scented garbage bags.
Key Markets & Segments Leading Scented Garbage Bags
The scented garbage bags market is experiencing robust growth across various regions and segments, with North America projected to remain the dominant market, accounting for approximately 35% of global revenue in 2025, driven by high disposable incomes and established consumer preferences for convenience and hygiene. The Retail & Consumer segment is the undisputed leader, representing over 65% of the total market share in the base year 2025. This dominance is fueled by widespread household adoption, the influence of major brands like Glad and Hefty, and an increasing consumer focus on maintaining odor-free living spaces.
- Drivers for Retail & Consumer Dominance:
- Rising Disposable Incomes: Increased purchasing power allows consumers to opt for premium products that offer enhanced benefits like scent.
- Urbanization: Higher population density in cities leads to a greater need for effective odor control in confined living spaces.
- Hygiene Consciousness: Growing awareness about health and cleanliness drives demand for products that contribute to a hygienic environment.
- Brand Loyalty and Marketing: Strong brand presence and effective marketing by companies like Reynolds Consumer Products (Hefty) and Berry Global influence consumer choices.
In terms of product types, Polyethylene (PE) garbage bags continue to hold the largest market share, estimated at 70% in 2025, due to their cost-effectiveness, durability, and widespread availability. However, the Bioplastic segment is witnessing the fastest growth, projected to expand at a CAGR of 8.5% during the forecast period. This surge is driven by increasing environmental regulations and a growing consumer preference for sustainable and biodegradable waste management solutions.
- Drivers for Bioplastic Growth:
- Environmental Sustainability: Growing consumer and corporate demand for eco-friendly alternatives to traditional plastics.
- Government Regulations: Stricter policies on single-use plastics are encouraging the adoption of biodegradable options.
- Technological Advancements: Innovations in bioplastic materials are improving their performance and reducing costs.
- Corporate Social Responsibility: Companies are increasingly adopting sustainable practices, including the use of bioplastic waste bags.
The Institutional segment, encompassing healthcare, hospitality, and food service industries, is also a significant contributor, expected to grow at a CAGR of 6.2%. This growth is attributed to the stringent hygiene standards and the critical need for effective odor management in these environments. Key players like Poly-America and Universal Plastic Bag Manufacturing are well-positioned to cater to these demands.
Scented Garbage Bags Product Developments
Product innovation in the scented garbage bags market is primarily focused on enhancing odor-neutralizing capabilities and improving material sustainability. Manufacturers are actively developing advanced scent-release technologies that provide long-lasting freshness without being overpowering. Simultaneously, significant research and development are channeled into creating more robust and compostable bioplastic formulations. Companies like BeyondGREEN biotech are at the forefront, offering innovative solutions that meet the dual demands of performance and environmental responsibility. These advancements provide a competitive edge by addressing evolving consumer preferences and regulatory pressures.
Challenges in the Scented Garbage Bags Market
The scented garbage bags market faces several challenges that could impact its growth trajectory. The cost of bioplastic raw materials remains higher than traditional Polyethylene (PE), posing a barrier to widespread adoption, particularly in price-sensitive markets. Fluctuations in the supply chain for these specialized materials can also lead to production disruptions and price volatility. Furthermore, varying regulatory landscapes across different countries regarding plastic waste and biodegradability can create complexities for global manufacturers. Intense competition from established players and the emergence of new entrants, coupled with evolving consumer perceptions about the necessity of scented bags, present ongoing competitive pressures. The perceived premium price for scented variants over standard garbage bags can also limit market penetration in certain demographics, with an estimated 15% of potential consumers citing price as a deterrent.
Forces Driving Scented Garbage Bags Growth
The scented garbage bags market is propelled by several key growth drivers. The increasing global emphasis on hygiene and sanitation, particularly in residential and institutional settings, is a primary catalyst. Rising consumer awareness of the benefits of odor control in maintaining a pleasant living and working environment is a significant factor. Technological advancements in odor-masking fragrances and advanced polymer science are leading to more effective and longer-lasting scented products. Furthermore, the growing demand for sustainable and eco-friendly products, driving the development and adoption of bioplastic scented garbage bags, is a crucial growth accelerator. Economic development and rising disposable incomes in emerging markets are also expanding the consumer base for premium household products.
Challenges in the Scented Garbage Bags Market
Long-term growth catalysts for the scented garbage bags market are intricately linked to continued innovation and market expansion. The development of novel, cost-effective bioplastic materials with superior biodegradability and performance will be critical for sustained market penetration. Strategic partnerships between raw material suppliers, manufacturers, and retailers can optimize distribution and product accessibility. Market expansion into developing economies, coupled with targeted marketing campaigns that educate consumers on the benefits of scented garbage bags for hygiene and odor management, will unlock new growth avenues. Furthermore, continuous research into advanced scent technologies that offer diverse and appealing fragrance profiles will cater to a broader consumer base and foster brand loyalty.
Emerging Opportunities in Scented Garbage Bags
Emerging opportunities in the scented garbage bags market lie in the burgeoning demand for customized and niche fragrance options, catering to specific consumer preferences and seasonal trends. The expansion of the bioplastic segment presents a significant opportunity, driven by increasing environmental consciousness and stringent regulations on conventional plastics. Innovations in smart waste management, where scented bags could potentially integrate with sensor technology for optimized disposal schedules, represent a future frontier. Furthermore, exploring new distribution channels, such as direct-to-consumer (DTC) online platforms and subscription models, can enhance market reach and customer engagement. The growing trend of "wellness at home" also creates an opportunity to position scented garbage bags as a contributor to a healthier and more pleasant living environment, with an estimated 20% growth potential in this sub-segment by 2030.
Leading Players in the Scented Garbage Bags Sector
- Berry Global
- Reynolds Consumer Products (Hefty)
- Poly-America
- Presto Products Company
- BeyondGREEN biotech
- Universal Plastic Bag Manufacturing
- American Plastic
- International Plastics
- Four Star Plastics
- American Plastics Company
- Harwal Group of Companies
- Blue Angel
- Glad
- KW Plastics
- LGLPAK
- Napco National
Key Milestones in Scented Garbage Bags Industry
- 2019: Increased consumer focus on household hygiene and odor control.
- 2020: Rise in demand for home-improvement products, including scented garbage bags, during global lockdowns.
- 2021: Growing awareness and investment in bioplastic alternatives for waste management.
- 2022: Introduction of advanced odor-neutralizing technologies by key manufacturers.
- 2023: Expansion of the institutional sector's adoption of scented garbage bags due to enhanced hygiene protocols.
- 2024: Significant marketing initiatives highlighting the health and aesthetic benefits of scented garbage bags.
- 2025 (Base Year): Projected market value of $2,500 million.
- 2026: Potential for new biodegradable formulations to gain significant market share.
- 2028: Expected increase in M&A activities for market consolidation and technological acquisition.
- 2030: Anticipated widespread adoption of bioplastic scented garbage bags.
- 2033 (End of Forecast Period): Projected market value of $4,200 million.
Strategic Outlook for Scented Garbage Bags Market
The strategic outlook for the scented garbage bags market is exceptionally positive, driven by sustained demand for enhanced household hygiene and odor control. Growth accelerators will include continuous innovation in bioplastic materials, focusing on cost-competitiveness and improved biodegradability to meet growing environmental mandates. Manufacturers should prioritize expanding their product portfolios to include a wider range of scents and specialized functionalities for different applications, particularly in the rapidly growing institutional sector. Strategic partnerships and potential acquisitions will be key for market players aiming to enhance their technological capabilities and broaden their geographical reach. The increasing consumer inclination towards premium, convenience-oriented products, coupled with rising disposable incomes globally, will continue to fuel market expansion, ensuring a promising future for this dynamic industry.
Scented Garbage Bags Segmentation
-
1. Application
- 1.1. Retail & Consumer
- 1.2. lnstitutional
- 1.3. lndustrial
-
2. Types
- 2.1. Polyethylene (PE)
- 2.2. Polypropylene(PP)
- 2.3. Bioplastic
Scented Garbage Bags Segmentation By Geography
-
1. North America
- 1.1. United States
- 1.2. Canada
- 1.3. Mexico
-
2. South America
- 2.1. Brazil
- 2.2. Argentina
- 2.3. Rest of South America
-
3. Europe
- 3.1. United Kingdom
- 3.2. Germany
- 3.3. France
- 3.4. Italy
- 3.5. Spain
- 3.6. Russia
- 3.7. Benelux
- 3.8. Nordics
- 3.9. Rest of Europe
-
4. Middle East & Africa
- 4.1. Turkey
- 4.2. Israel
- 4.3. GCC
- 4.4. North Africa
- 4.5. South Africa
- 4.6. Rest of Middle East & Africa
-
5. Asia Pacific
- 5.1. China
- 5.2. India
- 5.3. Japan
- 5.4. South Korea
- 5.5. ASEAN
- 5.6. Oceania
- 5.7. Rest of Asia Pacific
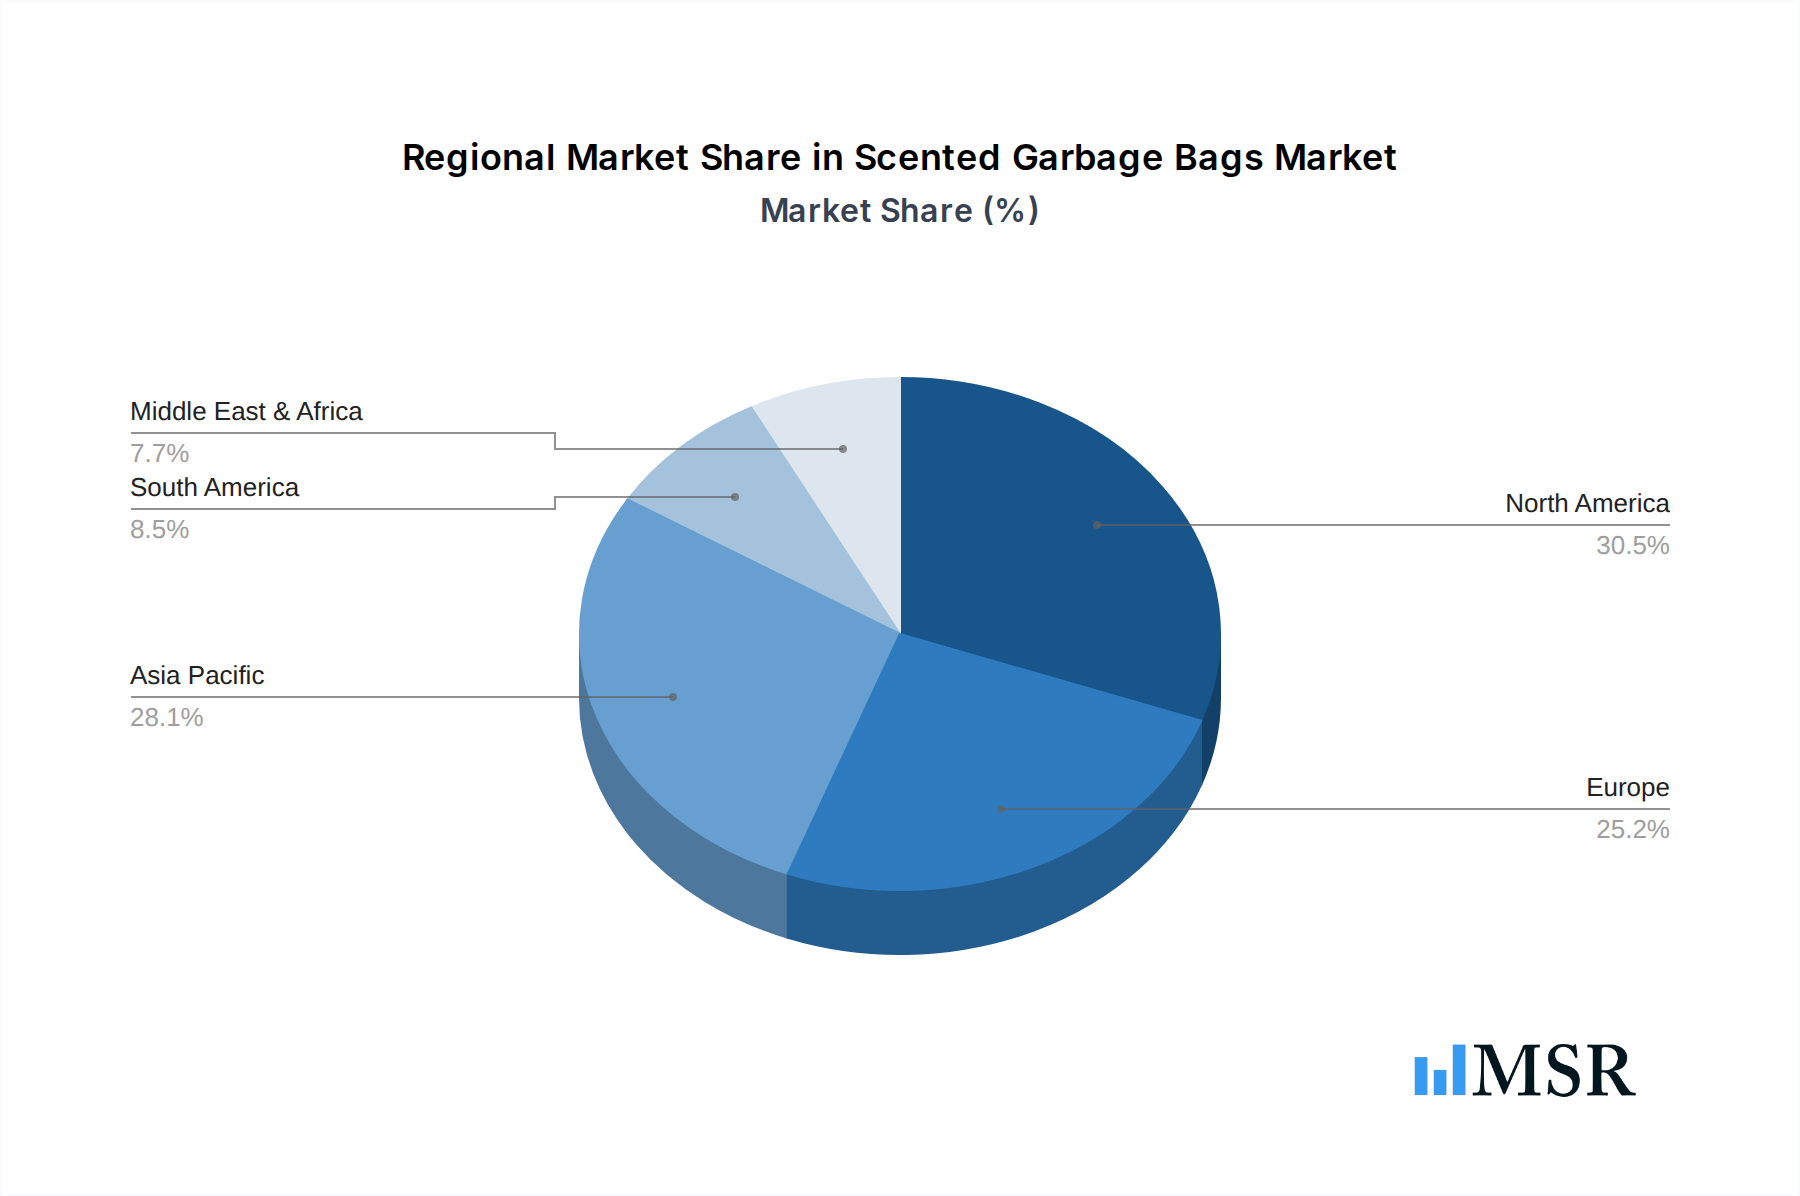
Scented Garbage Bags Regional Market Share
Geographic Coverage of Scented Garbage Bags
Scented Garbage Bags REPORT HIGHLIGHTS
| Aspects | Details |
|---|---|
| Study Period | 2020-2034 |
| Base Year | 2025 |
| Estimated Year | 2026 |
| Forecast Period | 2026-2034 |
| Historical Period | 2020-2025 |
| Growth Rate | CAGR of 3.5% from 2020-2034 |
| Segmentation |
|
Table of Contents
- 1. Introduction
- 1.1. Research Scope
- 1.2. Market Segmentation
- 1.3. Research Objective
- 1.4. Definitions and Assumptions
- 2. Executive Summary
- 2.1. Market Snapshot
- 3. Market Dynamics
- 3.1. Market Drivers
- 3.2. Market Restrains
- 3.3. Market Trends
- 3.4. Market Opportunities
- 4. Market Factor Analysis
- 4.1. Porters Five Forces
- 4.1.1. Bargaining Power of Suppliers
- 4.1.2. Bargaining Power of Buyers
- 4.1.3. Threat of New Entrants
- 4.1.4. Threat of Substitutes
- 4.1.5. Competitive Rivalry
- 4.2. PESTEL analysis
- 4.3. BCG Analysis
- 4.3.1. Stars (High Growth, High Market Share)
- 4.3.2. Cash Cows (Low Growth, High Market Share)
- 4.3.3. Question Mark (High Growth, Low Market Share)
- 4.3.4. Dogs (Low Growth, Low Market Share)
- 4.4. Ansoff Matrix Analysis
- 4.5. Supply Chain Analysis
- 4.6. Regulatory Landscape
- 4.7. Current Market Potential and Opportunity Assessment (TAM–SAM–SOM Framework)
- 4.8. MSR Analyst Note
- 4.1. Porters Five Forces
- 5. Market Analysis, Insights and Forecast 2021-2033
- 5.1. Market Analysis, Insights and Forecast - by Application
- 5.1.1. Retail & Consumer
- 5.1.2. lnstitutional
- 5.1.3. lndustrial
- 5.2. Market Analysis, Insights and Forecast - by Types
- 5.2.1. Polyethylene (PE)
- 5.2.2. Polypropylene(PP)
- 5.2.3. Bioplastic
- 5.3. Market Analysis, Insights and Forecast - by Region
- 5.3.1. North America
- 5.3.2. South America
- 5.3.3. Europe
- 5.3.4. Middle East & Africa
- 5.3.5. Asia Pacific
- 5.1. Market Analysis, Insights and Forecast - by Application
- 6. Global Scented Garbage Bags Analysis, Insights and Forecast, 2021-2033
- 6.1. Market Analysis, Insights and Forecast - by Application
- 6.1.1. Retail & Consumer
- 6.1.2. lnstitutional
- 6.1.3. lndustrial
- 6.2. Market Analysis, Insights and Forecast - by Types
- 6.2.1. Polyethylene (PE)
- 6.2.2. Polypropylene(PP)
- 6.2.3. Bioplastic
- 6.1. Market Analysis, Insights and Forecast - by Application
- 7. North America Scented Garbage Bags Analysis, Insights and Forecast, 2020-2032
- 7.1. Market Analysis, Insights and Forecast - by Application
- 7.1.1. Retail & Consumer
- 7.1.2. lnstitutional
- 7.1.3. lndustrial
- 7.2. Market Analysis, Insights and Forecast - by Types
- 7.2.1. Polyethylene (PE)
- 7.2.2. Polypropylene(PP)
- 7.2.3. Bioplastic
- 7.1. Market Analysis, Insights and Forecast - by Application
- 8. South America Scented Garbage Bags Analysis, Insights and Forecast, 2020-2032
- 8.1. Market Analysis, Insights and Forecast - by Application
- 8.1.1. Retail & Consumer
- 8.1.2. lnstitutional
- 8.1.3. lndustrial
- 8.2. Market Analysis, Insights and Forecast - by Types
- 8.2.1. Polyethylene (PE)
- 8.2.2. Polypropylene(PP)
- 8.2.3. Bioplastic
- 8.1. Market Analysis, Insights and Forecast - by Application
- 9. Europe Scented Garbage Bags Analysis, Insights and Forecast, 2020-2032
- 9.1. Market Analysis, Insights and Forecast - by Application
- 9.1.1. Retail & Consumer
- 9.1.2. lnstitutional
- 9.1.3. lndustrial
- 9.2. Market Analysis, Insights and Forecast - by Types
- 9.2.1. Polyethylene (PE)
- 9.2.2. Polypropylene(PP)
- 9.2.3. Bioplastic
- 9.1. Market Analysis, Insights and Forecast - by Application
- 10. Middle East & Africa Scented Garbage Bags Analysis, Insights and Forecast, 2020-2032
- 10.1. Market Analysis, Insights and Forecast - by Application
- 10.1.1. Retail & Consumer
- 10.1.2. lnstitutional
- 10.1.3. lndustrial
- 10.2. Market Analysis, Insights and Forecast - by Types
- 10.2.1. Polyethylene (PE)
- 10.2.2. Polypropylene(PP)
- 10.2.3. Bioplastic
- 10.1. Market Analysis, Insights and Forecast - by Application
- 11. Asia Pacific Scented Garbage Bags Analysis, Insights and Forecast, 2020-2032
- 11.1. Market Analysis, Insights and Forecast - by Application
- 11.1.1. Retail & Consumer
- 11.1.2. lnstitutional
- 11.1.3. lndustrial
- 11.2. Market Analysis, Insights and Forecast - by Types
- 11.2.1. Polyethylene (PE)
- 11.2.2. Polypropylene(PP)
- 11.2.3. Bioplastic
- 11.1. Market Analysis, Insights and Forecast - by Application
- 12. Competitive Analysis
- 12.1. Company Profiles
- 12.1.1 Berry Global
- 12.1.1.1. Company Overview
- 12.1.1.2. Products
- 12.1.1.3. Company Financials
- 12.1.1.4. SWOT Analysis
- 12.1.2 Reynolds Consumer Products (Hefty)
- 12.1.2.1. Company Overview
- 12.1.2.2. Products
- 12.1.2.3. Company Financials
- 12.1.2.4. SWOT Analysis
- 12.1.3 Poly-America
- 12.1.3.1. Company Overview
- 12.1.3.2. Products
- 12.1.3.3. Company Financials
- 12.1.3.4. SWOT Analysis
- 12.1.4 Presto Products Company
- 12.1.4.1. Company Overview
- 12.1.4.2. Products
- 12.1.4.3. Company Financials
- 12.1.4.4. SWOT Analysis
- 12.1.5 BeyondGREEN biotech
- 12.1.5.1. Company Overview
- 12.1.5.2. Products
- 12.1.5.3. Company Financials
- 12.1.5.4. SWOT Analysis
- 12.1.6 Universal Plastic Bag Manufacturing
- 12.1.6.1. Company Overview
- 12.1.6.2. Products
- 12.1.6.3. Company Financials
- 12.1.6.4. SWOT Analysis
- 12.1.7 American Plastic
- 12.1.7.1. Company Overview
- 12.1.7.2. Products
- 12.1.7.3. Company Financials
- 12.1.7.4. SWOT Analysis
- 12.1.8 lnternational Plastics
- 12.1.8.1. Company Overview
- 12.1.8.2. Products
- 12.1.8.3. Company Financials
- 12.1.8.4. SWOT Analysis
- 12.1.9 Four Star Plastics
- 12.1.9.1. Company Overview
- 12.1.9.2. Products
- 12.1.9.3. Company Financials
- 12.1.9.4. SWOT Analysis
- 12.1.10 American Plastics Company
- 12.1.10.1. Company Overview
- 12.1.10.2. Products
- 12.1.10.3. Company Financials
- 12.1.10.4. SWOT Analysis
- 12.1.11 Harwal Group of Companies
- 12.1.11.1. Company Overview
- 12.1.11.2. Products
- 12.1.11.3. Company Financials
- 12.1.11.4. SWOT Analysis
- 12.1.12 Blue Angel
- 12.1.12.1. Company Overview
- 12.1.12.2. Products
- 12.1.12.3. Company Financials
- 12.1.12.4. SWOT Analysis
- 12.1.13 Glad
- 12.1.13.1. Company Overview
- 12.1.13.2. Products
- 12.1.13.3. Company Financials
- 12.1.13.4. SWOT Analysis
- 12.1.14 KW Plastics
- 12.1.14.1. Company Overview
- 12.1.14.2. Products
- 12.1.14.3. Company Financials
- 12.1.14.4. SWOT Analysis
- 12.1.15 LGLPAK
- 12.1.15.1. Company Overview
- 12.1.15.2. Products
- 12.1.15.3. Company Financials
- 12.1.15.4. SWOT Analysis
- 12.1.16 Napco National
- 12.1.16.1. Company Overview
- 12.1.16.2. Products
- 12.1.16.3. Company Financials
- 12.1.16.4. SWOT Analysis
- 12.1.1 Berry Global
- 12.2. Market Entropy
- 12.2.1 Company's Key Areas Served
- 12.2.2 Recent Developments
- 12.3. Company Market Share Analysis 2025
- 12.3.1 Top 5 Companies Market Share Analysis
- 12.3.2 Top 3 Companies Market Share Analysis
- 12.4. List of Potential Customers
- 13. Research Methodology
List of Figures
- Figure 1: Global Scented Garbage Bags Revenue Breakdown (undefined, %) by Region 2025 & 2033
- Figure 2: Global Scented Garbage Bags Volume Breakdown (K, %) by Region 2025 & 2033
- Figure 3: North America Scented Garbage Bags Revenue (undefined), by Application 2025 & 2033
- Figure 4: North America Scented Garbage Bags Volume (K), by Application 2025 & 2033
- Figure 5: North America Scented Garbage Bags Revenue Share (%), by Application 2025 & 2033
- Figure 6: North America Scented Garbage Bags Volume Share (%), by Application 2025 & 2033
- Figure 7: North America Scented Garbage Bags Revenue (undefined), by Types 2025 & 2033
- Figure 8: North America Scented Garbage Bags Volume (K), by Types 2025 & 2033
- Figure 9: North America Scented Garbage Bags Revenue Share (%), by Types 2025 & 2033
- Figure 10: North America Scented Garbage Bags Volume Share (%), by Types 2025 & 2033
- Figure 11: North America Scented Garbage Bags Revenue (undefined), by Country 2025 & 2033
- Figure 12: North America Scented Garbage Bags Volume (K), by Country 2025 & 2033
- Figure 13: North America Scented Garbage Bags Revenue Share (%), by Country 2025 & 2033
- Figure 14: North America Scented Garbage Bags Volume Share (%), by Country 2025 & 2033
- Figure 15: South America Scented Garbage Bags Revenue (undefined), by Application 2025 & 2033
- Figure 16: South America Scented Garbage Bags Volume (K), by Application 2025 & 2033
- Figure 17: South America Scented Garbage Bags Revenue Share (%), by Application 2025 & 2033
- Figure 18: South America Scented Garbage Bags Volume Share (%), by Application 2025 & 2033
- Figure 19: South America Scented Garbage Bags Revenue (undefined), by Types 2025 & 2033
- Figure 20: South America Scented Garbage Bags Volume (K), by Types 2025 & 2033
- Figure 21: South America Scented Garbage Bags Revenue Share (%), by Types 2025 & 2033
- Figure 22: South America Scented Garbage Bags Volume Share (%), by Types 2025 & 2033
- Figure 23: South America Scented Garbage Bags Revenue (undefined), by Country 2025 & 2033
- Figure 24: South America Scented Garbage Bags Volume (K), by Country 2025 & 2033
- Figure 25: South America Scented Garbage Bags Revenue Share (%), by Country 2025 & 2033
- Figure 26: South America Scented Garbage Bags Volume Share (%), by Country 2025 & 2033
- Figure 27: Europe Scented Garbage Bags Revenue (undefined), by Application 2025 & 2033
- Figure 28: Europe Scented Garbage Bags Volume (K), by Application 2025 & 2033
- Figure 29: Europe Scented Garbage Bags Revenue Share (%), by Application 2025 & 2033
- Figure 30: Europe Scented Garbage Bags Volume Share (%), by Application 2025 & 2033
- Figure 31: Europe Scented Garbage Bags Revenue (undefined), by Types 2025 & 2033
- Figure 32: Europe Scented Garbage Bags Volume (K), by Types 2025 & 2033
- Figure 33: Europe Scented Garbage Bags Revenue Share (%), by Types 2025 & 2033
- Figure 34: Europe Scented Garbage Bags Volume Share (%), by Types 2025 & 2033
- Figure 35: Europe Scented Garbage Bags Revenue (undefined), by Country 2025 & 2033
- Figure 36: Europe Scented Garbage Bags Volume (K), by Country 2025 & 2033
- Figure 37: Europe Scented Garbage Bags Revenue Share (%), by Country 2025 & 2033
- Figure 38: Europe Scented Garbage Bags Volume Share (%), by Country 2025 & 2033
- Figure 39: Middle East & Africa Scented Garbage Bags Revenue (undefined), by Application 2025 & 2033
- Figure 40: Middle East & Africa Scented Garbage Bags Volume (K), by Application 2025 & 2033
- Figure 41: Middle East & Africa Scented Garbage Bags Revenue Share (%), by Application 2025 & 2033
- Figure 42: Middle East & Africa Scented Garbage Bags Volume Share (%), by Application 2025 & 2033
- Figure 43: Middle East & Africa Scented Garbage Bags Revenue (undefined), by Types 2025 & 2033
- Figure 44: Middle East & Africa Scented Garbage Bags Volume (K), by Types 2025 & 2033
- Figure 45: Middle East & Africa Scented Garbage Bags Revenue Share (%), by Types 2025 & 2033
- Figure 46: Middle East & Africa Scented Garbage Bags Volume Share (%), by Types 2025 & 2033
- Figure 47: Middle East & Africa Scented Garbage Bags Revenue (undefined), by Country 2025 & 2033
- Figure 48: Middle East & Africa Scented Garbage Bags Volume (K), by Country 2025 & 2033
- Figure 49: Middle East & Africa Scented Garbage Bags Revenue Share (%), by Country 2025 & 2033
- Figure 50: Middle East & Africa Scented Garbage Bags Volume Share (%), by Country 2025 & 2033
- Figure 51: Asia Pacific Scented Garbage Bags Revenue (undefined), by Application 2025 & 2033
- Figure 52: Asia Pacific Scented Garbage Bags Volume (K), by Application 2025 & 2033
- Figure 53: Asia Pacific Scented Garbage Bags Revenue Share (%), by Application 2025 & 2033
- Figure 54: Asia Pacific Scented Garbage Bags Volume Share (%), by Application 2025 & 2033
- Figure 55: Asia Pacific Scented Garbage Bags Revenue (undefined), by Types 2025 & 2033
- Figure 56: Asia Pacific Scented Garbage Bags Volume (K), by Types 2025 & 2033
- Figure 57: Asia Pacific Scented Garbage Bags Revenue Share (%), by Types 2025 & 2033
- Figure 58: Asia Pacific Scented Garbage Bags Volume Share (%), by Types 2025 & 2033
- Figure 59: Asia Pacific Scented Garbage Bags Revenue (undefined), by Country 2025 & 2033
- Figure 60: Asia Pacific Scented Garbage Bags Volume (K), by Country 2025 & 2033
- Figure 61: Asia Pacific Scented Garbage Bags Revenue Share (%), by Country 2025 & 2033
- Figure 62: Asia Pacific Scented Garbage Bags Volume Share (%), by Country 2025 & 2033
List of Tables
- Table 1: Global Scented Garbage Bags Revenue undefined Forecast, by Application 2020 & 2033
- Table 2: Global Scented Garbage Bags Volume K Forecast, by Application 2020 & 2033
- Table 3: Global Scented Garbage Bags Revenue undefined Forecast, by Types 2020 & 2033
- Table 4: Global Scented Garbage Bags Volume K Forecast, by Types 2020 & 2033
- Table 5: Global Scented Garbage Bags Revenue undefined Forecast, by Region 2020 & 2033
- Table 6: Global Scented Garbage Bags Volume K Forecast, by Region 2020 & 2033
- Table 7: Global Scented Garbage Bags Revenue undefined Forecast, by Application 2020 & 2033
- Table 8: Global Scented Garbage Bags Volume K Forecast, by Application 2020 & 2033
- Table 9: Global Scented Garbage Bags Revenue undefined Forecast, by Types 2020 & 2033
- Table 10: Global Scented Garbage Bags Volume K Forecast, by Types 2020 & 2033
- Table 11: Global Scented Garbage Bags Revenue undefined Forecast, by Country 2020 & 2033
- Table 12: Global Scented Garbage Bags Volume K Forecast, by Country 2020 & 2033
- Table 13: United States Scented Garbage Bags Revenue (undefined) Forecast, by Application 2020 & 2033
- Table 14: United States Scented Garbage Bags Volume (K) Forecast, by Application 2020 & 2033
- Table 15: Canada Scented Garbage Bags Revenue (undefined) Forecast, by Application 2020 & 2033
- Table 16: Canada Scented Garbage Bags Volume (K) Forecast, by Application 2020 & 2033
- Table 17: Mexico Scented Garbage Bags Revenue (undefined) Forecast, by Application 2020 & 2033
- Table 18: Mexico Scented Garbage Bags Volume (K) Forecast, by Application 2020 & 2033
- Table 19: Global Scented Garbage Bags Revenue undefined Forecast, by Application 2020 & 2033
- Table 20: Global Scented Garbage Bags Volume K Forecast, by Application 2020 & 2033
- Table 21: Global Scented Garbage Bags Revenue undefined Forecast, by Types 2020 & 2033
- Table 22: Global Scented Garbage Bags Volume K Forecast, by Types 2020 & 2033
- Table 23: Global Scented Garbage Bags Revenue undefined Forecast, by Country 2020 & 2033
- Table 24: Global Scented Garbage Bags Volume K Forecast, by Country 2020 & 2033
- Table 25: Brazil Scented Garbage Bags Revenue (undefined) Forecast, by Application 2020 & 2033
- Table 26: Brazil Scented Garbage Bags Volume (K) Forecast, by Application 2020 & 2033
- Table 27: Argentina Scented Garbage Bags Revenue (undefined) Forecast, by Application 2020 & 2033
- Table 28: Argentina Scented Garbage Bags Volume (K) Forecast, by Application 2020 & 2033
- Table 29: Rest of South America Scented Garbage Bags Revenue (undefined) Forecast, by Application 2020 & 2033
- Table 30: Rest of South America Scented Garbage Bags Volume (K) Forecast, by Application 2020 & 2033
- Table 31: Global Scented Garbage Bags Revenue undefined Forecast, by Application 2020 & 2033
- Table 32: Global Scented Garbage Bags Volume K Forecast, by Application 2020 & 2033
- Table 33: Global Scented Garbage Bags Revenue undefined Forecast, by Types 2020 & 2033
- Table 34: Global Scented Garbage Bags Volume K Forecast, by Types 2020 & 2033
- Table 35: Global Scented Garbage Bags Revenue undefined Forecast, by Country 2020 & 2033
- Table 36: Global Scented Garbage Bags Volume K Forecast, by Country 2020 & 2033
- Table 37: United Kingdom Scented Garbage Bags Revenue (undefined) Forecast, by Application 2020 & 2033
- Table 38: United Kingdom Scented Garbage Bags Volume (K) Forecast, by Application 2020 & 2033
- Table 39: Germany Scented Garbage Bags Revenue (undefined) Forecast, by Application 2020 & 2033
- Table 40: Germany Scented Garbage Bags Volume (K) Forecast, by Application 2020 & 2033
- Table 41: France Scented Garbage Bags Revenue (undefined) Forecast, by Application 2020 & 2033
- Table 42: France Scented Garbage Bags Volume (K) Forecast, by Application 2020 & 2033
- Table 43: Italy Scented Garbage Bags Revenue (undefined) Forecast, by Application 2020 & 2033
- Table 44: Italy Scented Garbage Bags Volume (K) Forecast, by Application 2020 & 2033
- Table 45: Spain Scented Garbage Bags Revenue (undefined) Forecast, by Application 2020 & 2033
- Table 46: Spain Scented Garbage Bags Volume (K) Forecast, by Application 2020 & 2033
- Table 47: Russia Scented Garbage Bags Revenue (undefined) Forecast, by Application 2020 & 2033
- Table 48: Russia Scented Garbage Bags Volume (K) Forecast, by Application 2020 & 2033
- Table 49: Benelux Scented Garbage Bags Revenue (undefined) Forecast, by Application 2020 & 2033
- Table 50: Benelux Scented Garbage Bags Volume (K) Forecast, by Application 2020 & 2033
- Table 51: Nordics Scented Garbage Bags Revenue (undefined) Forecast, by Application 2020 & 2033
- Table 52: Nordics Scented Garbage Bags Volume (K) Forecast, by Application 2020 & 2033
- Table 53: Rest of Europe Scented Garbage Bags Revenue (undefined) Forecast, by Application 2020 & 2033
- Table 54: Rest of Europe Scented Garbage Bags Volume (K) Forecast, by Application 2020 & 2033
- Table 55: Global Scented Garbage Bags Revenue undefined Forecast, by Application 2020 & 2033
- Table 56: Global Scented Garbage Bags Volume K Forecast, by Application 2020 & 2033
- Table 57: Global Scented Garbage Bags Revenue undefined Forecast, by Types 2020 & 2033
- Table 58: Global Scented Garbage Bags Volume K Forecast, by Types 2020 & 2033
- Table 59: Global Scented Garbage Bags Revenue undefined Forecast, by Country 2020 & 2033
- Table 60: Global Scented Garbage Bags Volume K Forecast, by Country 2020 & 2033
- Table 61: Turkey Scented Garbage Bags Revenue (undefined) Forecast, by Application 2020 & 2033
- Table 62: Turkey Scented Garbage Bags Volume (K) Forecast, by Application 2020 & 2033
- Table 63: Israel Scented Garbage Bags Revenue (undefined) Forecast, by Application 2020 & 2033
- Table 64: Israel Scented Garbage Bags Volume (K) Forecast, by Application 2020 & 2033
- Table 65: GCC Scented Garbage Bags Revenue (undefined) Forecast, by Application 2020 & 2033
- Table 66: GCC Scented Garbage Bags Volume (K) Forecast, by Application 2020 & 2033
- Table 67: North Africa Scented Garbage Bags Revenue (undefined) Forecast, by Application 2020 & 2033
- Table 68: North Africa Scented Garbage Bags Volume (K) Forecast, by Application 2020 & 2033
- Table 69: South Africa Scented Garbage Bags Revenue (undefined) Forecast, by Application 2020 & 2033
- Table 70: South Africa Scented Garbage Bags Volume (K) Forecast, by Application 2020 & 2033
- Table 71: Rest of Middle East & Africa Scented Garbage Bags Revenue (undefined) Forecast, by Application 2020 & 2033
- Table 72: Rest of Middle East & Africa Scented Garbage Bags Volume (K) Forecast, by Application 2020 & 2033
- Table 73: Global Scented Garbage Bags Revenue undefined Forecast, by Application 2020 & 2033
- Table 74: Global Scented Garbage Bags Volume K Forecast, by Application 2020 & 2033
- Table 75: Global Scented Garbage Bags Revenue undefined Forecast, by Types 2020 & 2033
- Table 76: Global Scented Garbage Bags Volume K Forecast, by Types 2020 & 2033
- Table 77: Global Scented Garbage Bags Revenue undefined Forecast, by Country 2020 & 2033
- Table 78: Global Scented Garbage Bags Volume K Forecast, by Country 2020 & 2033
- Table 79: China Scented Garbage Bags Revenue (undefined) Forecast, by Application 2020 & 2033
- Table 80: China Scented Garbage Bags Volume (K) Forecast, by Application 2020 & 2033
- Table 81: India Scented Garbage Bags Revenue (undefined) Forecast, by Application 2020 & 2033
- Table 82: India Scented Garbage Bags Volume (K) Forecast, by Application 2020 & 2033
- Table 83: Japan Scented Garbage Bags Revenue (undefined) Forecast, by Application 2020 & 2033
- Table 84: Japan Scented Garbage Bags Volume (K) Forecast, by Application 2020 & 2033
- Table 85: South Korea Scented Garbage Bags Revenue (undefined) Forecast, by Application 2020 & 2033
- Table 86: South Korea Scented Garbage Bags Volume (K) Forecast, by Application 2020 & 2033
- Table 87: ASEAN Scented Garbage Bags Revenue (undefined) Forecast, by Application 2020 & 2033
- Table 88: ASEAN Scented Garbage Bags Volume (K) Forecast, by Application 2020 & 2033
- Table 89: Oceania Scented Garbage Bags Revenue (undefined) Forecast, by Application 2020 & 2033
- Table 90: Oceania Scented Garbage Bags Volume (K) Forecast, by Application 2020 & 2033
- Table 91: Rest of Asia Pacific Scented Garbage Bags Revenue (undefined) Forecast, by Application 2020 & 2033
- Table 92: Rest of Asia Pacific Scented Garbage Bags Volume (K) Forecast, by Application 2020 & 2033
Frequently Asked Questions
1. What is the projected Compound Annual Growth Rate (CAGR) of the Scented Garbage Bags?
The projected CAGR is approximately 3.5%.
2. Which companies are prominent players in the Scented Garbage Bags?
Key companies in the market include Berry Global, Reynolds Consumer Products (Hefty), Poly-America, Presto Products Company, BeyondGREEN biotech, Universal Plastic Bag Manufacturing, American Plastic, lnternational Plastics, Four Star Plastics, American Plastics Company, Harwal Group of Companies, Blue Angel, Glad, KW Plastics, LGLPAK, Napco National.
3. What are the main segments of the Scented Garbage Bags?
The market segments include Application, Types.
4. Can you provide details about the market size?
The market size is estimated to be USD XXX N/A as of 2022.
5. What are some drivers contributing to market growth?
N/A
6. What are the notable trends driving market growth?
N/A
7. Are there any restraints impacting market growth?
N/A
8. Can you provide examples of recent developments in the market?
N/A
9. What pricing options are available for accessing the report?
Pricing options include single-user, multi-user, and enterprise licenses priced at USD 3950.00, USD 5925.00, and USD 7900.00 respectively.
10. Is the market size provided in terms of value or volume?
The market size is provided in terms of value, measured in N/A and volume, measured in K.
11. Are there any specific market keywords associated with the report?
Yes, the market keyword associated with the report is "Scented Garbage Bags," which aids in identifying and referencing the specific market segment covered.
12. How do I determine which pricing option suits my needs best?
The pricing options vary based on user requirements and access needs. Individual users may opt for single-user licenses, while businesses requiring broader access may choose multi-user or enterprise licenses for cost-effective access to the report.
13. Are there any additional resources or data provided in the Scented Garbage Bags report?
While the report offers comprehensive insights, it's advisable to review the specific contents or supplementary materials provided to ascertain if additional resources or data are available.
14. How can I stay updated on further developments or reports in the Scented Garbage Bags?
To stay informed about further developments, trends, and reports in the Scented Garbage Bags, consider subscribing to industry newsletters, following relevant companies and organizations, or regularly checking reputable industry news sources and publications.
Methodology
Step 1 - Identification of Relevant Samples Size from Population Database


Step 2 - Approaches for Defining Global Market Size (Value, Volume* & Price*)

Note*: In applicable scenarios
Step 3 - Data Sources
Primary Research
- Web Analytics
- Survey Reports
- Research Institute
- Latest Research Reports
- Opinion Leaders
Secondary Research
- Annual Reports
- White Paper
- Latest Press Release
- Industry Association
- Paid Database
- Investor Presentations

Step 4 - Data Triangulation
Involves using different sources of information in order to increase the validity of a study
These sources are likely to be stakeholders in a program - participants, other researchers, program staff, other community members, and so on.
Then we put all data in single framework & apply various statistical tools to find out the dynamic on the market.
During the analysis stage, feedback from the stakeholder groups would be compared to determine areas of agreement as well as areas of divergence