

Key Insights
The B2B smart augmented reality (AR) glasses market is experiencing robust growth, driven by increasing adoption across diverse industries. The market's expansion is fueled by several key factors. Firstly, the enhanced productivity and efficiency AR glasses offer are proving invaluable in sectors like manufacturing, logistics, and healthcare. Real-time data overlays, remote expert assistance, and improved training capabilities are significantly boosting operational efficiency and reducing errors. Secondly, technological advancements are leading to more compact, comfortable, and affordable devices, making them accessible to a broader range of businesses. Improved battery life, enhanced processing power, and better display quality are all contributing to increased market appeal. Finally, the rise of 5G networks is enabling seamless data transmission and facilitating the development of more sophisticated AR applications, further driving market penetration. We estimate the current market size to be approximately $2 billion, with a Compound Annual Growth Rate (CAGR) of 25% projected through 2033. This implies a market value exceeding $10 billion by the end of the forecast period.
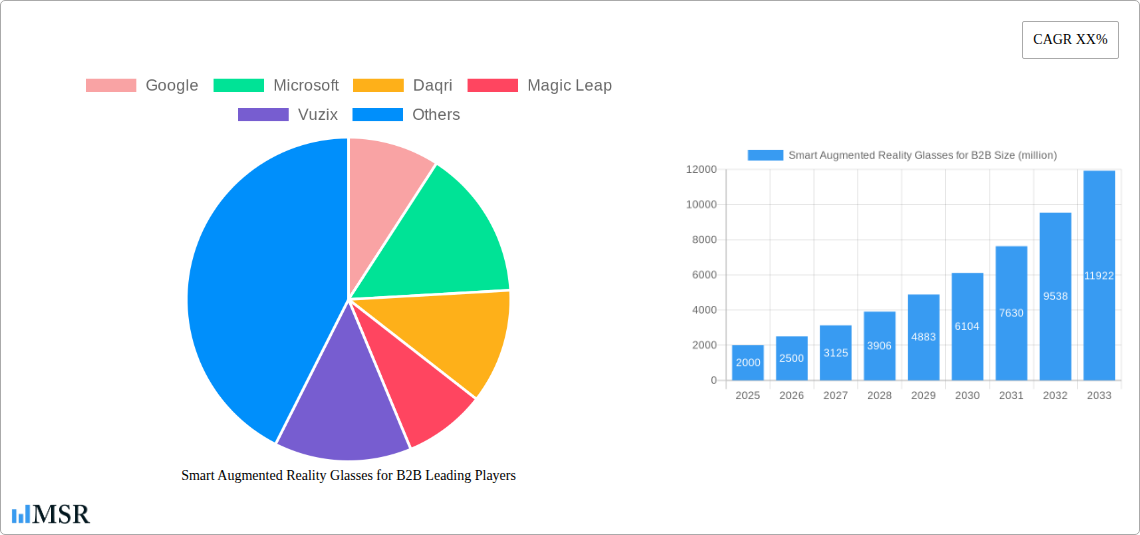
Smart Augmented Reality Glasses for B2B Market Size (In Billion)
Despite the positive outlook, challenges remain. The high initial cost of AR glasses and the need for robust supporting infrastructure (including software and training) represent significant barriers to entry for some businesses. Moreover, concerns surrounding data privacy and security, along with the potential for employee resistance to new technologies, need to be addressed for widespread adoption. However, ongoing innovation and decreasing production costs are gradually mitigating these challenges. Key players like Google, Microsoft, and Vuzix are investing heavily in research and development, creating a competitive landscape that benefits consumers with a wider variety of options and improved affordability. This competitive market dynamic, combined with the substantial productivity benefits, positions the B2B smart AR glasses market for continued, significant growth in the coming years.
Smart Augmented Reality Glasses for B2B Company Market Share
Smart Augmented Reality (AR) Glasses for B2B: A Comprehensive Market Report (2019-2033)
This comprehensive report provides an in-depth analysis of the burgeoning Smart Augmented Reality (AR) Glasses market for Business-to-Business (B2B) applications, projecting a market valuation exceeding $xx million by 2033. The report covers the period from 2019 to 2033, with a focus on the 2025-2033 forecast period and a base year of 2025. It offers actionable insights for industry stakeholders, investors, and businesses seeking to navigate this rapidly evolving landscape. Key players like Google, Microsoft, Daqri, Magic Leap, Vuzix, RealWear, Nreal, Rokid, Kopin, and Shadow Creator are analyzed, along with key market segments and technological trends shaping future growth.
Smart Augmented Reality Glasses for B2B Market Concentration & Dynamics
The B2B smart AR glasses market exhibits a moderately concentrated structure, with a few key players holding significant market share. However, the landscape is dynamic, influenced by continuous innovation, strategic mergers and acquisitions (M&A), and evolving regulatory frameworks. The study period (2019-2024) witnessed approximately xx M&A deals, primarily driven by the desire to secure intellectual property, expand product portfolios, and access new markets. Major players are focusing on partnerships to leverage complementary technologies and expertise. Substitute products, such as traditional wearable computing devices and specialized software solutions, pose a competitive threat, but the unique capabilities of AR glasses continue to drive market adoption. End-user trends indicate a preference for lightweight, durable, and user-friendly devices with enhanced features such as improved battery life and better connectivity.
- Market Share (2024): Google (xx%), Microsoft (xx%), Vuzix (xx%), Others (xx%)
- M&A Deal Count (2019-2024): xx
- Key Market Drivers: Innovation in display technology, improved computing power, increasing demand for remote assistance solutions.
Smart Augmented Reality Glasses for B2B Industry Insights & Trends
The global B2B smart AR glasses market is experiencing significant growth, projected to reach $xx million in 2025 and $xx million by 2033, representing a Compound Annual Growth Rate (CAGR) of xx%. Several factors contribute to this expansion, including the increasing adoption of Industry 4.0 technologies, the growing demand for hands-free solutions across various industries, and the rising need for enhanced worker productivity and safety. Technological advancements, particularly in areas like improved battery life, lighter weight designs, and enhanced processing capabilities, are disrupting the market and creating new opportunities. Consumer behavior is evolving towards seamless integration of AR glasses into existing workflows.
Key Markets & Segments Leading Smart Augmented Reality Glasses for B2B
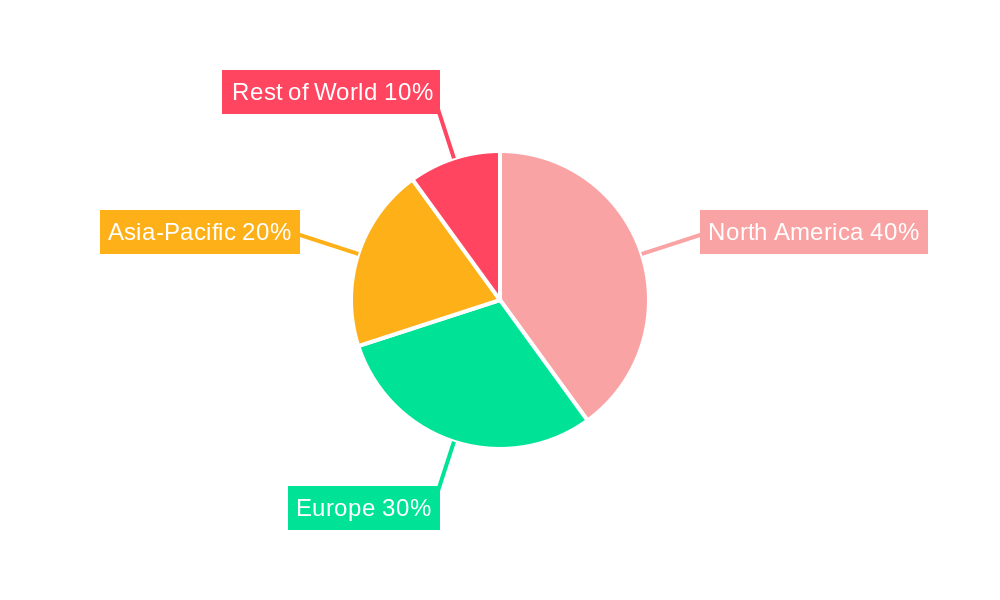
The North American region currently holds the dominant position in the B2B smart AR glasses market, driven by robust technological infrastructure, significant investments in R&D, and early adoption by several industries. European and Asian markets are exhibiting rapid growth, spurred by the increasing adoption of digital technologies and industrial automation. The manufacturing, healthcare, and logistics sectors are key segments driving market demand.
- North America Dominance Drivers:
- Strong technological infrastructure and high R&D investment.
- Early adoption of AR technologies by various industries.
- Large and well-established B2B market.
- Europe and Asia Growth Drivers:
- Increasing focus on industrial automation and digital transformation.
- Expanding middle class and rising disposable incomes.
- Favorable government policies and regulations.
Smart Augmented Reality Glasses for B2B Product Developments
Recent product innovations focus on enhancing processing power, improving display quality, and improving battery life. Applications are expanding to encompass diverse fields, such as remote assistance, training, navigation, and data visualization. The key competitive edge lies in offering seamless integration with existing business workflows, robust data security, and user-friendly interfaces.
Challenges in the Smart Augmented Reality Glasses for B2B Market
The B2B smart AR glasses market faces challenges such as high initial costs, concerns about data privacy and security, limited battery life, and the complexity of integrating these devices into existing workflows. Supply chain disruptions can impact availability, while intense competition from established and emerging players creates pressure on pricing and margins. Regulatory hurdles vary by region, creating complexities for global market expansion. These factors collectively hinder the widespread adoption of AR glasses.
Forces Driving Smart Augmented Reality Glasses for B2B Growth
Technological advancements (miniaturization, improved processing power), economic incentives for increased productivity, and regulatory support (incentives for Industry 4.0 adoption) are key growth drivers. Government initiatives aimed at digital transformation, coupled with the increasing demand for remote collaboration and improved worker safety, contribute significantly to market expansion. Examples include government funding for AR research and development.
Long-Term Growth Catalysts in the Smart Augmented Reality Glasses for B2B Market
Long-term growth hinges on continuous innovation in display technology, improved battery life, and enhanced processing power. Strategic partnerships between hardware and software companies will facilitate seamless integration and expanded functionalities. Expansion into new markets, such as construction and energy, will fuel further growth.
Emerging Opportunities in Smart Augmented Reality Glasses for B2B
Emerging opportunities lie in the integration of AR glasses with AI-powered analytics and IoT devices. This creates potential for enhanced data visualization, predictive maintenance, and autonomous operations. New markets such as healthcare and education are ripe for disruption with AR-enhanced training and remote diagnosis solutions. The development of lighter, more comfortable glasses with longer battery life will also attract more users.
Key Milestones in Smart Augmented Reality Glasses for B2B Industry
- 2020: Microsoft launches HoloLens 2, enhancing enterprise AR applications.
- 2021: Vuzix expands its M400 smart glasses line with improved features.
- 2022: Google introduces new AR glasses prototypes focused on improved user experience.
- 2023: Significant investments in AR technology from various companies worldwide.
- 2024: Several mergers and acquisitions among key players reshape the competitive landscape.
Strategic Outlook for Smart Augmented Reality Glasses for B2B Market
The future of the B2B smart AR glasses market is bright. Continuous technological advancements, increasing adoption across diverse sectors, and strategic partnerships will accelerate market growth. Companies that focus on user experience, data security, and seamless integration with existing workflows will gain a competitive edge. The market's potential for transforming various industries is immense, presenting significant opportunities for innovation and substantial returns.
Smart Augmented Reality Glasses for B2B Segmentation
-
1. Application
- 1.1. Military
- 1.2. Medical
- 1.3. Logistics
- 1.4. Education
- 1.5. Games
- 1.6. Others
-
2. Types
- 2.1. Monocular AR Glasses
- 2.2. Binocular AR Glasses
Smart Augmented Reality Glasses for B2B Segmentation By Geography
-
1. North America
- 1.1. United States
- 1.2. Canada
- 1.3. Mexico
-
2. South America
- 2.1. Brazil
- 2.2. Argentina
- 2.3. Rest of South America
-
3. Europe
- 3.1. United Kingdom
- 3.2. Germany
- 3.3. France
- 3.4. Italy
- 3.5. Spain
- 3.6. Russia
- 3.7. Benelux
- 3.8. Nordics
- 3.9. Rest of Europe
-
4. Middle East & Africa
- 4.1. Turkey
- 4.2. Israel
- 4.3. GCC
- 4.4. North Africa
- 4.5. South Africa
- 4.6. Rest of Middle East & Africa
-
5. Asia Pacific
- 5.1. China
- 5.2. India
- 5.3. Japan
- 5.4. South Korea
- 5.5. ASEAN
- 5.6. Oceania
- 5.7. Rest of Asia Pacific
Smart Augmented Reality Glasses for B2B Regional Market Share
Geographic Coverage of Smart Augmented Reality Glasses for B2B
Smart Augmented Reality Glasses for B2B REPORT HIGHLIGHTS
| Aspects | Details |
|---|---|
| Study Period | 2020-2034 |
| Base Year | 2025 |
| Estimated Year | 2026 |
| Forecast Period | 2026-2034 |
| Historical Period | 2020-2025 |
| Growth Rate | CAGR of XX% from 2020-2034 |
| Segmentation |
|
Table of Contents
- 1. Introduction
- 1.1. Research Scope
- 1.2. Market Segmentation
- 1.3. Research Objective
- 1.4. Definitions and Assumptions
- 2. Executive Summary
- 2.1. Market Snapshot
- 3. Market Dynamics
- 3.1. Market Drivers
- 3.2. Market Restrains
- 3.3. Market Trends
- 3.4. Market Opportunities
- 4. Market Factor Analysis
- 4.1. Porters Five Forces
- 4.1.1. Bargaining Power of Suppliers
- 4.1.2. Bargaining Power of Buyers
- 4.1.3. Threat of New Entrants
- 4.1.4. Threat of Substitutes
- 4.1.5. Competitive Rivalry
- 4.2. PESTEL analysis
- 4.3. BCG Analysis
- 4.3.1. Stars (High Growth, High Market Share)
- 4.3.2. Cash Cows (Low Growth, High Market Share)
- 4.3.3. Question Mark (High Growth, Low Market Share)
- 4.3.4. Dogs (Low Growth, Low Market Share)
- 4.4. Ansoff Matrix Analysis
- 4.5. Supply Chain Analysis
- 4.6. Regulatory Landscape
- 4.7. Current Market Potential and Opportunity Assessment (TAM–SAM–SOM Framework)
- 4.8. MSR Analyst Note
- 4.1. Porters Five Forces
- 5. Market Analysis, Insights and Forecast 2021-2033
- 5.1. Market Analysis, Insights and Forecast - by Application
- 5.1.1. Military
- 5.1.2. Medical
- 5.1.3. Logistics
- 5.1.4. Education
- 5.1.5. Games
- 5.1.6. Others
- 5.2. Market Analysis, Insights and Forecast - by Types
- 5.2.1. Monocular AR Glasses
- 5.2.2. Binocular AR Glasses
- 5.3. Market Analysis, Insights and Forecast - by Region
- 5.3.1. North America
- 5.3.2. South America
- 5.3.3. Europe
- 5.3.4. Middle East & Africa
- 5.3.5. Asia Pacific
- 5.1. Market Analysis, Insights and Forecast - by Application
- 6. Global Smart Augmented Reality Glasses for B2B Analysis, Insights and Forecast, 2021-2033
- 6.1. Market Analysis, Insights and Forecast - by Application
- 6.1.1. Military
- 6.1.2. Medical
- 6.1.3. Logistics
- 6.1.4. Education
- 6.1.5. Games
- 6.1.6. Others
- 6.2. Market Analysis, Insights and Forecast - by Types
- 6.2.1. Monocular AR Glasses
- 6.2.2. Binocular AR Glasses
- 6.1. Market Analysis, Insights and Forecast - by Application
- 7. North America Smart Augmented Reality Glasses for B2B Analysis, Insights and Forecast, 2020-2032
- 7.1. Market Analysis, Insights and Forecast - by Application
- 7.1.1. Military
- 7.1.2. Medical
- 7.1.3. Logistics
- 7.1.4. Education
- 7.1.5. Games
- 7.1.6. Others
- 7.2. Market Analysis, Insights and Forecast - by Types
- 7.2.1. Monocular AR Glasses
- 7.2.2. Binocular AR Glasses
- 7.1. Market Analysis, Insights and Forecast - by Application
- 8. South America Smart Augmented Reality Glasses for B2B Analysis, Insights and Forecast, 2020-2032
- 8.1. Market Analysis, Insights and Forecast - by Application
- 8.1.1. Military
- 8.1.2. Medical
- 8.1.3. Logistics
- 8.1.4. Education
- 8.1.5. Games
- 8.1.6. Others
- 8.2. Market Analysis, Insights and Forecast - by Types
- 8.2.1. Monocular AR Glasses
- 8.2.2. Binocular AR Glasses
- 8.1. Market Analysis, Insights and Forecast - by Application
- 9. Europe Smart Augmented Reality Glasses for B2B Analysis, Insights and Forecast, 2020-2032
- 9.1. Market Analysis, Insights and Forecast - by Application
- 9.1.1. Military
- 9.1.2. Medical
- 9.1.3. Logistics
- 9.1.4. Education
- 9.1.5. Games
- 9.1.6. Others
- 9.2. Market Analysis, Insights and Forecast - by Types
- 9.2.1. Monocular AR Glasses
- 9.2.2. Binocular AR Glasses
- 9.1. Market Analysis, Insights and Forecast - by Application
- 10. Middle East & Africa Smart Augmented Reality Glasses for B2B Analysis, Insights and Forecast, 2020-2032
- 10.1. Market Analysis, Insights and Forecast - by Application
- 10.1.1. Military
- 10.1.2. Medical
- 10.1.3. Logistics
- 10.1.4. Education
- 10.1.5. Games
- 10.1.6. Others
- 10.2. Market Analysis, Insights and Forecast - by Types
- 10.2.1. Monocular AR Glasses
- 10.2.2. Binocular AR Glasses
- 10.1. Market Analysis, Insights and Forecast - by Application
- 11. Asia Pacific Smart Augmented Reality Glasses for B2B Analysis, Insights and Forecast, 2020-2032
- 11.1. Market Analysis, Insights and Forecast - by Application
- 11.1.1. Military
- 11.1.2. Medical
- 11.1.3. Logistics
- 11.1.4. Education
- 11.1.5. Games
- 11.1.6. Others
- 11.2. Market Analysis, Insights and Forecast - by Types
- 11.2.1. Monocular AR Glasses
- 11.2.2. Binocular AR Glasses
- 11.1. Market Analysis, Insights and Forecast - by Application
- 12. Competitive Analysis
- 12.1. Company Profiles
- 12.1.1 Google
- 12.1.1.1. Company Overview
- 12.1.1.2. Products
- 12.1.1.3. Company Financials
- 12.1.1.4. SWOT Analysis
- 12.1.2 Microsoft
- 12.1.2.1. Company Overview
- 12.1.2.2. Products
- 12.1.2.3. Company Financials
- 12.1.2.4. SWOT Analysis
- 12.1.3 Daqri
- 12.1.3.1. Company Overview
- 12.1.3.2. Products
- 12.1.3.3. Company Financials
- 12.1.3.4. SWOT Analysis
- 12.1.4 Magic Leap
- 12.1.4.1. Company Overview
- 12.1.4.2. Products
- 12.1.4.3. Company Financials
- 12.1.4.4. SWOT Analysis
- 12.1.5 Vuzix
- 12.1.5.1. Company Overview
- 12.1.5.2. Products
- 12.1.5.3. Company Financials
- 12.1.5.4. SWOT Analysis
- 12.1.6 RealWear
- 12.1.6.1. Company Overview
- 12.1.6.2. Products
- 12.1.6.3. Company Financials
- 12.1.6.4. SWOT Analysis
- 12.1.7 Nreal
- 12.1.7.1. Company Overview
- 12.1.7.2. Products
- 12.1.7.3. Company Financials
- 12.1.7.4. SWOT Analysis
- 12.1.8 Rokid
- 12.1.8.1. Company Overview
- 12.1.8.2. Products
- 12.1.8.3. Company Financials
- 12.1.8.4. SWOT Analysis
- 12.1.9 Kopin
- 12.1.9.1. Company Overview
- 12.1.9.2. Products
- 12.1.9.3. Company Financials
- 12.1.9.4. SWOT Analysis
- 12.1.10 Shadow Creator
- 12.1.10.1. Company Overview
- 12.1.10.2. Products
- 12.1.10.3. Company Financials
- 12.1.10.4. SWOT Analysis
- 12.1.1 Google
- 12.2. Market Entropy
- 12.2.1 Company's Key Areas Served
- 12.2.2 Recent Developments
- 12.3. Company Market Share Analysis 2025
- 12.3.1 Top 5 Companies Market Share Analysis
- 12.3.2 Top 3 Companies Market Share Analysis
- 12.4. List of Potential Customers
- 13. Research Methodology
List of Figures
- Figure 1: Global Smart Augmented Reality Glasses for B2B Revenue Breakdown (million, %) by Region 2025 & 2033
- Figure 2: Global Smart Augmented Reality Glasses for B2B Volume Breakdown (K, %) by Region 2025 & 2033
- Figure 3: North America Smart Augmented Reality Glasses for B2B Revenue (million), by Application 2025 & 2033
- Figure 4: North America Smart Augmented Reality Glasses for B2B Volume (K), by Application 2025 & 2033
- Figure 5: North America Smart Augmented Reality Glasses for B2B Revenue Share (%), by Application 2025 & 2033
- Figure 6: North America Smart Augmented Reality Glasses for B2B Volume Share (%), by Application 2025 & 2033
- Figure 7: North America Smart Augmented Reality Glasses for B2B Revenue (million), by Types 2025 & 2033
- Figure 8: North America Smart Augmented Reality Glasses for B2B Volume (K), by Types 2025 & 2033
- Figure 9: North America Smart Augmented Reality Glasses for B2B Revenue Share (%), by Types 2025 & 2033
- Figure 10: North America Smart Augmented Reality Glasses for B2B Volume Share (%), by Types 2025 & 2033
- Figure 11: North America Smart Augmented Reality Glasses for B2B Revenue (million), by Country 2025 & 2033
- Figure 12: North America Smart Augmented Reality Glasses for B2B Volume (K), by Country 2025 & 2033
- Figure 13: North America Smart Augmented Reality Glasses for B2B Revenue Share (%), by Country 2025 & 2033
- Figure 14: North America Smart Augmented Reality Glasses for B2B Volume Share (%), by Country 2025 & 2033
- Figure 15: South America Smart Augmented Reality Glasses for B2B Revenue (million), by Application 2025 & 2033
- Figure 16: South America Smart Augmented Reality Glasses for B2B Volume (K), by Application 2025 & 2033
- Figure 17: South America Smart Augmented Reality Glasses for B2B Revenue Share (%), by Application 2025 & 2033
- Figure 18: South America Smart Augmented Reality Glasses for B2B Volume Share (%), by Application 2025 & 2033
- Figure 19: South America Smart Augmented Reality Glasses for B2B Revenue (million), by Types 2025 & 2033
- Figure 20: South America Smart Augmented Reality Glasses for B2B Volume (K), by Types 2025 & 2033
- Figure 21: South America Smart Augmented Reality Glasses for B2B Revenue Share (%), by Types 2025 & 2033
- Figure 22: South America Smart Augmented Reality Glasses for B2B Volume Share (%), by Types 2025 & 2033
- Figure 23: South America Smart Augmented Reality Glasses for B2B Revenue (million), by Country 2025 & 2033
- Figure 24: South America Smart Augmented Reality Glasses for B2B Volume (K), by Country 2025 & 2033
- Figure 25: South America Smart Augmented Reality Glasses for B2B Revenue Share (%), by Country 2025 & 2033
- Figure 26: South America Smart Augmented Reality Glasses for B2B Volume Share (%), by Country 2025 & 2033
- Figure 27: Europe Smart Augmented Reality Glasses for B2B Revenue (million), by Application 2025 & 2033
- Figure 28: Europe Smart Augmented Reality Glasses for B2B Volume (K), by Application 2025 & 2033
- Figure 29: Europe Smart Augmented Reality Glasses for B2B Revenue Share (%), by Application 2025 & 2033
- Figure 30: Europe Smart Augmented Reality Glasses for B2B Volume Share (%), by Application 2025 & 2033
- Figure 31: Europe Smart Augmented Reality Glasses for B2B Revenue (million), by Types 2025 & 2033
- Figure 32: Europe Smart Augmented Reality Glasses for B2B Volume (K), by Types 2025 & 2033
- Figure 33: Europe Smart Augmented Reality Glasses for B2B Revenue Share (%), by Types 2025 & 2033
- Figure 34: Europe Smart Augmented Reality Glasses for B2B Volume Share (%), by Types 2025 & 2033
- Figure 35: Europe Smart Augmented Reality Glasses for B2B Revenue (million), by Country 2025 & 2033
- Figure 36: Europe Smart Augmented Reality Glasses for B2B Volume (K), by Country 2025 & 2033
- Figure 37: Europe Smart Augmented Reality Glasses for B2B Revenue Share (%), by Country 2025 & 2033
- Figure 38: Europe Smart Augmented Reality Glasses for B2B Volume Share (%), by Country 2025 & 2033
- Figure 39: Middle East & Africa Smart Augmented Reality Glasses for B2B Revenue (million), by Application 2025 & 2033
- Figure 40: Middle East & Africa Smart Augmented Reality Glasses for B2B Volume (K), by Application 2025 & 2033
- Figure 41: Middle East & Africa Smart Augmented Reality Glasses for B2B Revenue Share (%), by Application 2025 & 2033
- Figure 42: Middle East & Africa Smart Augmented Reality Glasses for B2B Volume Share (%), by Application 2025 & 2033
- Figure 43: Middle East & Africa Smart Augmented Reality Glasses for B2B Revenue (million), by Types 2025 & 2033
- Figure 44: Middle East & Africa Smart Augmented Reality Glasses for B2B Volume (K), by Types 2025 & 2033
- Figure 45: Middle East & Africa Smart Augmented Reality Glasses for B2B Revenue Share (%), by Types 2025 & 2033
- Figure 46: Middle East & Africa Smart Augmented Reality Glasses for B2B Volume Share (%), by Types 2025 & 2033
- Figure 47: Middle East & Africa Smart Augmented Reality Glasses for B2B Revenue (million), by Country 2025 & 2033
- Figure 48: Middle East & Africa Smart Augmented Reality Glasses for B2B Volume (K), by Country 2025 & 2033
- Figure 49: Middle East & Africa Smart Augmented Reality Glasses for B2B Revenue Share (%), by Country 2025 & 2033
- Figure 50: Middle East & Africa Smart Augmented Reality Glasses for B2B Volume Share (%), by Country 2025 & 2033
- Figure 51: Asia Pacific Smart Augmented Reality Glasses for B2B Revenue (million), by Application 2025 & 2033
- Figure 52: Asia Pacific Smart Augmented Reality Glasses for B2B Volume (K), by Application 2025 & 2033
- Figure 53: Asia Pacific Smart Augmented Reality Glasses for B2B Revenue Share (%), by Application 2025 & 2033
- Figure 54: Asia Pacific Smart Augmented Reality Glasses for B2B Volume Share (%), by Application 2025 & 2033
- Figure 55: Asia Pacific Smart Augmented Reality Glasses for B2B Revenue (million), by Types 2025 & 2033
- Figure 56: Asia Pacific Smart Augmented Reality Glasses for B2B Volume (K), by Types 2025 & 2033
- Figure 57: Asia Pacific Smart Augmented Reality Glasses for B2B Revenue Share (%), by Types 2025 & 2033
- Figure 58: Asia Pacific Smart Augmented Reality Glasses for B2B Volume Share (%), by Types 2025 & 2033
- Figure 59: Asia Pacific Smart Augmented Reality Glasses for B2B Revenue (million), by Country 2025 & 2033
- Figure 60: Asia Pacific Smart Augmented Reality Glasses for B2B Volume (K), by Country 2025 & 2033
- Figure 61: Asia Pacific Smart Augmented Reality Glasses for B2B Revenue Share (%), by Country 2025 & 2033
- Figure 62: Asia Pacific Smart Augmented Reality Glasses for B2B Volume Share (%), by Country 2025 & 2033
List of Tables
- Table 1: Global Smart Augmented Reality Glasses for B2B Revenue million Forecast, by Application 2020 & 2033
- Table 2: Global Smart Augmented Reality Glasses for B2B Volume K Forecast, by Application 2020 & 2033
- Table 3: Global Smart Augmented Reality Glasses for B2B Revenue million Forecast, by Types 2020 & 2033
- Table 4: Global Smart Augmented Reality Glasses for B2B Volume K Forecast, by Types 2020 & 2033
- Table 5: Global Smart Augmented Reality Glasses for B2B Revenue million Forecast, by Region 2020 & 2033
- Table 6: Global Smart Augmented Reality Glasses for B2B Volume K Forecast, by Region 2020 & 2033
- Table 7: Global Smart Augmented Reality Glasses for B2B Revenue million Forecast, by Application 2020 & 2033
- Table 8: Global Smart Augmented Reality Glasses for B2B Volume K Forecast, by Application 2020 & 2033
- Table 9: Global Smart Augmented Reality Glasses for B2B Revenue million Forecast, by Types 2020 & 2033
- Table 10: Global Smart Augmented Reality Glasses for B2B Volume K Forecast, by Types 2020 & 2033
- Table 11: Global Smart Augmented Reality Glasses for B2B Revenue million Forecast, by Country 2020 & 2033
- Table 12: Global Smart Augmented Reality Glasses for B2B Volume K Forecast, by Country 2020 & 2033
- Table 13: United States Smart Augmented Reality Glasses for B2B Revenue (million) Forecast, by Application 2020 & 2033
- Table 14: United States Smart Augmented Reality Glasses for B2B Volume (K) Forecast, by Application 2020 & 2033
- Table 15: Canada Smart Augmented Reality Glasses for B2B Revenue (million) Forecast, by Application 2020 & 2033
- Table 16: Canada Smart Augmented Reality Glasses for B2B Volume (K) Forecast, by Application 2020 & 2033
- Table 17: Mexico Smart Augmented Reality Glasses for B2B Revenue (million) Forecast, by Application 2020 & 2033
- Table 18: Mexico Smart Augmented Reality Glasses for B2B Volume (K) Forecast, by Application 2020 & 2033
- Table 19: Global Smart Augmented Reality Glasses for B2B Revenue million Forecast, by Application 2020 & 2033
- Table 20: Global Smart Augmented Reality Glasses for B2B Volume K Forecast, by Application 2020 & 2033
- Table 21: Global Smart Augmented Reality Glasses for B2B Revenue million Forecast, by Types 2020 & 2033
- Table 22: Global Smart Augmented Reality Glasses for B2B Volume K Forecast, by Types 2020 & 2033
- Table 23: Global Smart Augmented Reality Glasses for B2B Revenue million Forecast, by Country 2020 & 2033
- Table 24: Global Smart Augmented Reality Glasses for B2B Volume K Forecast, by Country 2020 & 2033
- Table 25: Brazil Smart Augmented Reality Glasses for B2B Revenue (million) Forecast, by Application 2020 & 2033
- Table 26: Brazil Smart Augmented Reality Glasses for B2B Volume (K) Forecast, by Application 2020 & 2033
- Table 27: Argentina Smart Augmented Reality Glasses for B2B Revenue (million) Forecast, by Application 2020 & 2033
- Table 28: Argentina Smart Augmented Reality Glasses for B2B Volume (K) Forecast, by Application 2020 & 2033
- Table 29: Rest of South America Smart Augmented Reality Glasses for B2B Revenue (million) Forecast, by Application 2020 & 2033
- Table 30: Rest of South America Smart Augmented Reality Glasses for B2B Volume (K) Forecast, by Application 2020 & 2033
- Table 31: Global Smart Augmented Reality Glasses for B2B Revenue million Forecast, by Application 2020 & 2033
- Table 32: Global Smart Augmented Reality Glasses for B2B Volume K Forecast, by Application 2020 & 2033
- Table 33: Global Smart Augmented Reality Glasses for B2B Revenue million Forecast, by Types 2020 & 2033
- Table 34: Global Smart Augmented Reality Glasses for B2B Volume K Forecast, by Types 2020 & 2033
- Table 35: Global Smart Augmented Reality Glasses for B2B Revenue million Forecast, by Country 2020 & 2033
- Table 36: Global Smart Augmented Reality Glasses for B2B Volume K Forecast, by Country 2020 & 2033
- Table 37: United Kingdom Smart Augmented Reality Glasses for B2B Revenue (million) Forecast, by Application 2020 & 2033
- Table 38: United Kingdom Smart Augmented Reality Glasses for B2B Volume (K) Forecast, by Application 2020 & 2033
- Table 39: Germany Smart Augmented Reality Glasses for B2B Revenue (million) Forecast, by Application 2020 & 2033
- Table 40: Germany Smart Augmented Reality Glasses for B2B Volume (K) Forecast, by Application 2020 & 2033
- Table 41: France Smart Augmented Reality Glasses for B2B Revenue (million) Forecast, by Application 2020 & 2033
- Table 42: France Smart Augmented Reality Glasses for B2B Volume (K) Forecast, by Application 2020 & 2033
- Table 43: Italy Smart Augmented Reality Glasses for B2B Revenue (million) Forecast, by Application 2020 & 2033
- Table 44: Italy Smart Augmented Reality Glasses for B2B Volume (K) Forecast, by Application 2020 & 2033
- Table 45: Spain Smart Augmented Reality Glasses for B2B Revenue (million) Forecast, by Application 2020 & 2033
- Table 46: Spain Smart Augmented Reality Glasses for B2B Volume (K) Forecast, by Application 2020 & 2033
- Table 47: Russia Smart Augmented Reality Glasses for B2B Revenue (million) Forecast, by Application 2020 & 2033
- Table 48: Russia Smart Augmented Reality Glasses for B2B Volume (K) Forecast, by Application 2020 & 2033
- Table 49: Benelux Smart Augmented Reality Glasses for B2B Revenue (million) Forecast, by Application 2020 & 2033
- Table 50: Benelux Smart Augmented Reality Glasses for B2B Volume (K) Forecast, by Application 2020 & 2033
- Table 51: Nordics Smart Augmented Reality Glasses for B2B Revenue (million) Forecast, by Application 2020 & 2033
- Table 52: Nordics Smart Augmented Reality Glasses for B2B Volume (K) Forecast, by Application 2020 & 2033
- Table 53: Rest of Europe Smart Augmented Reality Glasses for B2B Revenue (million) Forecast, by Application 2020 & 2033
- Table 54: Rest of Europe Smart Augmented Reality Glasses for B2B Volume (K) Forecast, by Application 2020 & 2033
- Table 55: Global Smart Augmented Reality Glasses for B2B Revenue million Forecast, by Application 2020 & 2033
- Table 56: Global Smart Augmented Reality Glasses for B2B Volume K Forecast, by Application 2020 & 2033
- Table 57: Global Smart Augmented Reality Glasses for B2B Revenue million Forecast, by Types 2020 & 2033
- Table 58: Global Smart Augmented Reality Glasses for B2B Volume K Forecast, by Types 2020 & 2033
- Table 59: Global Smart Augmented Reality Glasses for B2B Revenue million Forecast, by Country 2020 & 2033
- Table 60: Global Smart Augmented Reality Glasses for B2B Volume K Forecast, by Country 2020 & 2033
- Table 61: Turkey Smart Augmented Reality Glasses for B2B Revenue (million) Forecast, by Application 2020 & 2033
- Table 62: Turkey Smart Augmented Reality Glasses for B2B Volume (K) Forecast, by Application 2020 & 2033
- Table 63: Israel Smart Augmented Reality Glasses for B2B Revenue (million) Forecast, by Application 2020 & 2033
- Table 64: Israel Smart Augmented Reality Glasses for B2B Volume (K) Forecast, by Application 2020 & 2033
- Table 65: GCC Smart Augmented Reality Glasses for B2B Revenue (million) Forecast, by Application 2020 & 2033
- Table 66: GCC Smart Augmented Reality Glasses for B2B Volume (K) Forecast, by Application 2020 & 2033
- Table 67: North Africa Smart Augmented Reality Glasses for B2B Revenue (million) Forecast, by Application 2020 & 2033
- Table 68: North Africa Smart Augmented Reality Glasses for B2B Volume (K) Forecast, by Application 2020 & 2033
- Table 69: South Africa Smart Augmented Reality Glasses for B2B Revenue (million) Forecast, by Application 2020 & 2033
- Table 70: South Africa Smart Augmented Reality Glasses for B2B Volume (K) Forecast, by Application 2020 & 2033
- Table 71: Rest of Middle East & Africa Smart Augmented Reality Glasses for B2B Revenue (million) Forecast, by Application 2020 & 2033
- Table 72: Rest of Middle East & Africa Smart Augmented Reality Glasses for B2B Volume (K) Forecast, by Application 2020 & 2033
- Table 73: Global Smart Augmented Reality Glasses for B2B Revenue million Forecast, by Application 2020 & 2033
- Table 74: Global Smart Augmented Reality Glasses for B2B Volume K Forecast, by Application 2020 & 2033
- Table 75: Global Smart Augmented Reality Glasses for B2B Revenue million Forecast, by Types 2020 & 2033
- Table 76: Global Smart Augmented Reality Glasses for B2B Volume K Forecast, by Types 2020 & 2033
- Table 77: Global Smart Augmented Reality Glasses for B2B Revenue million Forecast, by Country 2020 & 2033
- Table 78: Global Smart Augmented Reality Glasses for B2B Volume K Forecast, by Country 2020 & 2033
- Table 79: China Smart Augmented Reality Glasses for B2B Revenue (million) Forecast, by Application 2020 & 2033
- Table 80: China Smart Augmented Reality Glasses for B2B Volume (K) Forecast, by Application 2020 & 2033
- Table 81: India Smart Augmented Reality Glasses for B2B Revenue (million) Forecast, by Application 2020 & 2033
- Table 82: India Smart Augmented Reality Glasses for B2B Volume (K) Forecast, by Application 2020 & 2033
- Table 83: Japan Smart Augmented Reality Glasses for B2B Revenue (million) Forecast, by Application 2020 & 2033
- Table 84: Japan Smart Augmented Reality Glasses for B2B Volume (K) Forecast, by Application 2020 & 2033
- Table 85: South Korea Smart Augmented Reality Glasses for B2B Revenue (million) Forecast, by Application 2020 & 2033
- Table 86: South Korea Smart Augmented Reality Glasses for B2B Volume (K) Forecast, by Application 2020 & 2033
- Table 87: ASEAN Smart Augmented Reality Glasses for B2B Revenue (million) Forecast, by Application 2020 & 2033
- Table 88: ASEAN Smart Augmented Reality Glasses for B2B Volume (K) Forecast, by Application 2020 & 2033
- Table 89: Oceania Smart Augmented Reality Glasses for B2B Revenue (million) Forecast, by Application 2020 & 2033
- Table 90: Oceania Smart Augmented Reality Glasses for B2B Volume (K) Forecast, by Application 2020 & 2033
- Table 91: Rest of Asia Pacific Smart Augmented Reality Glasses for B2B Revenue (million) Forecast, by Application 2020 & 2033
- Table 92: Rest of Asia Pacific Smart Augmented Reality Glasses for B2B Volume (K) Forecast, by Application 2020 & 2033
Frequently Asked Questions
1. What is the projected Compound Annual Growth Rate (CAGR) of the Smart Augmented Reality Glasses for B2B?
The projected CAGR is approximately XX%.
2. Which companies are prominent players in the Smart Augmented Reality Glasses for B2B?
Key companies in the market include Google, Microsoft, Daqri, Magic Leap, Vuzix, RealWear, Nreal, Rokid, Kopin, Shadow Creator.
3. What are the main segments of the Smart Augmented Reality Glasses for B2B?
The market segments include Application, Types.
4. Can you provide details about the market size?
The market size is estimated to be USD XXX million as of 2022.
5. What are some drivers contributing to market growth?
N/A
6. What are the notable trends driving market growth?
N/A
7. Are there any restraints impacting market growth?
N/A
8. Can you provide examples of recent developments in the market?
N/A
9. What pricing options are available for accessing the report?
Pricing options include single-user, multi-user, and enterprise licenses priced at USD 3950.00, USD 5925.00, and USD 7900.00 respectively.
10. Is the market size provided in terms of value or volume?
The market size is provided in terms of value, measured in million and volume, measured in K.
11. Are there any specific market keywords associated with the report?
Yes, the market keyword associated with the report is "Smart Augmented Reality Glasses for B2B," which aids in identifying and referencing the specific market segment covered.
12. How do I determine which pricing option suits my needs best?
The pricing options vary based on user requirements and access needs. Individual users may opt for single-user licenses, while businesses requiring broader access may choose multi-user or enterprise licenses for cost-effective access to the report.
13. Are there any additional resources or data provided in the Smart Augmented Reality Glasses for B2B report?
While the report offers comprehensive insights, it's advisable to review the specific contents or supplementary materials provided to ascertain if additional resources or data are available.
14. How can I stay updated on further developments or reports in the Smart Augmented Reality Glasses for B2B?
To stay informed about further developments, trends, and reports in the Smart Augmented Reality Glasses for B2B, consider subscribing to industry newsletters, following relevant companies and organizations, or regularly checking reputable industry news sources and publications.
Methodology
Step 1 - Identification of Relevant Samples Size from Population Database


Step 2 - Approaches for Defining Global Market Size (Value, Volume* & Price*)

Note*: In applicable scenarios
Step 3 - Data Sources
Primary Research
- Web Analytics
- Survey Reports
- Research Institute
- Latest Research Reports
- Opinion Leaders
Secondary Research
- Annual Reports
- White Paper
- Latest Press Release
- Industry Association
- Paid Database
- Investor Presentations

Step 4 - Data Triangulation
Involves using different sources of information in order to increase the validity of a study
These sources are likely to be stakeholders in a program - participants, other researchers, program staff, other community members, and so on.
Then we put all data in single framework & apply various statistical tools to find out the dynamic on the market.
During the analysis stage, feedback from the stakeholder groups would be compared to determine areas of agreement as well as areas of divergence