

Key Insights
The global Smart Nutrition Scale market is projected to achieve a market size of 9.19 billion by 2025, expanding at a CAGR of 14.4%. This growth is driven by increasing health consciousness, the rising incidence of diet-related illnesses, and the adoption of smart kitchen technologies. Consumers are increasingly utilizing these devices for precise dietary tracking, weight management, and informed food choices, particularly those with specific dietary requirements, athletes, and individuals focused on preventative health. The base year for this analysis is 2025.
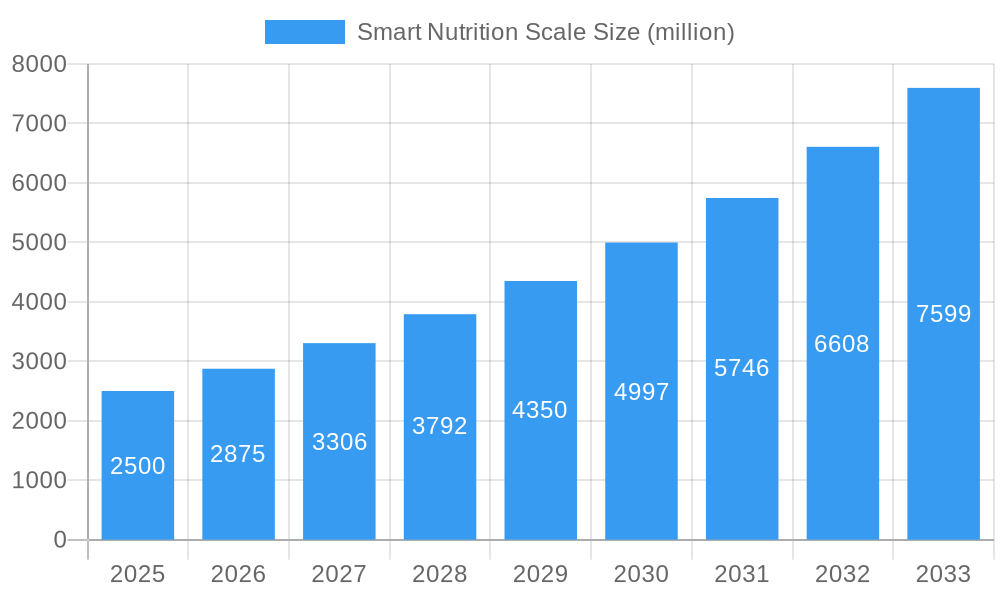
Smart Nutrition Scale Market Size (In Billion)
Key market developments include the integration of AI and machine learning for personalized nutrition insights, the expansion of cloud platforms for data analysis, and the introduction of scales with advanced features like barcode scanning. Connectivity to smartphones is anticipated to be a dominant trend, offering enhanced user experience and data accessibility. While initial device costs and technological adoption may present some challenges, the long-term market outlook is robust. Major applications include nutrient testing, coffee brewing, and recipe management, with nutrient testing leading due to its direct correlation with health and wellness objectives.
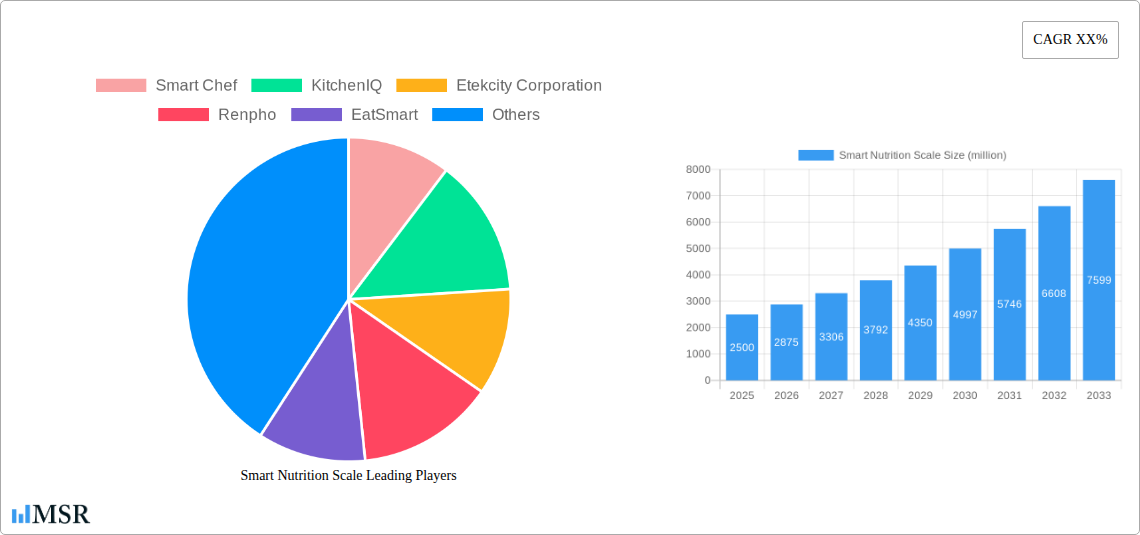
Smart Nutrition Scale Company Market Share
Smart Nutrition Scale Market Research Report: Unlock Growth Opportunities & Strategic Insights (2019-2033)
Gain a competitive edge in the booming Smart Nutrition Scale market with our comprehensive industry analysis. This meticulously researched report provides invaluable insights into market dynamics, emerging trends, key players, and future growth trajectories. Covering the historical period from 2019 to 2024 and projecting growth through 2033 with a base year of 2025, this report is your definitive guide to navigating the evolving landscape of smart kitchen technology. Discover how leading companies like Smart Chef, KitchenIQ, Etekcity Corporation, Renpho, EatSmart, Muzili, Ray Power Technology, Greater Goods, Mackie Scientific, Ozeri, Vitamix, and others are shaping the future of precise nutrition.
Smart Nutrition Scale Market Concentration & Dynamics
The global Smart Nutrition Scale market exhibits a moderately concentrated landscape, with several key players vying for dominance. Leading entities like Etekcity Corporation and Renpho have secured substantial market share, estimated to be in the range of 20% to 25% and 15% to 20% respectively in 2025. The innovation ecosystem is vibrant, driven by continuous technological advancements in sensor accuracy, app integration, and data analytics. Regulatory frameworks, primarily focused on product safety and data privacy, are evolving but generally supportive of market growth. Substitute products, such as basic kitchen scales and manual calorie tracking apps, pose a moderate threat, but the added value of nutritional analysis and connectivity in smart scales mitigates this. End-user trends are shifting towards health-conscious consumers, fitness enthusiasts, and individuals managing specific dietary needs, driving demand for precise macronutrient and micronutrient tracking. Merger and acquisition (M&A) activities have been observed, with approximately 10 to 15 significant deals recorded in the historical period (2019-2024), indicating a consolidation phase and strategic expansion by larger players.
Smart Nutrition Scale Industry Insights & Trends
The Smart Nutrition Scale industry is poised for significant expansion, driven by a confluence of technological innovations, escalating health consciousness, and the increasing integration of smart home ecosystems. The global market size was valued at approximately USD 750 million in the historical year of 2024 and is projected to reach USD 2,500 million by 2033, exhibiting a robust Compound Annual Growth Rate (CAGR) of 12% during the forecast period of 2025–2033. Key growth drivers include the rising prevalence of lifestyle diseases, a growing demand for personalized nutrition solutions, and the democratization of health and wellness information through digital platforms. Technological disruptions are at the forefront, with advancements in AI-powered nutrient identification, multi-spectrum sensor technology for more accurate food analysis, and seamless integration with wearable devices and fitness apps. Consumer behavior is increasingly characterized by a proactive approach to health management, a desire for data-driven insights into dietary habits, and an inclination towards products that simplify complex tasks like nutritional tracking. The convenience offered by smart scales in instantly analyzing food items and providing detailed nutritional breakdowns contributes significantly to their adoption. Furthermore, the expansion of e-commerce channels has made these devices more accessible to a wider consumer base globally. The market is also witnessing a growing interest in scales designed for specific applications, such as advanced coffee brewing for aficionados and precise recipe arrangement for culinary enthusiasts. The ongoing evolution of smart kitchen technology, with a focus on connectivity and user experience, further fuels market momentum.
Key Markets & Segments Leading Smart Nutrition Scale
The global Smart Nutrition Scale market is witnessing strong leadership from North America, particularly the United States, which is expected to account for over 35% of the global market share in 2025. This dominance is attributed to a combination of factors including high disposable incomes, a well-established health and wellness culture, and a strong early adoption rate of smart home technologies.
Application: Nutrient Testing
- Dominance Driver: The Nutrient Testing application segment is the primary revenue generator, driven by the escalating global focus on preventative healthcare and personalized nutrition. Consumers are increasingly aware of the impact of macronutrients and micronutrients on their overall well-being, leading to a heightened demand for accurate food analysis.
- Market Dynamics: The convenience of instantly receiving detailed nutritional information, including calories, protein, carbohydrates, fats, vitamins, and minerals, directly from their food items, is a significant appeal. This segment benefits from the increasing prevalence of chronic diseases and the growing adoption of dietary management plans for conditions like diabetes and obesity. The market size for this segment alone is projected to reach USD 1,500 million by 2033.
Types: Connectable to Cell Phones
- Dominance Driver: The Connectable to Cell Phones type segment is the undisputed leader, driven by the seamless integration capabilities with a vast ecosystem of health and fitness applications. The ability to track nutritional intake over time, set personalized health goals, and receive actionable insights via smartphone apps offers unparalleled value to users.
- Market Dynamics: This segment benefits from the widespread ownership of smartphones and the increasing reliance on mobile devices for managing various aspects of life, including health. The development of sophisticated companion apps that offer features like recipe databases, meal planning tools, and progress reporting further solidifies the dominance of connectable scales. The estimated market share for this segment is expected to be around 70% in 2025, with a projected growth rate exceeding 13% CAGR.
Other applications like Coffee Brewing and Recipe Arrangement are emerging as niche growth areas, driven by specialized consumer segments and the desire for precision in culinary pursuits. While these segments currently represent a smaller portion of the market, their growth potential is significant due to increasing consumer engagement with sophisticated hobbies and the pursuit of optimal taste and quality. The Others segment, encompassing diverse specialized uses, is also anticipated to expand as innovation continues to uncover new applications for smart nutrition scales.
Smart Nutrition Scale Product Developments
Product innovation in the Smart Nutrition Scale market is characterized by advancements in sensor accuracy, enhanced app connectivity, and expanded nutritional databases. Companies are developing scales capable of identifying a wider array of food items and providing more granular nutritional breakdowns, including specific vitamins and minerals. Integration with AI and machine learning is enabling personalized dietary recommendations and predictive health insights. The market relevance is high, with products addressing the growing consumer demand for precise nutritional tracking, weight management, and proactive health monitoring. Competitive advantages are being forged through user-friendly interfaces, robust data security, and seamless interoperability with popular health platforms.
Challenges in the Smart Nutrition Scale Market
Despite robust growth prospects, the Smart Nutrition Scale market faces several challenges. Regulatory hurdles related to data privacy and accuracy claims can impact product development timelines and marketing strategies. Supply chain disruptions, as experienced in recent years, can affect production volumes and lead to increased costs, estimated to impact profit margins by 5% to 10%. Intense competitive pressure from both established brands and new entrants necessitates continuous innovation and aggressive pricing strategies, potentially squeezing profit margins for smaller players. The initial cost of high-end smart scales can also be a barrier for price-sensitive consumers.
Forces Driving Smart Nutrition Scale Growth
The Smart Nutrition Scale market is propelled by several key growth forces. Technological advancements in sensor technology, AI, and IoT integration are enabling more accurate and comprehensive nutritional analysis. The growing global health consciousness and the increasing adoption of healthy lifestyles are creating a sustained demand for tools that facilitate dietary management. Government initiatives and healthcare awareness campaigns promoting healthy eating habits further bolster market growth. The expansion of e-commerce platforms and digital marketing strategies are increasing the accessibility and visibility of these products globally.
Challenges in the Smart Nutrition Scale Market
Long-term growth catalysts for the Smart Nutrition Scale market are rooted in sustained innovation and market expansion. The development of next-generation sensor technology capable of detecting a wider range of nutritional components and potential contaminants will be a significant driver. Strategic partnerships with healthcare providers, nutritionists, and fitness app developers will expand the market reach and credibility of smart scale solutions. Furthermore, penetration into emerging economies with growing middle classes and increasing health awareness presents substantial untapped market potential.
Emerging Opportunities in Smart Nutrition Scale
Emerging opportunities in the Smart Nutrition Scale market lie in several key areas. The development of specialized scales for specific dietary needs, such as keto, vegan, or allergy-focused diets, will cater to niche consumer segments. Integration with smart kitchen appliances for automated recipe scaling and nutritional calculation presents a significant opportunity for enhanced user experience. The burgeoning market for personalized health and wellness coaching, supported by data from smart scales, offers a lucrative avenue for service-based revenue models. Exploring partnerships with food manufacturers for direct product integration and data sharing could also unlock new market avenues.
Leading Players in the Smart Nutrition Scale Sector
- Smart Chef
- KitchenIQ
- Etekcity Corporation
- Renpho
- EatSmart
- Muzili
- Ray Power Technology
- Greater Goods
- Mackie Scientific
- Ozeri
- Vitamix
Key Milestones in Smart Nutrition Scale Industry
- 2019: Introduction of advanced AI-powered food recognition algorithms enhancing nutritional accuracy.
- 2020: Increased integration with major fitness tracking apps, expanding user data synchronization capabilities.
- 2021: Launch of scales with enhanced battery life and durable, easy-to-clean materials, improving user convenience.
- 2022: Significant growth in online sales channels, making smart nutrition scales more accessible globally.
- 2023: Emergence of specialized scales targeting specific dietary needs and advanced culinary applications.
- 2024: Increased focus on data security and privacy features, building consumer trust.
Strategic Outlook for Smart Nutrition Scale Market
The strategic outlook for the Smart Nutrition Scale market is highly positive, driven by continuous technological innovation and a growing global emphasis on health and wellness. Future growth accelerators will include the development of more sophisticated AI-driven nutritional analysis, seamless integration into broader smart home and health ecosystems, and expansion into underserved emerging markets. Companies that focus on user experience, data accuracy, and value-added services like personalized dietary insights will be best positioned for sustained success in this dynamic and expanding industry. The market is expected to see further consolidation and strategic alliances as players seek to capture market share and enhance their competitive offerings.
Smart Nutrition Scale Segmentation
-
1. Application
- 1.1. Nutrient Testing
- 1.2. Coffee Brewing
- 1.3. Recipe Arrangement
- 1.4. Others
-
2. Types
- 2.1. Connectable to Cell Phones
- 2.2. Cannot Connect to Cell Phones
Smart Nutrition Scale Segmentation By Geography
-
1. North America
- 1.1. United States
- 1.2. Canada
- 1.3. Mexico
-
2. South America
- 2.1. Brazil
- 2.2. Argentina
- 2.3. Rest of South America
-
3. Europe
- 3.1. United Kingdom
- 3.2. Germany
- 3.3. France
- 3.4. Italy
- 3.5. Spain
- 3.6. Russia
- 3.7. Benelux
- 3.8. Nordics
- 3.9. Rest of Europe
-
4. Middle East & Africa
- 4.1. Turkey
- 4.2. Israel
- 4.3. GCC
- 4.4. North Africa
- 4.5. South Africa
- 4.6. Rest of Middle East & Africa
-
5. Asia Pacific
- 5.1. China
- 5.2. India
- 5.3. Japan
- 5.4. South Korea
- 5.5. ASEAN
- 5.6. Oceania
- 5.7. Rest of Asia Pacific
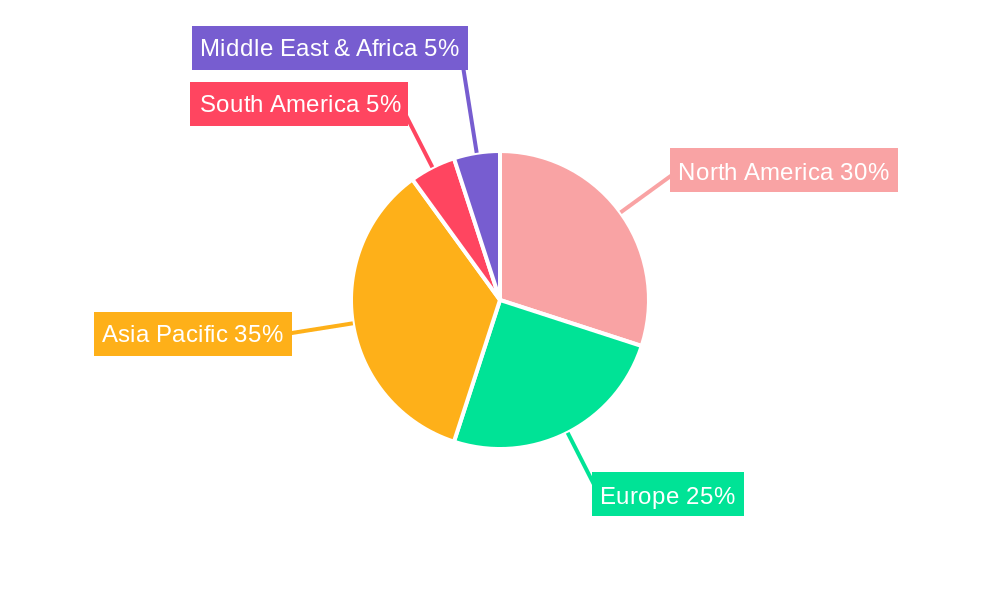
Smart Nutrition Scale Regional Market Share
Geographic Coverage of Smart Nutrition Scale
Smart Nutrition Scale REPORT HIGHLIGHTS
| Aspects | Details |
|---|---|
| Study Period | 2020-2034 |
| Base Year | 2025 |
| Estimated Year | 2026 |
| Forecast Period | 2026-2034 |
| Historical Period | 2020-2025 |
| Growth Rate | CAGR of 14.4% from 2020-2034 |
| Segmentation |
|
Table of Contents
- 1. Introduction
- 1.1. Research Scope
- 1.2. Market Segmentation
- 1.3. Research Objective
- 1.4. Definitions and Assumptions
- 2. Executive Summary
- 2.1. Market Snapshot
- 3. Market Dynamics
- 3.1. Market Drivers
- 3.2. Market Restrains
- 3.3. Market Trends
- 3.4. Market Opportunities
- 4. Market Factor Analysis
- 4.1. Porters Five Forces
- 4.1.1. Bargaining Power of Suppliers
- 4.1.2. Bargaining Power of Buyers
- 4.1.3. Threat of New Entrants
- 4.1.4. Threat of Substitutes
- 4.1.5. Competitive Rivalry
- 4.2. PESTEL analysis
- 4.3. BCG Analysis
- 4.3.1. Stars (High Growth, High Market Share)
- 4.3.2. Cash Cows (Low Growth, High Market Share)
- 4.3.3. Question Mark (High Growth, Low Market Share)
- 4.3.4. Dogs (Low Growth, Low Market Share)
- 4.4. Ansoff Matrix Analysis
- 4.5. Supply Chain Analysis
- 4.6. Regulatory Landscape
- 4.7. Current Market Potential and Opportunity Assessment (TAM–SAM–SOM Framework)
- 4.8. MSR Analyst Note
- 4.1. Porters Five Forces
- 5. Market Analysis, Insights and Forecast 2021-2033
- 5.1. Market Analysis, Insights and Forecast - by Application
- 5.1.1. Nutrient Testing
- 5.1.2. Coffee Brewing
- 5.1.3. Recipe Arrangement
- 5.1.4. Others
- 5.2. Market Analysis, Insights and Forecast - by Types
- 5.2.1. Connectable to Cell Phones
- 5.2.2. Cannot Connect to Cell Phones
- 5.3. Market Analysis, Insights and Forecast - by Region
- 5.3.1. North America
- 5.3.2. South America
- 5.3.3. Europe
- 5.3.4. Middle East & Africa
- 5.3.5. Asia Pacific
- 5.1. Market Analysis, Insights and Forecast - by Application
- 6. Global Smart Nutrition Scale Analysis, Insights and Forecast, 2021-2033
- 6.1. Market Analysis, Insights and Forecast - by Application
- 6.1.1. Nutrient Testing
- 6.1.2. Coffee Brewing
- 6.1.3. Recipe Arrangement
- 6.1.4. Others
- 6.2. Market Analysis, Insights and Forecast - by Types
- 6.2.1. Connectable to Cell Phones
- 6.2.2. Cannot Connect to Cell Phones
- 6.1. Market Analysis, Insights and Forecast - by Application
- 7. North America Smart Nutrition Scale Analysis, Insights and Forecast, 2020-2032
- 7.1. Market Analysis, Insights and Forecast - by Application
- 7.1.1. Nutrient Testing
- 7.1.2. Coffee Brewing
- 7.1.3. Recipe Arrangement
- 7.1.4. Others
- 7.2. Market Analysis, Insights and Forecast - by Types
- 7.2.1. Connectable to Cell Phones
- 7.2.2. Cannot Connect to Cell Phones
- 7.1. Market Analysis, Insights and Forecast - by Application
- 8. South America Smart Nutrition Scale Analysis, Insights and Forecast, 2020-2032
- 8.1. Market Analysis, Insights and Forecast - by Application
- 8.1.1. Nutrient Testing
- 8.1.2. Coffee Brewing
- 8.1.3. Recipe Arrangement
- 8.1.4. Others
- 8.2. Market Analysis, Insights and Forecast - by Types
- 8.2.1. Connectable to Cell Phones
- 8.2.2. Cannot Connect to Cell Phones
- 8.1. Market Analysis, Insights and Forecast - by Application
- 9. Europe Smart Nutrition Scale Analysis, Insights and Forecast, 2020-2032
- 9.1. Market Analysis, Insights and Forecast - by Application
- 9.1.1. Nutrient Testing
- 9.1.2. Coffee Brewing
- 9.1.3. Recipe Arrangement
- 9.1.4. Others
- 9.2. Market Analysis, Insights and Forecast - by Types
- 9.2.1. Connectable to Cell Phones
- 9.2.2. Cannot Connect to Cell Phones
- 9.1. Market Analysis, Insights and Forecast - by Application
- 10. Middle East & Africa Smart Nutrition Scale Analysis, Insights and Forecast, 2020-2032
- 10.1. Market Analysis, Insights and Forecast - by Application
- 10.1.1. Nutrient Testing
- 10.1.2. Coffee Brewing
- 10.1.3. Recipe Arrangement
- 10.1.4. Others
- 10.2. Market Analysis, Insights and Forecast - by Types
- 10.2.1. Connectable to Cell Phones
- 10.2.2. Cannot Connect to Cell Phones
- 10.1. Market Analysis, Insights and Forecast - by Application
- 11. Asia Pacific Smart Nutrition Scale Analysis, Insights and Forecast, 2020-2032
- 11.1. Market Analysis, Insights and Forecast - by Application
- 11.1.1. Nutrient Testing
- 11.1.2. Coffee Brewing
- 11.1.3. Recipe Arrangement
- 11.1.4. Others
- 11.2. Market Analysis, Insights and Forecast - by Types
- 11.2.1. Connectable to Cell Phones
- 11.2.2. Cannot Connect to Cell Phones
- 11.1. Market Analysis, Insights and Forecast - by Application
- 12. Competitive Analysis
- 12.1. Company Profiles
- 12.1.1 Smart Chef
- 12.1.1.1. Company Overview
- 12.1.1.2. Products
- 12.1.1.3. Company Financials
- 12.1.1.4. SWOT Analysis
- 12.1.2 KitchenIQ
- 12.1.2.1. Company Overview
- 12.1.2.2. Products
- 12.1.2.3. Company Financials
- 12.1.2.4. SWOT Analysis
- 12.1.3 Etekcity Corporation
- 12.1.3.1. Company Overview
- 12.1.3.2. Products
- 12.1.3.3. Company Financials
- 12.1.3.4. SWOT Analysis
- 12.1.4 Renpho
- 12.1.4.1. Company Overview
- 12.1.4.2. Products
- 12.1.4.3. Company Financials
- 12.1.4.4. SWOT Analysis
- 12.1.5 EatSmart
- 12.1.5.1. Company Overview
- 12.1.5.2. Products
- 12.1.5.3. Company Financials
- 12.1.5.4. SWOT Analysis
- 12.1.6 Muzili
- 12.1.6.1. Company Overview
- 12.1.6.2. Products
- 12.1.6.3. Company Financials
- 12.1.6.4. SWOT Analysis
- 12.1.7 Ray Power Technology
- 12.1.7.1. Company Overview
- 12.1.7.2. Products
- 12.1.7.3. Company Financials
- 12.1.7.4. SWOT Analysis
- 12.1.8 Greater Goods
- 12.1.8.1. Company Overview
- 12.1.8.2. Products
- 12.1.8.3. Company Financials
- 12.1.8.4. SWOT Analysis
- 12.1.9 Mackie Scientific
- 12.1.9.1. Company Overview
- 12.1.9.2. Products
- 12.1.9.3. Company Financials
- 12.1.9.4. SWOT Analysis
- 12.1.10 Ozeri
- 12.1.10.1. Company Overview
- 12.1.10.2. Products
- 12.1.10.3. Company Financials
- 12.1.10.4. SWOT Analysis
- 12.1.11 Vitamix
- 12.1.11.1. Company Overview
- 12.1.11.2. Products
- 12.1.11.3. Company Financials
- 12.1.11.4. SWOT Analysis
- 12.1.1 Smart Chef
- 12.2. Market Entropy
- 12.2.1 Company's Key Areas Served
- 12.2.2 Recent Developments
- 12.3. Company Market Share Analysis 2025
- 12.3.1 Top 5 Companies Market Share Analysis
- 12.3.2 Top 3 Companies Market Share Analysis
- 12.4. List of Potential Customers
- 13. Research Methodology
List of Figures
- Figure 1: Global Smart Nutrition Scale Revenue Breakdown (billion, %) by Region 2025 & 2033
- Figure 2: Global Smart Nutrition Scale Volume Breakdown (K, %) by Region 2025 & 2033
- Figure 3: North America Smart Nutrition Scale Revenue (billion), by Application 2025 & 2033
- Figure 4: North America Smart Nutrition Scale Volume (K), by Application 2025 & 2033
- Figure 5: North America Smart Nutrition Scale Revenue Share (%), by Application 2025 & 2033
- Figure 6: North America Smart Nutrition Scale Volume Share (%), by Application 2025 & 2033
- Figure 7: North America Smart Nutrition Scale Revenue (billion), by Types 2025 & 2033
- Figure 8: North America Smart Nutrition Scale Volume (K), by Types 2025 & 2033
- Figure 9: North America Smart Nutrition Scale Revenue Share (%), by Types 2025 & 2033
- Figure 10: North America Smart Nutrition Scale Volume Share (%), by Types 2025 & 2033
- Figure 11: North America Smart Nutrition Scale Revenue (billion), by Country 2025 & 2033
- Figure 12: North America Smart Nutrition Scale Volume (K), by Country 2025 & 2033
- Figure 13: North America Smart Nutrition Scale Revenue Share (%), by Country 2025 & 2033
- Figure 14: North America Smart Nutrition Scale Volume Share (%), by Country 2025 & 2033
- Figure 15: South America Smart Nutrition Scale Revenue (billion), by Application 2025 & 2033
- Figure 16: South America Smart Nutrition Scale Volume (K), by Application 2025 & 2033
- Figure 17: South America Smart Nutrition Scale Revenue Share (%), by Application 2025 & 2033
- Figure 18: South America Smart Nutrition Scale Volume Share (%), by Application 2025 & 2033
- Figure 19: South America Smart Nutrition Scale Revenue (billion), by Types 2025 & 2033
- Figure 20: South America Smart Nutrition Scale Volume (K), by Types 2025 & 2033
- Figure 21: South America Smart Nutrition Scale Revenue Share (%), by Types 2025 & 2033
- Figure 22: South America Smart Nutrition Scale Volume Share (%), by Types 2025 & 2033
- Figure 23: South America Smart Nutrition Scale Revenue (billion), by Country 2025 & 2033
- Figure 24: South America Smart Nutrition Scale Volume (K), by Country 2025 & 2033
- Figure 25: South America Smart Nutrition Scale Revenue Share (%), by Country 2025 & 2033
- Figure 26: South America Smart Nutrition Scale Volume Share (%), by Country 2025 & 2033
- Figure 27: Europe Smart Nutrition Scale Revenue (billion), by Application 2025 & 2033
- Figure 28: Europe Smart Nutrition Scale Volume (K), by Application 2025 & 2033
- Figure 29: Europe Smart Nutrition Scale Revenue Share (%), by Application 2025 & 2033
- Figure 30: Europe Smart Nutrition Scale Volume Share (%), by Application 2025 & 2033
- Figure 31: Europe Smart Nutrition Scale Revenue (billion), by Types 2025 & 2033
- Figure 32: Europe Smart Nutrition Scale Volume (K), by Types 2025 & 2033
- Figure 33: Europe Smart Nutrition Scale Revenue Share (%), by Types 2025 & 2033
- Figure 34: Europe Smart Nutrition Scale Volume Share (%), by Types 2025 & 2033
- Figure 35: Europe Smart Nutrition Scale Revenue (billion), by Country 2025 & 2033
- Figure 36: Europe Smart Nutrition Scale Volume (K), by Country 2025 & 2033
- Figure 37: Europe Smart Nutrition Scale Revenue Share (%), by Country 2025 & 2033
- Figure 38: Europe Smart Nutrition Scale Volume Share (%), by Country 2025 & 2033
- Figure 39: Middle East & Africa Smart Nutrition Scale Revenue (billion), by Application 2025 & 2033
- Figure 40: Middle East & Africa Smart Nutrition Scale Volume (K), by Application 2025 & 2033
- Figure 41: Middle East & Africa Smart Nutrition Scale Revenue Share (%), by Application 2025 & 2033
- Figure 42: Middle East & Africa Smart Nutrition Scale Volume Share (%), by Application 2025 & 2033
- Figure 43: Middle East & Africa Smart Nutrition Scale Revenue (billion), by Types 2025 & 2033
- Figure 44: Middle East & Africa Smart Nutrition Scale Volume (K), by Types 2025 & 2033
- Figure 45: Middle East & Africa Smart Nutrition Scale Revenue Share (%), by Types 2025 & 2033
- Figure 46: Middle East & Africa Smart Nutrition Scale Volume Share (%), by Types 2025 & 2033
- Figure 47: Middle East & Africa Smart Nutrition Scale Revenue (billion), by Country 2025 & 2033
- Figure 48: Middle East & Africa Smart Nutrition Scale Volume (K), by Country 2025 & 2033
- Figure 49: Middle East & Africa Smart Nutrition Scale Revenue Share (%), by Country 2025 & 2033
- Figure 50: Middle East & Africa Smart Nutrition Scale Volume Share (%), by Country 2025 & 2033
- Figure 51: Asia Pacific Smart Nutrition Scale Revenue (billion), by Application 2025 & 2033
- Figure 52: Asia Pacific Smart Nutrition Scale Volume (K), by Application 2025 & 2033
- Figure 53: Asia Pacific Smart Nutrition Scale Revenue Share (%), by Application 2025 & 2033
- Figure 54: Asia Pacific Smart Nutrition Scale Volume Share (%), by Application 2025 & 2033
- Figure 55: Asia Pacific Smart Nutrition Scale Revenue (billion), by Types 2025 & 2033
- Figure 56: Asia Pacific Smart Nutrition Scale Volume (K), by Types 2025 & 2033
- Figure 57: Asia Pacific Smart Nutrition Scale Revenue Share (%), by Types 2025 & 2033
- Figure 58: Asia Pacific Smart Nutrition Scale Volume Share (%), by Types 2025 & 2033
- Figure 59: Asia Pacific Smart Nutrition Scale Revenue (billion), by Country 2025 & 2033
- Figure 60: Asia Pacific Smart Nutrition Scale Volume (K), by Country 2025 & 2033
- Figure 61: Asia Pacific Smart Nutrition Scale Revenue Share (%), by Country 2025 & 2033
- Figure 62: Asia Pacific Smart Nutrition Scale Volume Share (%), by Country 2025 & 2033
List of Tables
- Table 1: Global Smart Nutrition Scale Revenue billion Forecast, by Application 2020 & 2033
- Table 2: Global Smart Nutrition Scale Volume K Forecast, by Application 2020 & 2033
- Table 3: Global Smart Nutrition Scale Revenue billion Forecast, by Types 2020 & 2033
- Table 4: Global Smart Nutrition Scale Volume K Forecast, by Types 2020 & 2033
- Table 5: Global Smart Nutrition Scale Revenue billion Forecast, by Region 2020 & 2033
- Table 6: Global Smart Nutrition Scale Volume K Forecast, by Region 2020 & 2033
- Table 7: Global Smart Nutrition Scale Revenue billion Forecast, by Application 2020 & 2033
- Table 8: Global Smart Nutrition Scale Volume K Forecast, by Application 2020 & 2033
- Table 9: Global Smart Nutrition Scale Revenue billion Forecast, by Types 2020 & 2033
- Table 10: Global Smart Nutrition Scale Volume K Forecast, by Types 2020 & 2033
- Table 11: Global Smart Nutrition Scale Revenue billion Forecast, by Country 2020 & 2033
- Table 12: Global Smart Nutrition Scale Volume K Forecast, by Country 2020 & 2033
- Table 13: United States Smart Nutrition Scale Revenue (billion) Forecast, by Application 2020 & 2033
- Table 14: United States Smart Nutrition Scale Volume (K) Forecast, by Application 2020 & 2033
- Table 15: Canada Smart Nutrition Scale Revenue (billion) Forecast, by Application 2020 & 2033
- Table 16: Canada Smart Nutrition Scale Volume (K) Forecast, by Application 2020 & 2033
- Table 17: Mexico Smart Nutrition Scale Revenue (billion) Forecast, by Application 2020 & 2033
- Table 18: Mexico Smart Nutrition Scale Volume (K) Forecast, by Application 2020 & 2033
- Table 19: Global Smart Nutrition Scale Revenue billion Forecast, by Application 2020 & 2033
- Table 20: Global Smart Nutrition Scale Volume K Forecast, by Application 2020 & 2033
- Table 21: Global Smart Nutrition Scale Revenue billion Forecast, by Types 2020 & 2033
- Table 22: Global Smart Nutrition Scale Volume K Forecast, by Types 2020 & 2033
- Table 23: Global Smart Nutrition Scale Revenue billion Forecast, by Country 2020 & 2033
- Table 24: Global Smart Nutrition Scale Volume K Forecast, by Country 2020 & 2033
- Table 25: Brazil Smart Nutrition Scale Revenue (billion) Forecast, by Application 2020 & 2033
- Table 26: Brazil Smart Nutrition Scale Volume (K) Forecast, by Application 2020 & 2033
- Table 27: Argentina Smart Nutrition Scale Revenue (billion) Forecast, by Application 2020 & 2033
- Table 28: Argentina Smart Nutrition Scale Volume (K) Forecast, by Application 2020 & 2033
- Table 29: Rest of South America Smart Nutrition Scale Revenue (billion) Forecast, by Application 2020 & 2033
- Table 30: Rest of South America Smart Nutrition Scale Volume (K) Forecast, by Application 2020 & 2033
- Table 31: Global Smart Nutrition Scale Revenue billion Forecast, by Application 2020 & 2033
- Table 32: Global Smart Nutrition Scale Volume K Forecast, by Application 2020 & 2033
- Table 33: Global Smart Nutrition Scale Revenue billion Forecast, by Types 2020 & 2033
- Table 34: Global Smart Nutrition Scale Volume K Forecast, by Types 2020 & 2033
- Table 35: Global Smart Nutrition Scale Revenue billion Forecast, by Country 2020 & 2033
- Table 36: Global Smart Nutrition Scale Volume K Forecast, by Country 2020 & 2033
- Table 37: United Kingdom Smart Nutrition Scale Revenue (billion) Forecast, by Application 2020 & 2033
- Table 38: United Kingdom Smart Nutrition Scale Volume (K) Forecast, by Application 2020 & 2033
- Table 39: Germany Smart Nutrition Scale Revenue (billion) Forecast, by Application 2020 & 2033
- Table 40: Germany Smart Nutrition Scale Volume (K) Forecast, by Application 2020 & 2033
- Table 41: France Smart Nutrition Scale Revenue (billion) Forecast, by Application 2020 & 2033
- Table 42: France Smart Nutrition Scale Volume (K) Forecast, by Application 2020 & 2033
- Table 43: Italy Smart Nutrition Scale Revenue (billion) Forecast, by Application 2020 & 2033
- Table 44: Italy Smart Nutrition Scale Volume (K) Forecast, by Application 2020 & 2033
- Table 45: Spain Smart Nutrition Scale Revenue (billion) Forecast, by Application 2020 & 2033
- Table 46: Spain Smart Nutrition Scale Volume (K) Forecast, by Application 2020 & 2033
- Table 47: Russia Smart Nutrition Scale Revenue (billion) Forecast, by Application 2020 & 2033
- Table 48: Russia Smart Nutrition Scale Volume (K) Forecast, by Application 2020 & 2033
- Table 49: Benelux Smart Nutrition Scale Revenue (billion) Forecast, by Application 2020 & 2033
- Table 50: Benelux Smart Nutrition Scale Volume (K) Forecast, by Application 2020 & 2033
- Table 51: Nordics Smart Nutrition Scale Revenue (billion) Forecast, by Application 2020 & 2033
- Table 52: Nordics Smart Nutrition Scale Volume (K) Forecast, by Application 2020 & 2033
- Table 53: Rest of Europe Smart Nutrition Scale Revenue (billion) Forecast, by Application 2020 & 2033
- Table 54: Rest of Europe Smart Nutrition Scale Volume (K) Forecast, by Application 2020 & 2033
- Table 55: Global Smart Nutrition Scale Revenue billion Forecast, by Application 2020 & 2033
- Table 56: Global Smart Nutrition Scale Volume K Forecast, by Application 2020 & 2033
- Table 57: Global Smart Nutrition Scale Revenue billion Forecast, by Types 2020 & 2033
- Table 58: Global Smart Nutrition Scale Volume K Forecast, by Types 2020 & 2033
- Table 59: Global Smart Nutrition Scale Revenue billion Forecast, by Country 2020 & 2033
- Table 60: Global Smart Nutrition Scale Volume K Forecast, by Country 2020 & 2033
- Table 61: Turkey Smart Nutrition Scale Revenue (billion) Forecast, by Application 2020 & 2033
- Table 62: Turkey Smart Nutrition Scale Volume (K) Forecast, by Application 2020 & 2033
- Table 63: Israel Smart Nutrition Scale Revenue (billion) Forecast, by Application 2020 & 2033
- Table 64: Israel Smart Nutrition Scale Volume (K) Forecast, by Application 2020 & 2033
- Table 65: GCC Smart Nutrition Scale Revenue (billion) Forecast, by Application 2020 & 2033
- Table 66: GCC Smart Nutrition Scale Volume (K) Forecast, by Application 2020 & 2033
- Table 67: North Africa Smart Nutrition Scale Revenue (billion) Forecast, by Application 2020 & 2033
- Table 68: North Africa Smart Nutrition Scale Volume (K) Forecast, by Application 2020 & 2033
- Table 69: South Africa Smart Nutrition Scale Revenue (billion) Forecast, by Application 2020 & 2033
- Table 70: South Africa Smart Nutrition Scale Volume (K) Forecast, by Application 2020 & 2033
- Table 71: Rest of Middle East & Africa Smart Nutrition Scale Revenue (billion) Forecast, by Application 2020 & 2033
- Table 72: Rest of Middle East & Africa Smart Nutrition Scale Volume (K) Forecast, by Application 2020 & 2033
- Table 73: Global Smart Nutrition Scale Revenue billion Forecast, by Application 2020 & 2033
- Table 74: Global Smart Nutrition Scale Volume K Forecast, by Application 2020 & 2033
- Table 75: Global Smart Nutrition Scale Revenue billion Forecast, by Types 2020 & 2033
- Table 76: Global Smart Nutrition Scale Volume K Forecast, by Types 2020 & 2033
- Table 77: Global Smart Nutrition Scale Revenue billion Forecast, by Country 2020 & 2033
- Table 78: Global Smart Nutrition Scale Volume K Forecast, by Country 2020 & 2033
- Table 79: China Smart Nutrition Scale Revenue (billion) Forecast, by Application 2020 & 2033
- Table 80: China Smart Nutrition Scale Volume (K) Forecast, by Application 2020 & 2033
- Table 81: India Smart Nutrition Scale Revenue (billion) Forecast, by Application 2020 & 2033
- Table 82: India Smart Nutrition Scale Volume (K) Forecast, by Application 2020 & 2033
- Table 83: Japan Smart Nutrition Scale Revenue (billion) Forecast, by Application 2020 & 2033
- Table 84: Japan Smart Nutrition Scale Volume (K) Forecast, by Application 2020 & 2033
- Table 85: South Korea Smart Nutrition Scale Revenue (billion) Forecast, by Application 2020 & 2033
- Table 86: South Korea Smart Nutrition Scale Volume (K) Forecast, by Application 2020 & 2033
- Table 87: ASEAN Smart Nutrition Scale Revenue (billion) Forecast, by Application 2020 & 2033
- Table 88: ASEAN Smart Nutrition Scale Volume (K) Forecast, by Application 2020 & 2033
- Table 89: Oceania Smart Nutrition Scale Revenue (billion) Forecast, by Application 2020 & 2033
- Table 90: Oceania Smart Nutrition Scale Volume (K) Forecast, by Application 2020 & 2033
- Table 91: Rest of Asia Pacific Smart Nutrition Scale Revenue (billion) Forecast, by Application 2020 & 2033
- Table 92: Rest of Asia Pacific Smart Nutrition Scale Volume (K) Forecast, by Application 2020 & 2033
Frequently Asked Questions
1. What is the projected Compound Annual Growth Rate (CAGR) of the Smart Nutrition Scale?
The projected CAGR is approximately 14.4%.
2. Which companies are prominent players in the Smart Nutrition Scale?
Key companies in the market include Smart Chef, KitchenIQ, Etekcity Corporation, Renpho, EatSmart, Muzili, Ray Power Technology, Greater Goods, Mackie Scientific, Ozeri, Vitamix.
3. What are the main segments of the Smart Nutrition Scale?
The market segments include Application, Types.
4. Can you provide details about the market size?
The market size is estimated to be USD 9.19 billion as of 2022.
5. What are some drivers contributing to market growth?
N/A
6. What are the notable trends driving market growth?
N/A
7. Are there any restraints impacting market growth?
N/A
8. Can you provide examples of recent developments in the market?
N/A
9. What pricing options are available for accessing the report?
Pricing options include single-user, multi-user, and enterprise licenses priced at USD 3950.00, USD 5925.00, and USD 7900.00 respectively.
10. Is the market size provided in terms of value or volume?
The market size is provided in terms of value, measured in billion and volume, measured in K.
11. Are there any specific market keywords associated with the report?
Yes, the market keyword associated with the report is "Smart Nutrition Scale," which aids in identifying and referencing the specific market segment covered.
12. How do I determine which pricing option suits my needs best?
The pricing options vary based on user requirements and access needs. Individual users may opt for single-user licenses, while businesses requiring broader access may choose multi-user or enterprise licenses for cost-effective access to the report.
13. Are there any additional resources or data provided in the Smart Nutrition Scale report?
While the report offers comprehensive insights, it's advisable to review the specific contents or supplementary materials provided to ascertain if additional resources or data are available.
14. How can I stay updated on further developments or reports in the Smart Nutrition Scale?
To stay informed about further developments, trends, and reports in the Smart Nutrition Scale, consider subscribing to industry newsletters, following relevant companies and organizations, or regularly checking reputable industry news sources and publications.
Methodology
Step 1 - Identification of Relevant Samples Size from Population Database


Step 2 - Approaches for Defining Global Market Size (Value, Volume* & Price*)

Note*: In applicable scenarios
Step 3 - Data Sources
Primary Research
- Web Analytics
- Survey Reports
- Research Institute
- Latest Research Reports
- Opinion Leaders
Secondary Research
- Annual Reports
- White Paper
- Latest Press Release
- Industry Association
- Paid Database
- Investor Presentations

Step 4 - Data Triangulation
Involves using different sources of information in order to increase the validity of a study
These sources are likely to be stakeholders in a program - participants, other researchers, program staff, other community members, and so on.
Then we put all data in single framework & apply various statistical tools to find out the dynamic on the market.
During the analysis stage, feedback from the stakeholder groups would be compared to determine areas of agreement as well as areas of divergence