

Key Insights
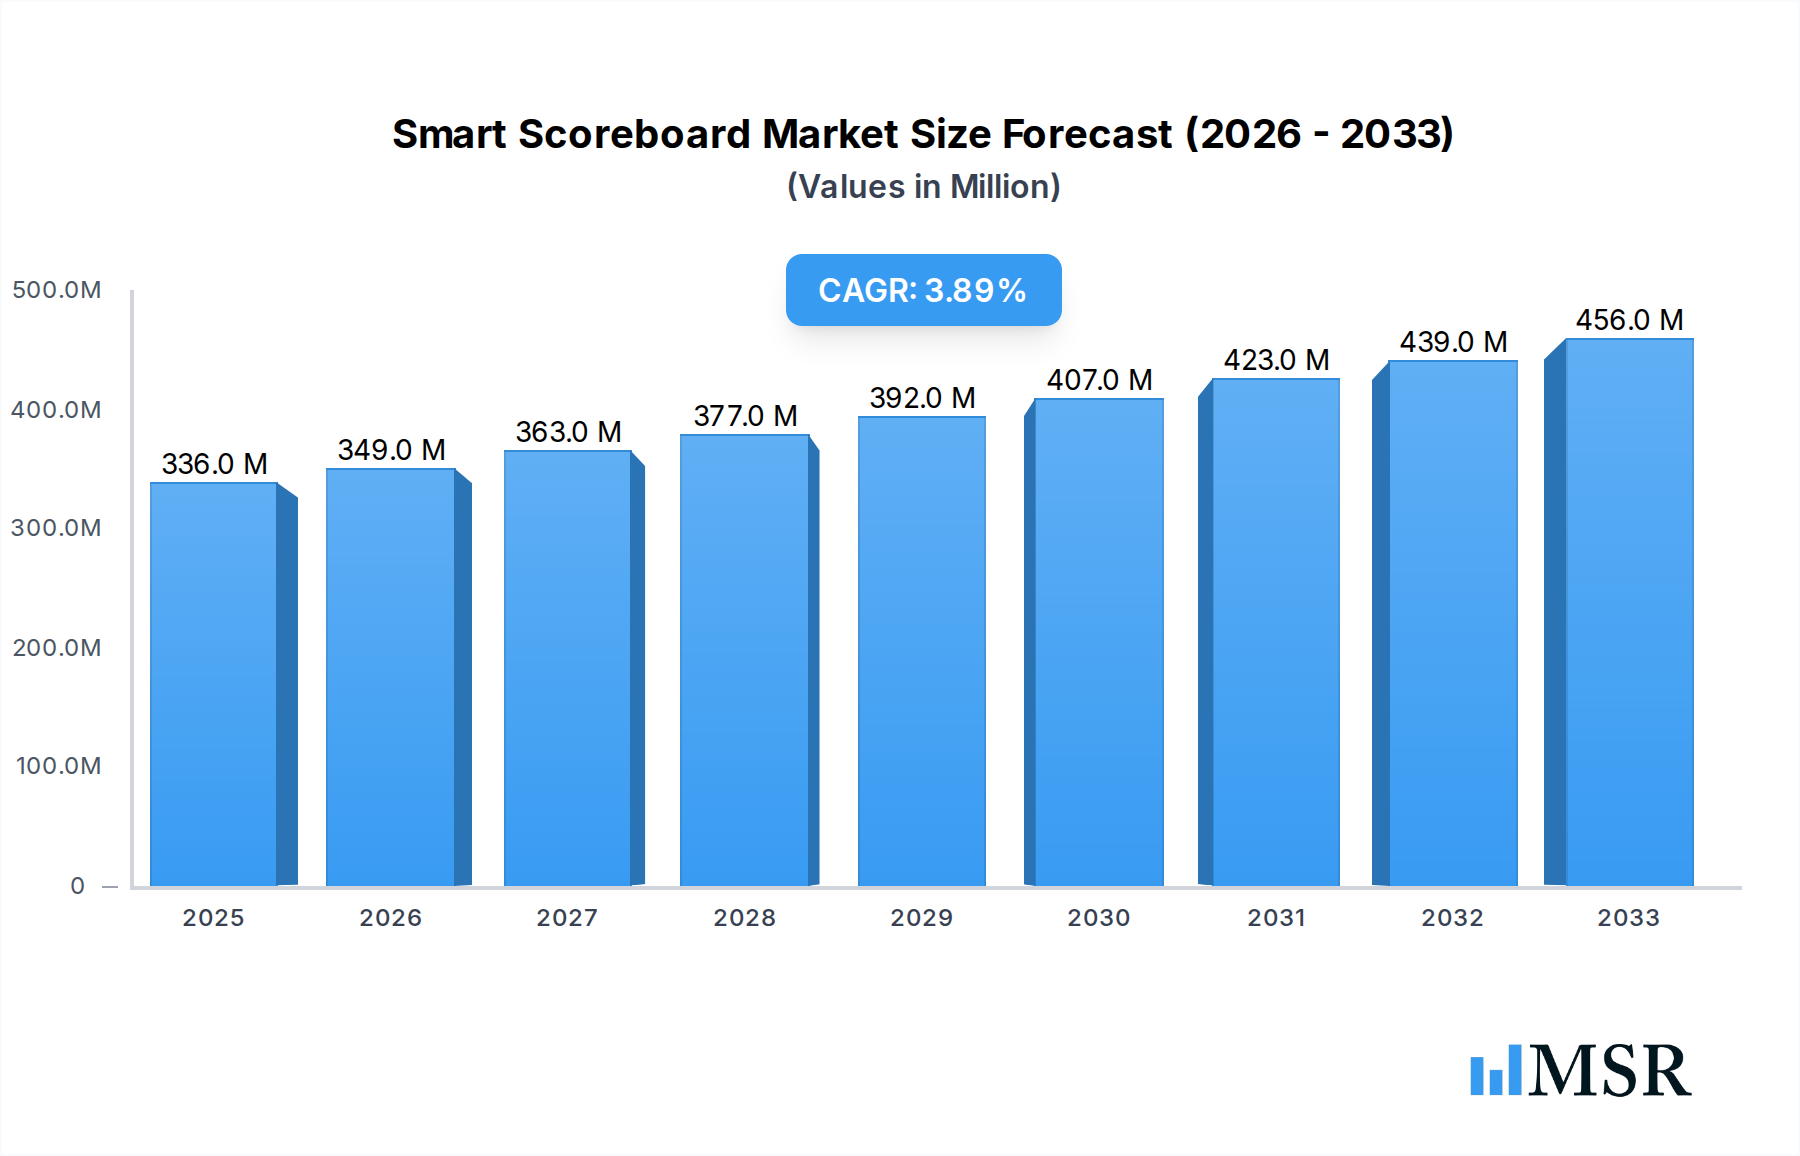
The global Smart Scoreboard market is poised for significant expansion, projected to reach an estimated $336 million by 2025. This growth is underpinned by a robust Compound Annual Growth Rate (CAGR) of 4.4% anticipated over the forecast period of 2025-2033. The increasing integration of advanced technologies, such as IoT, AI, and enhanced connectivity, is a primary driver, transforming traditional scoreboards into dynamic information hubs. These smart scoreboards offer real-time data, interactive fan engagement features, and seamless integration with broadcasting systems, making them indispensable for modern sports venues and training facilities. The rising global popularity of various sports, coupled with substantial investments in upgrading sports infrastructure worldwide, further fuels this market's upward trajectory. The demand for sophisticated solutions that enhance the spectator experience and provide valuable analytical data for athletes and coaches is a key differentiator for smart scoreboards.

Smart Scoreboard Market Size (In Million)
The market's expansion is further supported by evolving trends in digital signage and the growing adoption of smart stadium concepts. While the market exhibits strong growth potential, certain restraints, such as the initial high cost of implementation for some advanced features and the need for robust technical infrastructure, could pose challenges. However, continuous technological advancements are leading to more cost-effective solutions, mitigating these concerns. Key players like Daktronics, Samsung, and Colorado Time Systems are actively innovating, introducing features that cater to diverse applications, from professional stadiums and competition venues to training centers and even smaller community sports facilities. The market is segmented by application, with stadiums and competition venues leading the adoption, and by type, with both indoor and outdoor installations experiencing significant demand. Regional insights indicate strong market presence in North America and Europe, with substantial growth opportunities emerging in the Asia Pacific region.
Smart Scoreboard Company Market Share
Smart Scoreboard Market Analysis: Driving Innovation and Dominance (2019-2033)
This comprehensive report provides an in-depth analysis of the global Smart Scoreboard market. Spanning the historical period of 2019-2024, with a base year of 2025 and a forecast period extending to 2033, this study offers critical insights into market concentration, key trends, regional dominance, product innovations, challenges, growth drivers, and emerging opportunities. With an estimated market size poised for significant expansion, this report is an indispensable resource for industry stakeholders seeking to understand and capitalize on the dynamic smart scoreboard industry.
Smart Scoreboard Market Concentration & Dynamics
The smart scoreboard market exhibits a moderate to high level of concentration, driven by the significant investments and technological expertise required for advanced display solutions. Key players like Daktronics, Colorado Time Systems, and NEVCO dominate a substantial portion of the market share, estimated at over 70%. The innovation ecosystem is robust, fueled by continuous advancements in LED technology, artificial intelligence for real-time data integration, and enhanced connectivity features. Regulatory frameworks are largely standardized, focusing on safety and display standards, though regional variations in accessibility and broadcasting rights can influence adoption rates. Substitute products, such as traditional static scoreboards or basic digital displays, are gradually losing ground as the demand for interactive and data-rich smart scoreboards escalates. End-user trends showcase a growing preference for visually engaging and data-driven experiences, particularly in stadiums and training centers. Merger and acquisition (M&A) activities, though not excessively frequent, have been strategic, aimed at consolidating market presence and acquiring innovative technologies. For instance, a notable M&A deal count of approximately 15-20 transactions between 2019 and 2024 has reshaped competitive landscapes.
Smart Scoreboard Industry Insights & Trends
The global smart scoreboard market is on an upward trajectory, driven by a confluence of technological advancements, increasing demand for enhanced sports viewing experiences, and the growing professionalization of sports at all levels. The market size is projected to reach an estimated 15,000 million by the end of the forecast period in 2033, exhibiting a Compound Annual Growth Rate (CAGR) of approximately 12.5% from the base year of 2025. Market growth drivers are multifaceted. The proliferation of high-definition displays and the integration of live video streaming, instant replays, and real-time statistics are revolutionizing how fans and athletes engage with sporting events. Technological disruptions, particularly in the realm of artificial intelligence (AI) and the Internet of Things (IoT), are enabling smart scoreboards to offer personalized content, predictive analytics, and even interactive fan engagement features. Evolving consumer behaviors, characterized by a desire for immersive and data-rich experiences, are further propelling the adoption of sophisticated smart scoreboard solutions. The increasing investment in sports infrastructure globally, from professional stadiums to amateur training centers, also directly contributes to the market's expansion. Furthermore, the integration of social media platforms for real-time updates and fan interaction is becoming a standard expectation. The development of more energy-efficient LED technologies and advancements in cloud-based management systems are also contributing to the market's sustained growth by reducing operational costs and enhancing flexibility for users.
Key Markets & Segments Leading Smart Scoreboard
The smart scoreboard market is witnessing significant growth across various applications and types, with the Stadium segment and Outdoor types currently holding dominant positions. Economically, countries with well-established professional sports leagues and a high disposable income for entertainment, such as the United States, China, and nations within Western Europe, are leading the charge in smart scoreboard adoption.
Drivers for Stadium Dominance:
- Fan Engagement: The critical need to enhance spectator experience through dynamic visuals, real-time statistics, and interactive content.
- Revenue Generation: Opportunities for advertising and sponsorships on large, high-impact displays.
- Broadcasting Standards: Increasingly stringent requirements for high-quality video feeds and integrated statistics for media coverage.
- Technological Integration: The ability to integrate with other stadium technologies like Wi-Fi, mobile apps, and ticketing systems.
Dominance of Outdoor Scoreboards:
- Visibility and Impact: Outdoor environments, especially large stadiums and public venues, necessitate robust and high-brightness displays for optimal viewing.
- Versatility: Outdoor smart scoreboards can cater to a broader range of events and applications beyond formal competitions, including community gatherings and public announcements.
- Durability: Advanced weatherproofing and robust construction are essential, making specialized outdoor solutions highly sought after.
While Stadiums lead, the Training Center segment is showing rapid growth due to the increasing demand for performance analysis and athlete development tools, often incorporating integrated video analysis and real-time biometric data displays. Competition applications remain a core driver, with advanced features becoming essential for professional and collegiate sports. The Others segment, encompassing venues like esports arenas, entertainment complexes, and educational institutions, is also a growing niche, attracted by the engaging visual capabilities of smart scoreboards. In terms of types, Outdoor smart scoreboards currently command a larger market share, but the adoption of sophisticated Indoor solutions is rapidly increasing, particularly in multi-purpose arenas and specialized sports facilities, driven by the demand for higher resolution and more intricate visual effects.
Smart Scoreboard Product Developments
Recent product developments in the smart scoreboard market are characterized by a strong emphasis on enhanced visual fidelity, advanced data integration, and user-friendly interfaces. Innovations include ultra-high-definition LED panels offering vibrant colors and exceptional contrast, enabling dynamic content delivery. Integration with AI-powered analytics platforms allows for real-time performance tracking, personalized fan experiences, and predictive insights. Furthermore, the development of modular and scalable smart scoreboard systems provides greater flexibility for customization and future upgrades. Market relevance is driven by the increasing demand for immersive fan engagement and sophisticated training tools, giving manufacturers like Samsung and Ultravisions a competitive edge.
Challenges in the Smart Scoreboard Market
The smart scoreboard market faces several challenges that could temper its growth. High initial investment costs for advanced systems remain a significant barrier for smaller venues and developing regions, impacting market penetration. The rapid pace of technological obsolescence necessitates continuous upgrades, adding to the total cost of ownership. Supply chain disruptions, particularly for specialized electronic components, can lead to production delays and increased costs, estimated to add 5-10% to project timelines in some cases. Cybersecurity concerns related to network-connected scoreboards and data privacy also require robust solutions. Furthermore, intense competition among established players and emerging manufacturers can lead to price wars, impacting profitability.
Forces Driving Smart Scoreboard Growth
The growth of the smart scoreboard market is propelled by several powerful forces. The escalating global demand for enhanced fan engagement and immersive sports experiences is a primary driver. Technological advancements in LED display technology, offering higher resolutions, better energy efficiency, and greater durability, are making smart scoreboards more accessible and attractive. The increasing professionalization of sports at all levels, including collegiate and amateur leagues, necessitates sophisticated performance tracking and data visualization tools, directly boosting demand for smart solutions. Furthermore, the growing adoption of these technologies in non-traditional sporting venues, such as esports arenas and training centers, broadens the market scope.
Challenges in the Smart Scoreboard Market
Long-term growth catalysts for the smart scoreboard market are rooted in continuous innovation and strategic market expansion. The ongoing evolution of AI and machine learning will unlock new possibilities for real-time data analysis, personalized fan experiences, and interactive content delivery, differentiating smart scoreboards beyond mere display functions. Strategic partnerships between scoreboard manufacturers and sports analytics companies will foster integrated solutions that offer comprehensive insights into athlete performance and game dynamics. Furthermore, expansion into emerging economies with developing sports infrastructure presents a significant opportunity for market penetration. The increasing focus on sustainability and energy efficiency in electronic displays will also drive demand for next-generation smart scoreboards.
Emerging Opportunities in Smart Scoreboard
Emerging opportunities in the smart scoreboard market lie in the growing demand for integrated venue management systems and augmented reality (AR) experiences. The development of smart scoreboards capable of seamless integration with other stadium technologies, such as Wi-Fi networks, mobile applications, and ticketing systems, presents a lucrative avenue. The potential for overlaying AR content onto live game feeds via smart scoreboards, offering fans deeper insights and interactive elements, is another significant trend. The expansion of esports events and the increasing need for sophisticated displays in these arenas also represent a rapidly growing niche. Furthermore, the integration of personalized advertising and fan engagement platforms directly through the scoreboard offers new revenue streams for venues.
Leading Players in the Smart Scoreboard Sector
- All American Scoreboards
- Colorado Time Systems
- Daktronics
- Electronic Displays, Inc.
- Euro Display
- Eversan, Inc.
- Fair-Play
- Formetco
- Harris Time
- LAMP Tech
- NEVCO
- OES
- Samsung
- Spectrum Scoreboards
- Ultravisions
- Varsity Scoreboards
Key Milestones in Smart Scoreboard Industry
- 2019: Introduction of AI-powered analytics for real-time player tracking and predictive game insights.
- 2020: Major advancements in outdoor LED display durability and weather resistance, enabling wider deployment.
- 2021: Increased integration of social media feeds and fan interaction features on scoreboards.
- 2022: Development of modular and scalable smart scoreboard systems for greater customization.
- 2023: Rise of esports arenas and demand for high-refresh-rate, low-latency displays.
- 2024: Enhanced focus on cybersecurity measures for networked smart scoreboard solutions.
- 2025: Expected significant market growth driven by post-pandemic sports event resurgence and infrastructure investments.
- 2026-2033: Continued innovation in AR integration, holographic displays, and energy-efficient technologies.
Strategic Outlook for Smart Scoreboard Market
The strategic outlook for the smart scoreboard market is exceptionally positive, driven by relentless innovation and expanding applications. The market is poised for sustained growth as technology continues to evolve, offering more interactive, data-rich, and visually stunning experiences. Key growth accelerators include the increasing adoption of smart scoreboards in emerging markets, the development of more affordable and scalable solutions, and the integration of advanced AI for predictive analytics and personalized fan engagement. Strategic opportunities lie in focusing on custom solutions for diverse venues, forging partnerships with content providers and data analytics firms, and leading the charge in sustainable display technologies. The future is bright for smart scoreboards to become indispensable components of any modern sporting or entertainment venue.
Smart Scoreboard Segmentation
-
1. Application
- 1.1. Stadium
- 1.2. Training Center
- 1.3. Competition
- 1.4. Others
-
2. Types
- 2.1. Indoor
- 2.2. Outdoor
Smart Scoreboard Segmentation By Geography
-
1. North America
- 1.1. United States
- 1.2. Canada
- 1.3. Mexico
-
2. South America
- 2.1. Brazil
- 2.2. Argentina
- 2.3. Rest of South America
-
3. Europe
- 3.1. United Kingdom
- 3.2. Germany
- 3.3. France
- 3.4. Italy
- 3.5. Spain
- 3.6. Russia
- 3.7. Benelux
- 3.8. Nordics
- 3.9. Rest of Europe
-
4. Middle East & Africa
- 4.1. Turkey
- 4.2. Israel
- 4.3. GCC
- 4.4. North Africa
- 4.5. South Africa
- 4.6. Rest of Middle East & Africa
-
5. Asia Pacific
- 5.1. China
- 5.2. India
- 5.3. Japan
- 5.4. South Korea
- 5.5. ASEAN
- 5.6. Oceania
- 5.7. Rest of Asia Pacific
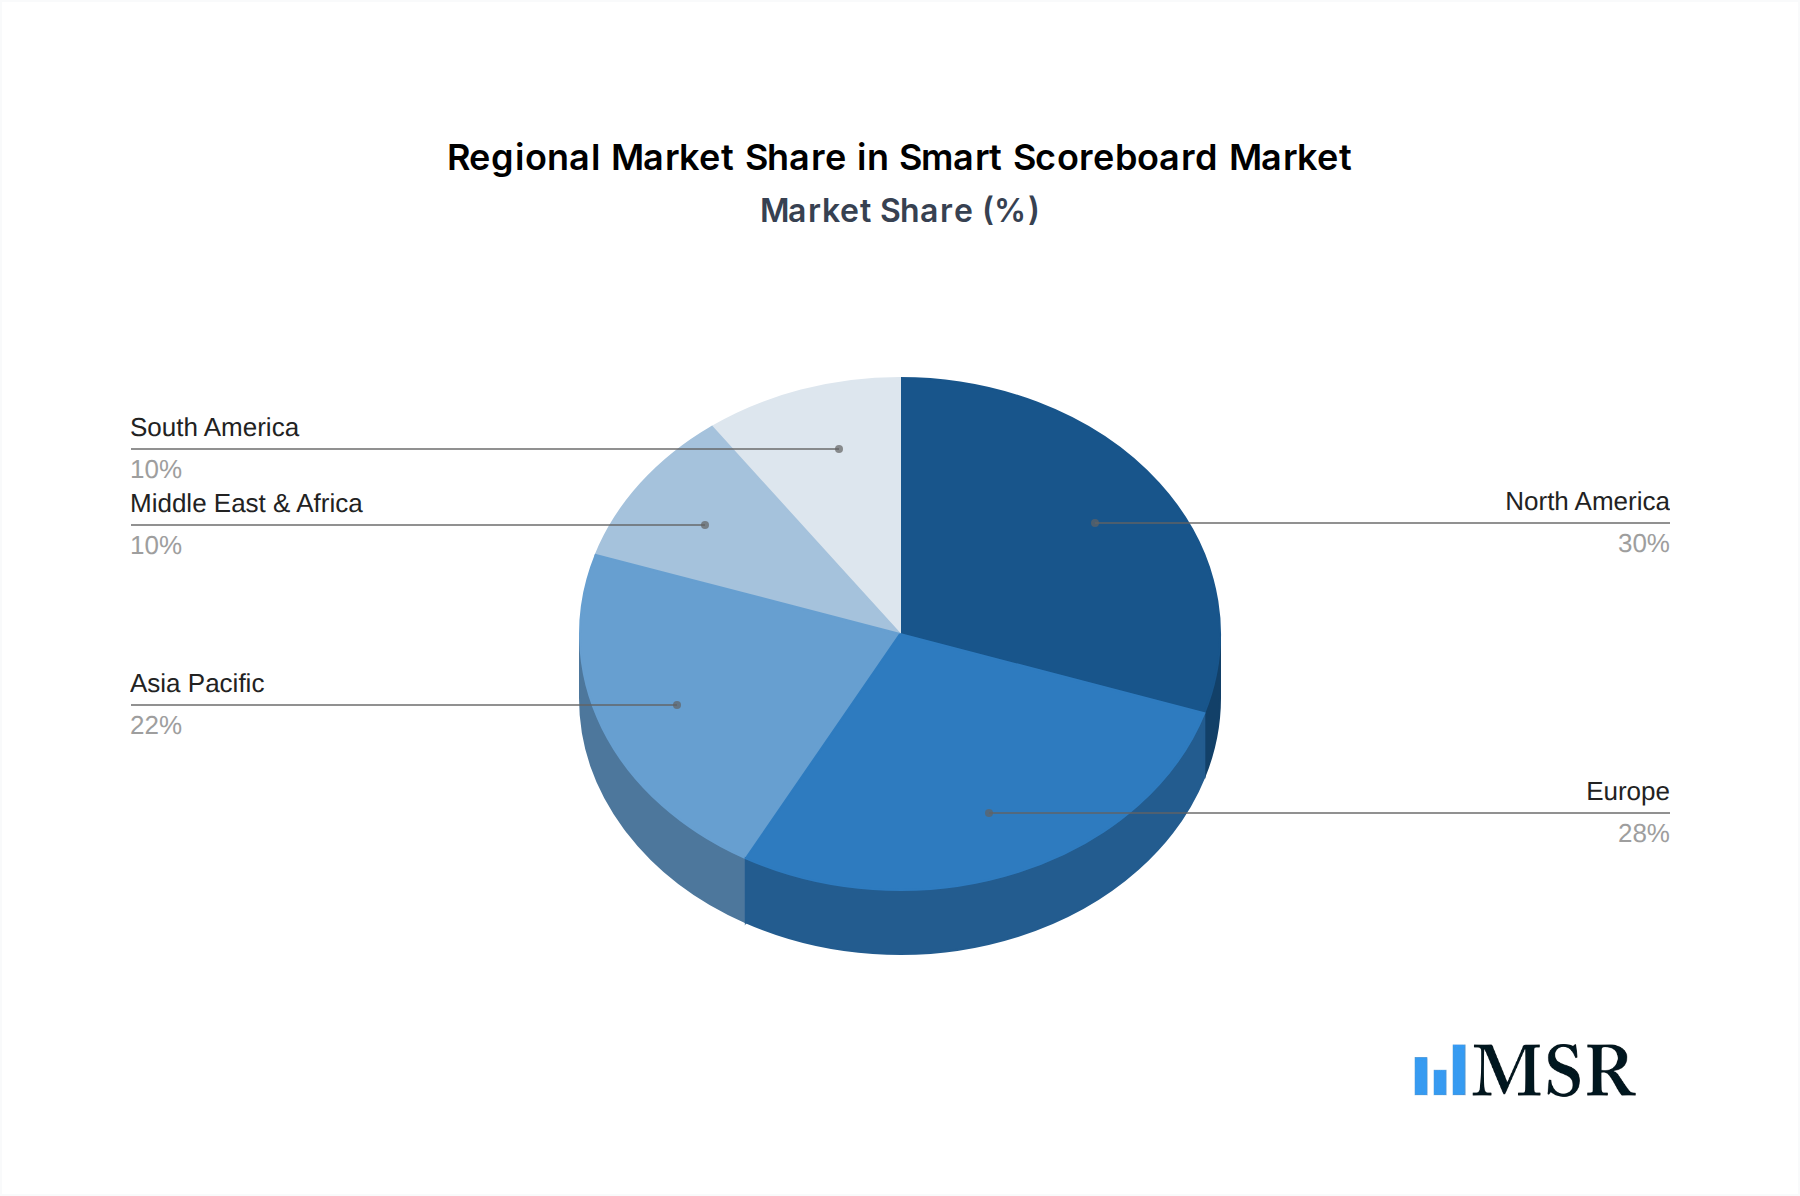
Smart Scoreboard Regional Market Share
Geographic Coverage of Smart Scoreboard
Smart Scoreboard REPORT HIGHLIGHTS
| Aspects | Details |
|---|---|
| Study Period | 2020-2034 |
| Base Year | 2025 |
| Estimated Year | 2026 |
| Forecast Period | 2026-2034 |
| Historical Period | 2020-2025 |
| Growth Rate | CAGR of 4.4% from 2020-2034 |
| Segmentation |
|
Table of Contents
- 1. Introduction
- 1.1. Research Scope
- 1.2. Market Segmentation
- 1.3. Research Objective
- 1.4. Definitions and Assumptions
- 2. Executive Summary
- 2.1. Market Snapshot
- 3. Market Dynamics
- 3.1. Market Drivers
- 3.2. Market Restrains
- 3.3. Market Trends
- 3.4. Market Opportunities
- 4. Market Factor Analysis
- 4.1. Porters Five Forces
- 4.1.1. Bargaining Power of Suppliers
- 4.1.2. Bargaining Power of Buyers
- 4.1.3. Threat of New Entrants
- 4.1.4. Threat of Substitutes
- 4.1.5. Competitive Rivalry
- 4.2. PESTEL analysis
- 4.3. BCG Analysis
- 4.3.1. Stars (High Growth, High Market Share)
- 4.3.2. Cash Cows (Low Growth, High Market Share)
- 4.3.3. Question Mark (High Growth, Low Market Share)
- 4.3.4. Dogs (Low Growth, Low Market Share)
- 4.4. Ansoff Matrix Analysis
- 4.5. Supply Chain Analysis
- 4.6. Regulatory Landscape
- 4.7. Current Market Potential and Opportunity Assessment (TAM–SAM–SOM Framework)
- 4.8. MSR Analyst Note
- 4.1. Porters Five Forces
- 5. Market Analysis, Insights and Forecast 2021-2033
- 5.1. Market Analysis, Insights and Forecast - by Application
- 5.1.1. Stadium
- 5.1.2. Training Center
- 5.1.3. Competition
- 5.1.4. Others
- 5.2. Market Analysis, Insights and Forecast - by Types
- 5.2.1. Indoor
- 5.2.2. Outdoor
- 5.3. Market Analysis, Insights and Forecast - by Region
- 5.3.1. North America
- 5.3.2. South America
- 5.3.3. Europe
- 5.3.4. Middle East & Africa
- 5.3.5. Asia Pacific
- 5.1. Market Analysis, Insights and Forecast - by Application
- 6. Global Smart Scoreboard Analysis, Insights and Forecast, 2021-2033
- 6.1. Market Analysis, Insights and Forecast - by Application
- 6.1.1. Stadium
- 6.1.2. Training Center
- 6.1.3. Competition
- 6.1.4. Others
- 6.2. Market Analysis, Insights and Forecast - by Types
- 6.2.1. Indoor
- 6.2.2. Outdoor
- 6.1. Market Analysis, Insights and Forecast - by Application
- 7. North America Smart Scoreboard Analysis, Insights and Forecast, 2020-2032
- 7.1. Market Analysis, Insights and Forecast - by Application
- 7.1.1. Stadium
- 7.1.2. Training Center
- 7.1.3. Competition
- 7.1.4. Others
- 7.2. Market Analysis, Insights and Forecast - by Types
- 7.2.1. Indoor
- 7.2.2. Outdoor
- 7.1. Market Analysis, Insights and Forecast - by Application
- 8. South America Smart Scoreboard Analysis, Insights and Forecast, 2020-2032
- 8.1. Market Analysis, Insights and Forecast - by Application
- 8.1.1. Stadium
- 8.1.2. Training Center
- 8.1.3. Competition
- 8.1.4. Others
- 8.2. Market Analysis, Insights and Forecast - by Types
- 8.2.1. Indoor
- 8.2.2. Outdoor
- 8.1. Market Analysis, Insights and Forecast - by Application
- 9. Europe Smart Scoreboard Analysis, Insights and Forecast, 2020-2032
- 9.1. Market Analysis, Insights and Forecast - by Application
- 9.1.1. Stadium
- 9.1.2. Training Center
- 9.1.3. Competition
- 9.1.4. Others
- 9.2. Market Analysis, Insights and Forecast - by Types
- 9.2.1. Indoor
- 9.2.2. Outdoor
- 9.1. Market Analysis, Insights and Forecast - by Application
- 10. Middle East & Africa Smart Scoreboard Analysis, Insights and Forecast, 2020-2032
- 10.1. Market Analysis, Insights and Forecast - by Application
- 10.1.1. Stadium
- 10.1.2. Training Center
- 10.1.3. Competition
- 10.1.4. Others
- 10.2. Market Analysis, Insights and Forecast - by Types
- 10.2.1. Indoor
- 10.2.2. Outdoor
- 10.1. Market Analysis, Insights and Forecast - by Application
- 11. Asia Pacific Smart Scoreboard Analysis, Insights and Forecast, 2020-2032
- 11.1. Market Analysis, Insights and Forecast - by Application
- 11.1.1. Stadium
- 11.1.2. Training Center
- 11.1.3. Competition
- 11.1.4. Others
- 11.2. Market Analysis, Insights and Forecast - by Types
- 11.2.1. Indoor
- 11.2.2. Outdoor
- 11.1. Market Analysis, Insights and Forecast - by Application
- 12. Competitive Analysis
- 12.1. Company Profiles
- 12.1.1 All American Scoreboards
- 12.1.1.1. Company Overview
- 12.1.1.2. Products
- 12.1.1.3. Company Financials
- 12.1.1.4. SWOT Analysis
- 12.1.2 Colorado Time Systems
- 12.1.2.1. Company Overview
- 12.1.2.2. Products
- 12.1.2.3. Company Financials
- 12.1.2.4. SWOT Analysis
- 12.1.3 Daktronics
- 12.1.3.1. Company Overview
- 12.1.3.2. Products
- 12.1.3.3. Company Financials
- 12.1.3.4. SWOT Analysis
- 12.1.4 Electronic Displays
- 12.1.4.1. Company Overview
- 12.1.4.2. Products
- 12.1.4.3. Company Financials
- 12.1.4.4. SWOT Analysis
- 12.1.5 Inc.
- 12.1.5.1. Company Overview
- 12.1.5.2. Products
- 12.1.5.3. Company Financials
- 12.1.5.4. SWOT Analysis
- 12.1.6 Euro Display
- 12.1.6.1. Company Overview
- 12.1.6.2. Products
- 12.1.6.3. Company Financials
- 12.1.6.4. SWOT Analysis
- 12.1.7 Eversan
- 12.1.7.1. Company Overview
- 12.1.7.2. Products
- 12.1.7.3. Company Financials
- 12.1.7.4. SWOT Analysis
- 12.1.8 Inc.
- 12.1.8.1. Company Overview
- 12.1.8.2. Products
- 12.1.8.3. Company Financials
- 12.1.8.4. SWOT Analysis
- 12.1.9 Fair-Play
- 12.1.9.1. Company Overview
- 12.1.9.2. Products
- 12.1.9.3. Company Financials
- 12.1.9.4. SWOT Analysis
- 12.1.10 Formetco
- 12.1.10.1. Company Overview
- 12.1.10.2. Products
- 12.1.10.3. Company Financials
- 12.1.10.4. SWOT Analysis
- 12.1.11 Harris Time
- 12.1.11.1. Company Overview
- 12.1.11.2. Products
- 12.1.11.3. Company Financials
- 12.1.11.4. SWOT Analysis
- 12.1.12 LAMP Tech
- 12.1.12.1. Company Overview
- 12.1.12.2. Products
- 12.1.12.3. Company Financials
- 12.1.12.4. SWOT Analysis
- 12.1.13 NEVCO
- 12.1.13.1. Company Overview
- 12.1.13.2. Products
- 12.1.13.3. Company Financials
- 12.1.13.4. SWOT Analysis
- 12.1.14 OES
- 12.1.14.1. Company Overview
- 12.1.14.2. Products
- 12.1.14.3. Company Financials
- 12.1.14.4. SWOT Analysis
- 12.1.15 Samsung
- 12.1.15.1. Company Overview
- 12.1.15.2. Products
- 12.1.15.3. Company Financials
- 12.1.15.4. SWOT Analysis
- 12.1.16 Spectrum Scoreboards
- 12.1.16.1. Company Overview
- 12.1.16.2. Products
- 12.1.16.3. Company Financials
- 12.1.16.4. SWOT Analysis
- 12.1.17 Ultravisions
- 12.1.17.1. Company Overview
- 12.1.17.2. Products
- 12.1.17.3. Company Financials
- 12.1.17.4. SWOT Analysis
- 12.1.18 Varsity Scoreboards
- 12.1.18.1. Company Overview
- 12.1.18.2. Products
- 12.1.18.3. Company Financials
- 12.1.18.4. SWOT Analysis
- 12.1.1 All American Scoreboards
- 12.2. Market Entropy
- 12.2.1 Company's Key Areas Served
- 12.2.2 Recent Developments
- 12.3. Company Market Share Analysis 2025
- 12.3.1 Top 5 Companies Market Share Analysis
- 12.3.2 Top 3 Companies Market Share Analysis
- 12.4. List of Potential Customers
- 13. Research Methodology
List of Figures
- Figure 1: Global Smart Scoreboard Revenue Breakdown (million, %) by Region 2025 & 2033
- Figure 2: North America Smart Scoreboard Revenue (million), by Application 2025 & 2033
- Figure 3: North America Smart Scoreboard Revenue Share (%), by Application 2025 & 2033
- Figure 4: North America Smart Scoreboard Revenue (million), by Types 2025 & 2033
- Figure 5: North America Smart Scoreboard Revenue Share (%), by Types 2025 & 2033
- Figure 6: North America Smart Scoreboard Revenue (million), by Country 2025 & 2033
- Figure 7: North America Smart Scoreboard Revenue Share (%), by Country 2025 & 2033
- Figure 8: South America Smart Scoreboard Revenue (million), by Application 2025 & 2033
- Figure 9: South America Smart Scoreboard Revenue Share (%), by Application 2025 & 2033
- Figure 10: South America Smart Scoreboard Revenue (million), by Types 2025 & 2033
- Figure 11: South America Smart Scoreboard Revenue Share (%), by Types 2025 & 2033
- Figure 12: South America Smart Scoreboard Revenue (million), by Country 2025 & 2033
- Figure 13: South America Smart Scoreboard Revenue Share (%), by Country 2025 & 2033
- Figure 14: Europe Smart Scoreboard Revenue (million), by Application 2025 & 2033
- Figure 15: Europe Smart Scoreboard Revenue Share (%), by Application 2025 & 2033
- Figure 16: Europe Smart Scoreboard Revenue (million), by Types 2025 & 2033
- Figure 17: Europe Smart Scoreboard Revenue Share (%), by Types 2025 & 2033
- Figure 18: Europe Smart Scoreboard Revenue (million), by Country 2025 & 2033
- Figure 19: Europe Smart Scoreboard Revenue Share (%), by Country 2025 & 2033
- Figure 20: Middle East & Africa Smart Scoreboard Revenue (million), by Application 2025 & 2033
- Figure 21: Middle East & Africa Smart Scoreboard Revenue Share (%), by Application 2025 & 2033
- Figure 22: Middle East & Africa Smart Scoreboard Revenue (million), by Types 2025 & 2033
- Figure 23: Middle East & Africa Smart Scoreboard Revenue Share (%), by Types 2025 & 2033
- Figure 24: Middle East & Africa Smart Scoreboard Revenue (million), by Country 2025 & 2033
- Figure 25: Middle East & Africa Smart Scoreboard Revenue Share (%), by Country 2025 & 2033
- Figure 26: Asia Pacific Smart Scoreboard Revenue (million), by Application 2025 & 2033
- Figure 27: Asia Pacific Smart Scoreboard Revenue Share (%), by Application 2025 & 2033
- Figure 28: Asia Pacific Smart Scoreboard Revenue (million), by Types 2025 & 2033
- Figure 29: Asia Pacific Smart Scoreboard Revenue Share (%), by Types 2025 & 2033
- Figure 30: Asia Pacific Smart Scoreboard Revenue (million), by Country 2025 & 2033
- Figure 31: Asia Pacific Smart Scoreboard Revenue Share (%), by Country 2025 & 2033
List of Tables
- Table 1: Global Smart Scoreboard Revenue million Forecast, by Application 2020 & 2033
- Table 2: Global Smart Scoreboard Revenue million Forecast, by Types 2020 & 2033
- Table 3: Global Smart Scoreboard Revenue million Forecast, by Region 2020 & 2033
- Table 4: Global Smart Scoreboard Revenue million Forecast, by Application 2020 & 2033
- Table 5: Global Smart Scoreboard Revenue million Forecast, by Types 2020 & 2033
- Table 6: Global Smart Scoreboard Revenue million Forecast, by Country 2020 & 2033
- Table 7: United States Smart Scoreboard Revenue (million) Forecast, by Application 2020 & 2033
- Table 8: Canada Smart Scoreboard Revenue (million) Forecast, by Application 2020 & 2033
- Table 9: Mexico Smart Scoreboard Revenue (million) Forecast, by Application 2020 & 2033
- Table 10: Global Smart Scoreboard Revenue million Forecast, by Application 2020 & 2033
- Table 11: Global Smart Scoreboard Revenue million Forecast, by Types 2020 & 2033
- Table 12: Global Smart Scoreboard Revenue million Forecast, by Country 2020 & 2033
- Table 13: Brazil Smart Scoreboard Revenue (million) Forecast, by Application 2020 & 2033
- Table 14: Argentina Smart Scoreboard Revenue (million) Forecast, by Application 2020 & 2033
- Table 15: Rest of South America Smart Scoreboard Revenue (million) Forecast, by Application 2020 & 2033
- Table 16: Global Smart Scoreboard Revenue million Forecast, by Application 2020 & 2033
- Table 17: Global Smart Scoreboard Revenue million Forecast, by Types 2020 & 2033
- Table 18: Global Smart Scoreboard Revenue million Forecast, by Country 2020 & 2033
- Table 19: United Kingdom Smart Scoreboard Revenue (million) Forecast, by Application 2020 & 2033
- Table 20: Germany Smart Scoreboard Revenue (million) Forecast, by Application 2020 & 2033
- Table 21: France Smart Scoreboard Revenue (million) Forecast, by Application 2020 & 2033
- Table 22: Italy Smart Scoreboard Revenue (million) Forecast, by Application 2020 & 2033
- Table 23: Spain Smart Scoreboard Revenue (million) Forecast, by Application 2020 & 2033
- Table 24: Russia Smart Scoreboard Revenue (million) Forecast, by Application 2020 & 2033
- Table 25: Benelux Smart Scoreboard Revenue (million) Forecast, by Application 2020 & 2033
- Table 26: Nordics Smart Scoreboard Revenue (million) Forecast, by Application 2020 & 2033
- Table 27: Rest of Europe Smart Scoreboard Revenue (million) Forecast, by Application 2020 & 2033
- Table 28: Global Smart Scoreboard Revenue million Forecast, by Application 2020 & 2033
- Table 29: Global Smart Scoreboard Revenue million Forecast, by Types 2020 & 2033
- Table 30: Global Smart Scoreboard Revenue million Forecast, by Country 2020 & 2033
- Table 31: Turkey Smart Scoreboard Revenue (million) Forecast, by Application 2020 & 2033
- Table 32: Israel Smart Scoreboard Revenue (million) Forecast, by Application 2020 & 2033
- Table 33: GCC Smart Scoreboard Revenue (million) Forecast, by Application 2020 & 2033
- Table 34: North Africa Smart Scoreboard Revenue (million) Forecast, by Application 2020 & 2033
- Table 35: South Africa Smart Scoreboard Revenue (million) Forecast, by Application 2020 & 2033
- Table 36: Rest of Middle East & Africa Smart Scoreboard Revenue (million) Forecast, by Application 2020 & 2033
- Table 37: Global Smart Scoreboard Revenue million Forecast, by Application 2020 & 2033
- Table 38: Global Smart Scoreboard Revenue million Forecast, by Types 2020 & 2033
- Table 39: Global Smart Scoreboard Revenue million Forecast, by Country 2020 & 2033
- Table 40: China Smart Scoreboard Revenue (million) Forecast, by Application 2020 & 2033
- Table 41: India Smart Scoreboard Revenue (million) Forecast, by Application 2020 & 2033
- Table 42: Japan Smart Scoreboard Revenue (million) Forecast, by Application 2020 & 2033
- Table 43: South Korea Smart Scoreboard Revenue (million) Forecast, by Application 2020 & 2033
- Table 44: ASEAN Smart Scoreboard Revenue (million) Forecast, by Application 2020 & 2033
- Table 45: Oceania Smart Scoreboard Revenue (million) Forecast, by Application 2020 & 2033
- Table 46: Rest of Asia Pacific Smart Scoreboard Revenue (million) Forecast, by Application 2020 & 2033
Frequently Asked Questions
1. What is the projected Compound Annual Growth Rate (CAGR) of the Smart Scoreboard?
The projected CAGR is approximately 4.4%.
2. Which companies are prominent players in the Smart Scoreboard?
Key companies in the market include All American Scoreboards, Colorado Time Systems, Daktronics, Electronic Displays, Inc., Euro Display, Eversan, Inc., Fair-Play, Formetco, Harris Time, LAMP Tech, NEVCO, OES, Samsung, Spectrum Scoreboards, Ultravisions, Varsity Scoreboards.
3. What are the main segments of the Smart Scoreboard?
The market segments include Application, Types.
4. Can you provide details about the market size?
The market size is estimated to be USD 336 million as of 2022.
5. What are some drivers contributing to market growth?
N/A
6. What are the notable trends driving market growth?
N/A
7. Are there any restraints impacting market growth?
N/A
8. Can you provide examples of recent developments in the market?
N/A
9. What pricing options are available for accessing the report?
Pricing options include single-user, multi-user, and enterprise licenses priced at USD 2900.00, USD 4350.00, and USD 5800.00 respectively.
10. Is the market size provided in terms of value or volume?
The market size is provided in terms of value, measured in million.
11. Are there any specific market keywords associated with the report?
Yes, the market keyword associated with the report is "Smart Scoreboard," which aids in identifying and referencing the specific market segment covered.
12. How do I determine which pricing option suits my needs best?
The pricing options vary based on user requirements and access needs. Individual users may opt for single-user licenses, while businesses requiring broader access may choose multi-user or enterprise licenses for cost-effective access to the report.
13. Are there any additional resources or data provided in the Smart Scoreboard report?
While the report offers comprehensive insights, it's advisable to review the specific contents or supplementary materials provided to ascertain if additional resources or data are available.
14. How can I stay updated on further developments or reports in the Smart Scoreboard?
To stay informed about further developments, trends, and reports in the Smart Scoreboard, consider subscribing to industry newsletters, following relevant companies and organizations, or regularly checking reputable industry news sources and publications.
Methodology
Step 1 - Identification of Relevant Samples Size from Population Database


Step 2 - Approaches for Defining Global Market Size (Value, Volume* & Price*)

Note*: In applicable scenarios
Step 3 - Data Sources
Primary Research
- Web Analytics
- Survey Reports
- Research Institute
- Latest Research Reports
- Opinion Leaders
Secondary Research
- Annual Reports
- White Paper
- Latest Press Release
- Industry Association
- Paid Database
- Investor Presentations

Step 4 - Data Triangulation
Involves using different sources of information in order to increase the validity of a study
These sources are likely to be stakeholders in a program - participants, other researchers, program staff, other community members, and so on.
Then we put all data in single framework & apply various statistical tools to find out the dynamic on the market.
During the analysis stage, feedback from the stakeholder groups would be compared to determine areas of agreement as well as areas of divergence