

Key Insights
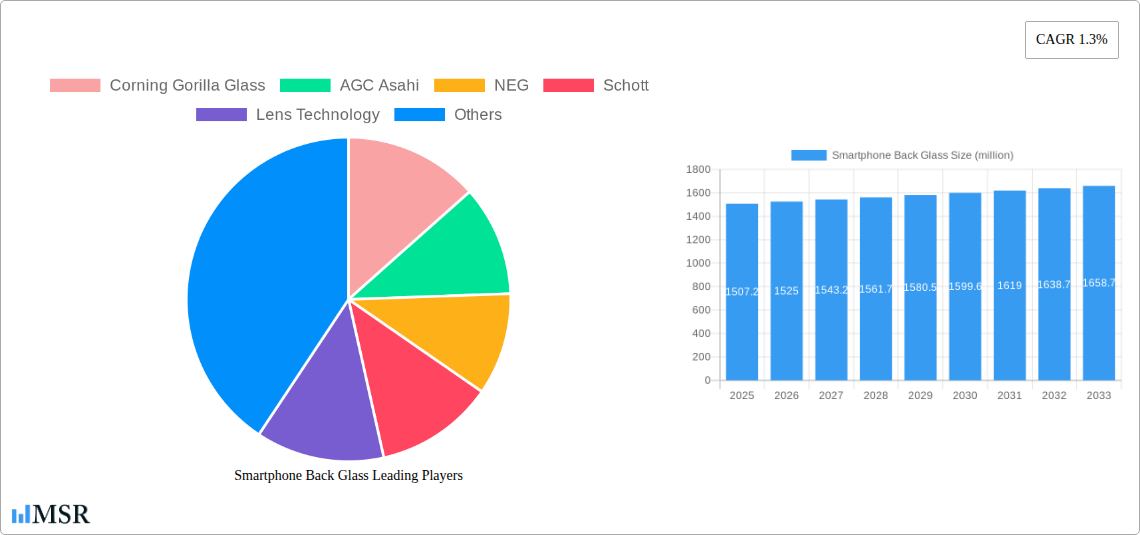
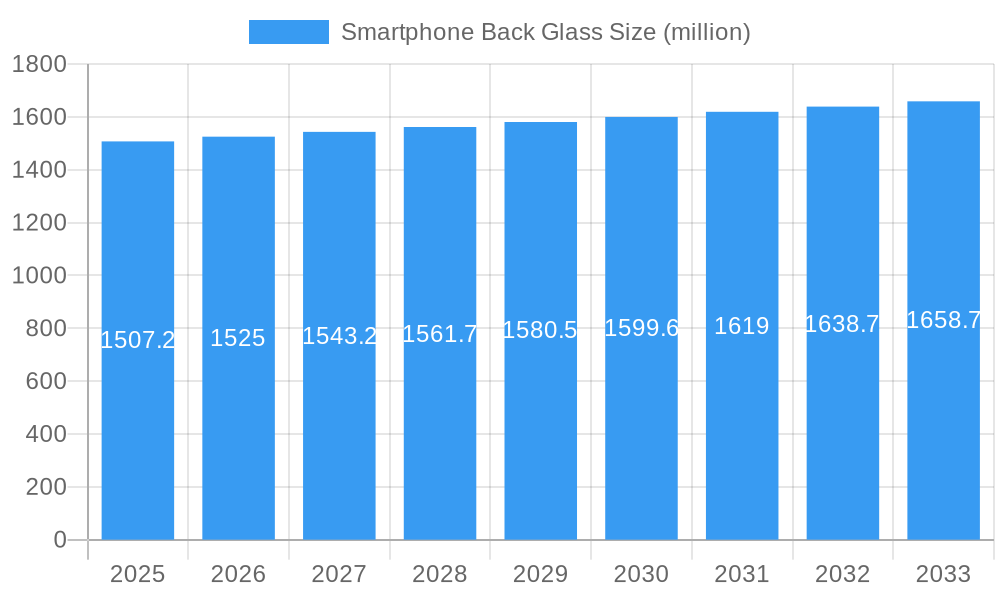
The global smartphone back glass market, valued at $1507.2 million in 2025, is projected to experience steady growth, driven primarily by the increasing demand for premium smartphones featuring aesthetically pleasing and durable back panels. The market's Compound Annual Growth Rate (CAGR) of 1.3% reflects a relatively stable growth trajectory, influenced by factors such as smartphone market saturation in developed regions and fluctuating economic conditions. Innovation in materials science, including the development of more scratch-resistant and shatterproof glasses, as well as the adoption of advanced manufacturing processes, are key drivers. The rising popularity of in-glass fingerprint sensors further fuels market demand, as this technology necessitates the use of high-quality back glass. However, the market faces restraints such as the increasing adoption of alternative materials like plastic and ceramic in budget smartphones and the cyclical nature of the smartphone market itself, which can impact overall demand. Major players like Corning Gorilla Glass, AGC Asahi, and others constantly compete to innovate and offer superior solutions, ensuring a dynamic market landscape.
Smartphone Back Glass Market Size (In Billion)
The segmentation within the smartphone back glass market is likely driven by glass type (e.g., aluminosilicate, borosilicate), manufacturing process (e.g., float glass, chemically strengthened glass), and application (e.g., flagship smartphones, mid-range smartphones, budget smartphones). The regional distribution probably mirrors global smartphone sales patterns, with significant markets in North America, Asia-Pacific, and Europe. Future growth will likely be fueled by emerging markets and technological advancements such as the integration of flexible and foldable screen technology requiring specialized back glass solutions. Competition among manufacturers will remain intense, requiring continuous innovation in material science and manufacturing techniques to gain a competitive edge. The market's steady growth reflects the enduring importance of a premium back panel to the overall appeal and perceived value of smartphones.
Smartphone Back Glass Company Market Share
Smartphone Back Glass Market Report: 2019-2033 - A Comprehensive Analysis
This in-depth report provides a comprehensive analysis of the global smartphone back glass market, offering invaluable insights for industry stakeholders, investors, and strategic decision-makers. The report meticulously examines market dynamics, key players, technological advancements, and future growth prospects, covering the period 2019-2033, with a focus on 2025. The global market is projected to reach xx million units by 2033, showcasing significant growth potential.
Smartphone Back Glass Market Concentration & Dynamics
The global smartphone back glass market exhibits a moderately concentrated landscape, with key players like Corning Gorilla Glass, AGC Asahi, and NEG holding significant market share. The market share distribution in 2025 is estimated as follows: Corning Gorilla Glass (xx%), AGC Asahi (xx%), NEG (xx%), and others (xx%). The remaining market share is divided among other prominent players such as Schott, Lens Technology, Biel Crystal, TPK, Sichuan Xuhong Optoelectronic Technology Co., Shenzhen O-film, AvanStrate, Zhejiang Firstar Panel Technology Co.,Ltd.
Innovation in materials science, particularly in scratch-resistant and durable glass solutions, is a key driver. Regulatory frameworks concerning material sourcing and environmental impact are increasingly influencing market dynamics. Substitute products, such as plastic and ceramic alternatives, present competition, albeit with limitations in terms of aesthetics and durability. Consumer preference for premium designs and features consistently drives demand for high-quality back glass. The historical period (2019-2024) witnessed xx major M&A deals, primarily focused on strengthening supply chains and expanding product portfolios. The forecast period (2025-2033) anticipates an increase in M&A activity as companies strive for consolidation and technological leadership.
Smartphone Back Glass Industry Insights & Trends
The global smartphone back glass market experienced robust growth during the historical period (2019-2024), with a CAGR of xx%. The market size in 2025 is estimated at xx million units, driven by the ever-increasing demand for smartphones globally. Several factors contribute to this growth, including the rising adoption of 5G technology, which necessitates more durable and aesthetically pleasing back panels. Technological disruptions, such as the introduction of foldable smartphones and under-display camera technology, are significantly impacting back glass design and manufacturing processes. Consumer preference for premium devices with advanced features continues to fuel market expansion. The evolving consumer behavior towards personalized and durable smartphones is influencing market trends, leading to innovations in customization and material enhancements.
Key Markets & Segments Leading Smartphone Back Glass
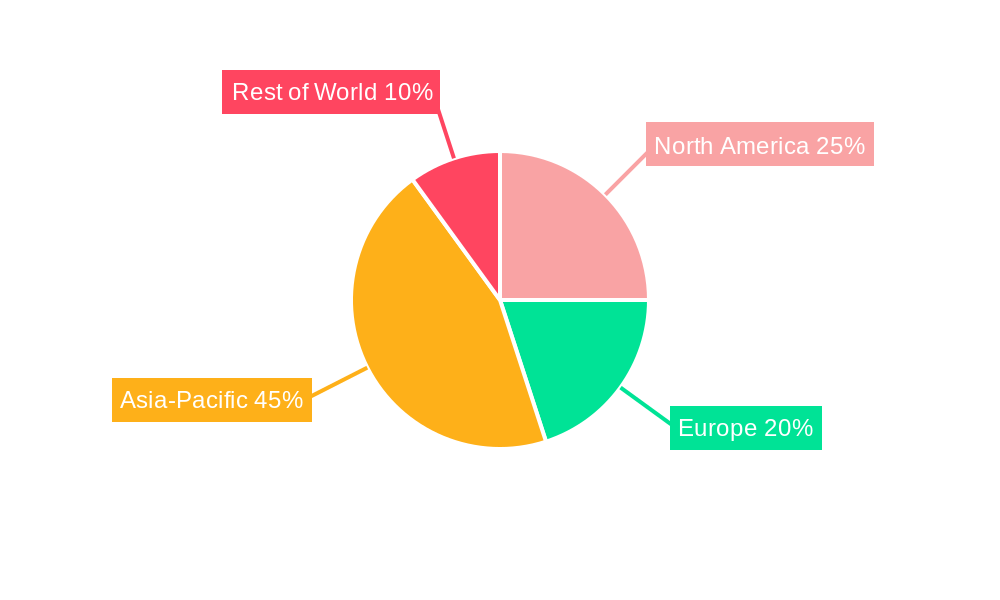
The Asia-Pacific region dominates the global smartphone back glass market, accounting for xx% of the total market share in 2025. This dominance stems from several factors:
- High Smartphone Penetration: The region boasts a massive and rapidly growing smartphone user base.
- Robust Manufacturing Base: A substantial portion of global smartphone manufacturing takes place in the Asia-Pacific region.
- Favorable Economic Conditions: Sustained economic growth in several key Asian economies contributes to increased consumer spending on electronics.
- Technological Advancement: Several leading smartphone back glass manufacturers are based in the Asia-Pacific region, driving innovation and competition.
Within the Asia-Pacific region, China remains the leading market, followed by India and other Southeast Asian nations. The European and North American markets also show significant demand, driven by high per capita income and advanced technological adoption.
Smartphone Back Glass Product Developments
Recent advancements in smartphone back glass include enhanced scratch resistance, improved durability, and the incorporation of features like wireless charging capabilities. Manufacturers are investing heavily in developing lightweight yet robust glass solutions, incorporating innovative surface treatments for improved aesthetics and functionality. The integration of advanced materials and manufacturing techniques is leading to the production of thinner, more flexible, and aesthetically pleasing glass panels. These advancements enable enhanced design possibilities for smartphones and improve their overall user experience.
Challenges in the Smartphone Back Glass Market
Several challenges hinder the growth of the smartphone back glass market. These include:
- Supply Chain Disruptions: Geopolitical events and pandemics can significantly impact material sourcing and manufacturing processes.
- Fluctuating Raw Material Prices: Changes in the prices of raw materials directly affect production costs and profitability.
- Intense Competition: The market is highly competitive, with numerous manufacturers vying for market share.
- Regulatory Compliance: Meeting stringent environmental and safety regulations adds to production costs. These challenges are estimated to have caused a xx% reduction in projected market growth in 2024.
Forces Driving Smartphone Back Glass Growth
Several factors drive the growth of the smartphone back glass market, including:
- Technological Advancements: Continuous innovation in materials science and manufacturing processes leads to enhanced product features and functionalities.
- Rising Smartphone Adoption: Increasing smartphone penetration globally fuels demand for back glass panels.
- Premiumization of Smartphones: The trend towards premium smartphones with advanced features drives the demand for high-quality back glass.
- Government Initiatives: Government support for the electronics industry in several countries stimulates market growth.
Long-Term Growth Catalysts in Smartphone Back Glass
Long-term growth in the smartphone back glass market will be driven by strategic partnerships, collaborations, and expanding into new application areas beyond smartphones, such as wearables and other smart devices. Innovations in manufacturing processes and the development of sustainable materials will also propel long-term growth. Expanding into emerging markets with increasing smartphone penetration will provide significant opportunities.
Emerging Opportunities in Smartphone Back Glass
The smartphone back glass market presents several emerging opportunities:
- Development of flexible and foldable glass: This addresses the rising popularity of foldable smartphones.
- Integration of advanced functionalities: Incorporating features like in-display fingerprint sensors enhances user experience.
- Sustainable and eco-friendly materials: Using recycled and bio-based materials caters to growing environmental concerns.
- Expansion into new applications: Targeting wearables and other smart devices opens up new avenues for growth.
Leading Players in the Smartphone Back Glass Sector
- Corning Gorilla Glass
- AGC Asahi
- NEG
- Schott
- Lens Technology
- Biel Crystal
- TPK
- Sichuan Xuhong Optoelectronic Technology Co.
- Shenzhen O-film
- AvanStrate
- Zhejiang Firstar Panel Technology Co.,Ltd.
Key Milestones in Smartphone Back Glass Industry
- 2020: Introduction of significantly improved scratch-resistant glass by Corning.
- 2021: Several major manufacturers announced partnerships for developing sustainable glass production.
- 2022: Significant investment in R&D for flexible glass technology.
- 2023: Several M&A activities involving key players to consolidate market position.
- 2024: First commercial launch of under-display camera technology using advanced glass.
Strategic Outlook for Smartphone Back Glass Market
The smartphone back glass market is poised for robust growth in the coming years, driven by technological advancements, rising smartphone adoption, and the increasing demand for premium devices. Strategic partnerships, investments in R&D, and expansion into new application areas will be crucial for companies to maintain a competitive edge and capitalize on emerging opportunities. The market's future is bright, particularly with the continued focus on innovation and sustainability.
Smartphone Back Glass Segmentation
-
1. Application
- 1.1. IOS Smartphones
- 1.2. Android Smartphones
- 1.3. Others
-
2. Types
- 2.1. 2D
- 2.2. 2.5D
- 2.3. 3D
Smartphone Back Glass Segmentation By Geography
-
1. North America
- 1.1. United States
- 1.2. Canada
- 1.3. Mexico
-
2. South America
- 2.1. Brazil
- 2.2. Argentina
- 2.3. Rest of South America
-
3. Europe
- 3.1. United Kingdom
- 3.2. Germany
- 3.3. France
- 3.4. Italy
- 3.5. Spain
- 3.6. Russia
- 3.7. Benelux
- 3.8. Nordics
- 3.9. Rest of Europe
-
4. Middle East & Africa
- 4.1. Turkey
- 4.2. Israel
- 4.3. GCC
- 4.4. North Africa
- 4.5. South Africa
- 4.6. Rest of Middle East & Africa
-
5. Asia Pacific
- 5.1. China
- 5.2. India
- 5.3. Japan
- 5.4. South Korea
- 5.5. ASEAN
- 5.6. Oceania
- 5.7. Rest of Asia Pacific
Smartphone Back Glass Regional Market Share
Geographic Coverage of Smartphone Back Glass
Smartphone Back Glass REPORT HIGHLIGHTS
| Aspects | Details |
|---|---|
| Study Period | 2020-2034 |
| Base Year | 2025 |
| Estimated Year | 2026 |
| Forecast Period | 2026-2034 |
| Historical Period | 2020-2025 |
| Growth Rate | CAGR of 1.3% from 2020-2034 |
| Segmentation |
|
Table of Contents
- 1. Introduction
- 1.1. Research Scope
- 1.2. Market Segmentation
- 1.3. Research Objective
- 1.4. Definitions and Assumptions
- 2. Executive Summary
- 2.1. Market Snapshot
- 3. Market Dynamics
- 3.1. Market Drivers
- 3.2. Market Restrains
- 3.3. Market Trends
- 3.4. Market Opportunities
- 4. Market Factor Analysis
- 4.1. Porters Five Forces
- 4.1.1. Bargaining Power of Suppliers
- 4.1.2. Bargaining Power of Buyers
- 4.1.3. Threat of New Entrants
- 4.1.4. Threat of Substitutes
- 4.1.5. Competitive Rivalry
- 4.2. PESTEL analysis
- 4.3. BCG Analysis
- 4.3.1. Stars (High Growth, High Market Share)
- 4.3.2. Cash Cows (Low Growth, High Market Share)
- 4.3.3. Question Mark (High Growth, Low Market Share)
- 4.3.4. Dogs (Low Growth, Low Market Share)
- 4.4. Ansoff Matrix Analysis
- 4.5. Supply Chain Analysis
- 4.6. Regulatory Landscape
- 4.7. Current Market Potential and Opportunity Assessment (TAM–SAM–SOM Framework)
- 4.8. MSR Analyst Note
- 4.1. Porters Five Forces
- 5. Market Analysis, Insights and Forecast 2021-2033
- 5.1. Market Analysis, Insights and Forecast - by Application
- 5.1.1. IOS Smartphones
- 5.1.2. Android Smartphones
- 5.1.3. Others
- 5.2. Market Analysis, Insights and Forecast - by Types
- 5.2.1. 2D
- 5.2.2. 2.5D
- 5.2.3. 3D
- 5.3. Market Analysis, Insights and Forecast - by Region
- 5.3.1. North America
- 5.3.2. South America
- 5.3.3. Europe
- 5.3.4. Middle East & Africa
- 5.3.5. Asia Pacific
- 5.1. Market Analysis, Insights and Forecast - by Application
- 6. Global Smartphone Back Glass Analysis, Insights and Forecast, 2021-2033
- 6.1. Market Analysis, Insights and Forecast - by Application
- 6.1.1. IOS Smartphones
- 6.1.2. Android Smartphones
- 6.1.3. Others
- 6.2. Market Analysis, Insights and Forecast - by Types
- 6.2.1. 2D
- 6.2.2. 2.5D
- 6.2.3. 3D
- 6.1. Market Analysis, Insights and Forecast - by Application
- 7. North America Smartphone Back Glass Analysis, Insights and Forecast, 2020-2032
- 7.1. Market Analysis, Insights and Forecast - by Application
- 7.1.1. IOS Smartphones
- 7.1.2. Android Smartphones
- 7.1.3. Others
- 7.2. Market Analysis, Insights and Forecast - by Types
- 7.2.1. 2D
- 7.2.2. 2.5D
- 7.2.3. 3D
- 7.1. Market Analysis, Insights and Forecast - by Application
- 8. South America Smartphone Back Glass Analysis, Insights and Forecast, 2020-2032
- 8.1. Market Analysis, Insights and Forecast - by Application
- 8.1.1. IOS Smartphones
- 8.1.2. Android Smartphones
- 8.1.3. Others
- 8.2. Market Analysis, Insights and Forecast - by Types
- 8.2.1. 2D
- 8.2.2. 2.5D
- 8.2.3. 3D
- 8.1. Market Analysis, Insights and Forecast - by Application
- 9. Europe Smartphone Back Glass Analysis, Insights and Forecast, 2020-2032
- 9.1. Market Analysis, Insights and Forecast - by Application
- 9.1.1. IOS Smartphones
- 9.1.2. Android Smartphones
- 9.1.3. Others
- 9.2. Market Analysis, Insights and Forecast - by Types
- 9.2.1. 2D
- 9.2.2. 2.5D
- 9.2.3. 3D
- 9.1. Market Analysis, Insights and Forecast - by Application
- 10. Middle East & Africa Smartphone Back Glass Analysis, Insights and Forecast, 2020-2032
- 10.1. Market Analysis, Insights and Forecast - by Application
- 10.1.1. IOS Smartphones
- 10.1.2. Android Smartphones
- 10.1.3. Others
- 10.2. Market Analysis, Insights and Forecast - by Types
- 10.2.1. 2D
- 10.2.2. 2.5D
- 10.2.3. 3D
- 10.1. Market Analysis, Insights and Forecast - by Application
- 11. Asia Pacific Smartphone Back Glass Analysis, Insights and Forecast, 2020-2032
- 11.1. Market Analysis, Insights and Forecast - by Application
- 11.1.1. IOS Smartphones
- 11.1.2. Android Smartphones
- 11.1.3. Others
- 11.2. Market Analysis, Insights and Forecast - by Types
- 11.2.1. 2D
- 11.2.2. 2.5D
- 11.2.3. 3D
- 11.1. Market Analysis, Insights and Forecast - by Application
- 12. Competitive Analysis
- 12.1. Company Profiles
- 12.1.1 Corning Gorilla Glass
- 12.1.1.1. Company Overview
- 12.1.1.2. Products
- 12.1.1.3. Company Financials
- 12.1.1.4. SWOT Analysis
- 12.1.2 AGC Asahi
- 12.1.2.1. Company Overview
- 12.1.2.2. Products
- 12.1.2.3. Company Financials
- 12.1.2.4. SWOT Analysis
- 12.1.3 NEG
- 12.1.3.1. Company Overview
- 12.1.3.2. Products
- 12.1.3.3. Company Financials
- 12.1.3.4. SWOT Analysis
- 12.1.4 Schott
- 12.1.4.1. Company Overview
- 12.1.4.2. Products
- 12.1.4.3. Company Financials
- 12.1.4.4. SWOT Analysis
- 12.1.5 Lens Technology
- 12.1.5.1. Company Overview
- 12.1.5.2. Products
- 12.1.5.3. Company Financials
- 12.1.5.4. SWOT Analysis
- 12.1.6 Biel Crystal
- 12.1.6.1. Company Overview
- 12.1.6.2. Products
- 12.1.6.3. Company Financials
- 12.1.6.4. SWOT Analysis
- 12.1.7 TPK
- 12.1.7.1. Company Overview
- 12.1.7.2. Products
- 12.1.7.3. Company Financials
- 12.1.7.4. SWOT Analysis
- 12.1.8 Sichuan Xuhong Optoelectronic Technology Co.
- 12.1.8.1. Company Overview
- 12.1.8.2. Products
- 12.1.8.3. Company Financials
- 12.1.8.4. SWOT Analysis
- 12.1.9 Shenzhen O-film
- 12.1.9.1. Company Overview
- 12.1.9.2. Products
- 12.1.9.3. Company Financials
- 12.1.9.4. SWOT Analysis
- 12.1.10 AvanStrate
- 12.1.10.1. Company Overview
- 12.1.10.2. Products
- 12.1.10.3. Company Financials
- 12.1.10.4. SWOT Analysis
- 12.1.11 Lens Technology
- 12.1.11.1. Company Overview
- 12.1.11.2. Products
- 12.1.11.3. Company Financials
- 12.1.11.4. SWOT Analysis
- 12.1.12 BIEL Crystal
- 12.1.12.1. Company Overview
- 12.1.12.2. Products
- 12.1.12.3. Company Financials
- 12.1.12.4. SWOT Analysis
- 12.1.13 Zhejiang Firstar Panel Technology Co.
- 12.1.13.1. Company Overview
- 12.1.13.2. Products
- 12.1.13.3. Company Financials
- 12.1.13.4. SWOT Analysis
- 12.1.14 Ltd.
- 12.1.14.1. Company Overview
- 12.1.14.2. Products
- 12.1.14.3. Company Financials
- 12.1.14.4. SWOT Analysis
- 12.1.1 Corning Gorilla Glass
- 12.2. Market Entropy
- 12.2.1 Company's Key Areas Served
- 12.2.2 Recent Developments
- 12.3. Company Market Share Analysis 2025
- 12.3.1 Top 5 Companies Market Share Analysis
- 12.3.2 Top 3 Companies Market Share Analysis
- 12.4. List of Potential Customers
- 13. Research Methodology
List of Figures
- Figure 1: Global Smartphone Back Glass Revenue Breakdown (million, %) by Region 2025 & 2033
- Figure 2: Global Smartphone Back Glass Volume Breakdown (K, %) by Region 2025 & 2033
- Figure 3: North America Smartphone Back Glass Revenue (million), by Application 2025 & 2033
- Figure 4: North America Smartphone Back Glass Volume (K), by Application 2025 & 2033
- Figure 5: North America Smartphone Back Glass Revenue Share (%), by Application 2025 & 2033
- Figure 6: North America Smartphone Back Glass Volume Share (%), by Application 2025 & 2033
- Figure 7: North America Smartphone Back Glass Revenue (million), by Types 2025 & 2033
- Figure 8: North America Smartphone Back Glass Volume (K), by Types 2025 & 2033
- Figure 9: North America Smartphone Back Glass Revenue Share (%), by Types 2025 & 2033
- Figure 10: North America Smartphone Back Glass Volume Share (%), by Types 2025 & 2033
- Figure 11: North America Smartphone Back Glass Revenue (million), by Country 2025 & 2033
- Figure 12: North America Smartphone Back Glass Volume (K), by Country 2025 & 2033
- Figure 13: North America Smartphone Back Glass Revenue Share (%), by Country 2025 & 2033
- Figure 14: North America Smartphone Back Glass Volume Share (%), by Country 2025 & 2033
- Figure 15: South America Smartphone Back Glass Revenue (million), by Application 2025 & 2033
- Figure 16: South America Smartphone Back Glass Volume (K), by Application 2025 & 2033
- Figure 17: South America Smartphone Back Glass Revenue Share (%), by Application 2025 & 2033
- Figure 18: South America Smartphone Back Glass Volume Share (%), by Application 2025 & 2033
- Figure 19: South America Smartphone Back Glass Revenue (million), by Types 2025 & 2033
- Figure 20: South America Smartphone Back Glass Volume (K), by Types 2025 & 2033
- Figure 21: South America Smartphone Back Glass Revenue Share (%), by Types 2025 & 2033
- Figure 22: South America Smartphone Back Glass Volume Share (%), by Types 2025 & 2033
- Figure 23: South America Smartphone Back Glass Revenue (million), by Country 2025 & 2033
- Figure 24: South America Smartphone Back Glass Volume (K), by Country 2025 & 2033
- Figure 25: South America Smartphone Back Glass Revenue Share (%), by Country 2025 & 2033
- Figure 26: South America Smartphone Back Glass Volume Share (%), by Country 2025 & 2033
- Figure 27: Europe Smartphone Back Glass Revenue (million), by Application 2025 & 2033
- Figure 28: Europe Smartphone Back Glass Volume (K), by Application 2025 & 2033
- Figure 29: Europe Smartphone Back Glass Revenue Share (%), by Application 2025 & 2033
- Figure 30: Europe Smartphone Back Glass Volume Share (%), by Application 2025 & 2033
- Figure 31: Europe Smartphone Back Glass Revenue (million), by Types 2025 & 2033
- Figure 32: Europe Smartphone Back Glass Volume (K), by Types 2025 & 2033
- Figure 33: Europe Smartphone Back Glass Revenue Share (%), by Types 2025 & 2033
- Figure 34: Europe Smartphone Back Glass Volume Share (%), by Types 2025 & 2033
- Figure 35: Europe Smartphone Back Glass Revenue (million), by Country 2025 & 2033
- Figure 36: Europe Smartphone Back Glass Volume (K), by Country 2025 & 2033
- Figure 37: Europe Smartphone Back Glass Revenue Share (%), by Country 2025 & 2033
- Figure 38: Europe Smartphone Back Glass Volume Share (%), by Country 2025 & 2033
- Figure 39: Middle East & Africa Smartphone Back Glass Revenue (million), by Application 2025 & 2033
- Figure 40: Middle East & Africa Smartphone Back Glass Volume (K), by Application 2025 & 2033
- Figure 41: Middle East & Africa Smartphone Back Glass Revenue Share (%), by Application 2025 & 2033
- Figure 42: Middle East & Africa Smartphone Back Glass Volume Share (%), by Application 2025 & 2033
- Figure 43: Middle East & Africa Smartphone Back Glass Revenue (million), by Types 2025 & 2033
- Figure 44: Middle East & Africa Smartphone Back Glass Volume (K), by Types 2025 & 2033
- Figure 45: Middle East & Africa Smartphone Back Glass Revenue Share (%), by Types 2025 & 2033
- Figure 46: Middle East & Africa Smartphone Back Glass Volume Share (%), by Types 2025 & 2033
- Figure 47: Middle East & Africa Smartphone Back Glass Revenue (million), by Country 2025 & 2033
- Figure 48: Middle East & Africa Smartphone Back Glass Volume (K), by Country 2025 & 2033
- Figure 49: Middle East & Africa Smartphone Back Glass Revenue Share (%), by Country 2025 & 2033
- Figure 50: Middle East & Africa Smartphone Back Glass Volume Share (%), by Country 2025 & 2033
- Figure 51: Asia Pacific Smartphone Back Glass Revenue (million), by Application 2025 & 2033
- Figure 52: Asia Pacific Smartphone Back Glass Volume (K), by Application 2025 & 2033
- Figure 53: Asia Pacific Smartphone Back Glass Revenue Share (%), by Application 2025 & 2033
- Figure 54: Asia Pacific Smartphone Back Glass Volume Share (%), by Application 2025 & 2033
- Figure 55: Asia Pacific Smartphone Back Glass Revenue (million), by Types 2025 & 2033
- Figure 56: Asia Pacific Smartphone Back Glass Volume (K), by Types 2025 & 2033
- Figure 57: Asia Pacific Smartphone Back Glass Revenue Share (%), by Types 2025 & 2033
- Figure 58: Asia Pacific Smartphone Back Glass Volume Share (%), by Types 2025 & 2033
- Figure 59: Asia Pacific Smartphone Back Glass Revenue (million), by Country 2025 & 2033
- Figure 60: Asia Pacific Smartphone Back Glass Volume (K), by Country 2025 & 2033
- Figure 61: Asia Pacific Smartphone Back Glass Revenue Share (%), by Country 2025 & 2033
- Figure 62: Asia Pacific Smartphone Back Glass Volume Share (%), by Country 2025 & 2033
List of Tables
- Table 1: Global Smartphone Back Glass Revenue million Forecast, by Application 2020 & 2033
- Table 2: Global Smartphone Back Glass Volume K Forecast, by Application 2020 & 2033
- Table 3: Global Smartphone Back Glass Revenue million Forecast, by Types 2020 & 2033
- Table 4: Global Smartphone Back Glass Volume K Forecast, by Types 2020 & 2033
- Table 5: Global Smartphone Back Glass Revenue million Forecast, by Region 2020 & 2033
- Table 6: Global Smartphone Back Glass Volume K Forecast, by Region 2020 & 2033
- Table 7: Global Smartphone Back Glass Revenue million Forecast, by Application 2020 & 2033
- Table 8: Global Smartphone Back Glass Volume K Forecast, by Application 2020 & 2033
- Table 9: Global Smartphone Back Glass Revenue million Forecast, by Types 2020 & 2033
- Table 10: Global Smartphone Back Glass Volume K Forecast, by Types 2020 & 2033
- Table 11: Global Smartphone Back Glass Revenue million Forecast, by Country 2020 & 2033
- Table 12: Global Smartphone Back Glass Volume K Forecast, by Country 2020 & 2033
- Table 13: United States Smartphone Back Glass Revenue (million) Forecast, by Application 2020 & 2033
- Table 14: United States Smartphone Back Glass Volume (K) Forecast, by Application 2020 & 2033
- Table 15: Canada Smartphone Back Glass Revenue (million) Forecast, by Application 2020 & 2033
- Table 16: Canada Smartphone Back Glass Volume (K) Forecast, by Application 2020 & 2033
- Table 17: Mexico Smartphone Back Glass Revenue (million) Forecast, by Application 2020 & 2033
- Table 18: Mexico Smartphone Back Glass Volume (K) Forecast, by Application 2020 & 2033
- Table 19: Global Smartphone Back Glass Revenue million Forecast, by Application 2020 & 2033
- Table 20: Global Smartphone Back Glass Volume K Forecast, by Application 2020 & 2033
- Table 21: Global Smartphone Back Glass Revenue million Forecast, by Types 2020 & 2033
- Table 22: Global Smartphone Back Glass Volume K Forecast, by Types 2020 & 2033
- Table 23: Global Smartphone Back Glass Revenue million Forecast, by Country 2020 & 2033
- Table 24: Global Smartphone Back Glass Volume K Forecast, by Country 2020 & 2033
- Table 25: Brazil Smartphone Back Glass Revenue (million) Forecast, by Application 2020 & 2033
- Table 26: Brazil Smartphone Back Glass Volume (K) Forecast, by Application 2020 & 2033
- Table 27: Argentina Smartphone Back Glass Revenue (million) Forecast, by Application 2020 & 2033
- Table 28: Argentina Smartphone Back Glass Volume (K) Forecast, by Application 2020 & 2033
- Table 29: Rest of South America Smartphone Back Glass Revenue (million) Forecast, by Application 2020 & 2033
- Table 30: Rest of South America Smartphone Back Glass Volume (K) Forecast, by Application 2020 & 2033
- Table 31: Global Smartphone Back Glass Revenue million Forecast, by Application 2020 & 2033
- Table 32: Global Smartphone Back Glass Volume K Forecast, by Application 2020 & 2033
- Table 33: Global Smartphone Back Glass Revenue million Forecast, by Types 2020 & 2033
- Table 34: Global Smartphone Back Glass Volume K Forecast, by Types 2020 & 2033
- Table 35: Global Smartphone Back Glass Revenue million Forecast, by Country 2020 & 2033
- Table 36: Global Smartphone Back Glass Volume K Forecast, by Country 2020 & 2033
- Table 37: United Kingdom Smartphone Back Glass Revenue (million) Forecast, by Application 2020 & 2033
- Table 38: United Kingdom Smartphone Back Glass Volume (K) Forecast, by Application 2020 & 2033
- Table 39: Germany Smartphone Back Glass Revenue (million) Forecast, by Application 2020 & 2033
- Table 40: Germany Smartphone Back Glass Volume (K) Forecast, by Application 2020 & 2033
- Table 41: France Smartphone Back Glass Revenue (million) Forecast, by Application 2020 & 2033
- Table 42: France Smartphone Back Glass Volume (K) Forecast, by Application 2020 & 2033
- Table 43: Italy Smartphone Back Glass Revenue (million) Forecast, by Application 2020 & 2033
- Table 44: Italy Smartphone Back Glass Volume (K) Forecast, by Application 2020 & 2033
- Table 45: Spain Smartphone Back Glass Revenue (million) Forecast, by Application 2020 & 2033
- Table 46: Spain Smartphone Back Glass Volume (K) Forecast, by Application 2020 & 2033
- Table 47: Russia Smartphone Back Glass Revenue (million) Forecast, by Application 2020 & 2033
- Table 48: Russia Smartphone Back Glass Volume (K) Forecast, by Application 2020 & 2033
- Table 49: Benelux Smartphone Back Glass Revenue (million) Forecast, by Application 2020 & 2033
- Table 50: Benelux Smartphone Back Glass Volume (K) Forecast, by Application 2020 & 2033
- Table 51: Nordics Smartphone Back Glass Revenue (million) Forecast, by Application 2020 & 2033
- Table 52: Nordics Smartphone Back Glass Volume (K) Forecast, by Application 2020 & 2033
- Table 53: Rest of Europe Smartphone Back Glass Revenue (million) Forecast, by Application 2020 & 2033
- Table 54: Rest of Europe Smartphone Back Glass Volume (K) Forecast, by Application 2020 & 2033
- Table 55: Global Smartphone Back Glass Revenue million Forecast, by Application 2020 & 2033
- Table 56: Global Smartphone Back Glass Volume K Forecast, by Application 2020 & 2033
- Table 57: Global Smartphone Back Glass Revenue million Forecast, by Types 2020 & 2033
- Table 58: Global Smartphone Back Glass Volume K Forecast, by Types 2020 & 2033
- Table 59: Global Smartphone Back Glass Revenue million Forecast, by Country 2020 & 2033
- Table 60: Global Smartphone Back Glass Volume K Forecast, by Country 2020 & 2033
- Table 61: Turkey Smartphone Back Glass Revenue (million) Forecast, by Application 2020 & 2033
- Table 62: Turkey Smartphone Back Glass Volume (K) Forecast, by Application 2020 & 2033
- Table 63: Israel Smartphone Back Glass Revenue (million) Forecast, by Application 2020 & 2033
- Table 64: Israel Smartphone Back Glass Volume (K) Forecast, by Application 2020 & 2033
- Table 65: GCC Smartphone Back Glass Revenue (million) Forecast, by Application 2020 & 2033
- Table 66: GCC Smartphone Back Glass Volume (K) Forecast, by Application 2020 & 2033
- Table 67: North Africa Smartphone Back Glass Revenue (million) Forecast, by Application 2020 & 2033
- Table 68: North Africa Smartphone Back Glass Volume (K) Forecast, by Application 2020 & 2033
- Table 69: South Africa Smartphone Back Glass Revenue (million) Forecast, by Application 2020 & 2033
- Table 70: South Africa Smartphone Back Glass Volume (K) Forecast, by Application 2020 & 2033
- Table 71: Rest of Middle East & Africa Smartphone Back Glass Revenue (million) Forecast, by Application 2020 & 2033
- Table 72: Rest of Middle East & Africa Smartphone Back Glass Volume (K) Forecast, by Application 2020 & 2033
- Table 73: Global Smartphone Back Glass Revenue million Forecast, by Application 2020 & 2033
- Table 74: Global Smartphone Back Glass Volume K Forecast, by Application 2020 & 2033
- Table 75: Global Smartphone Back Glass Revenue million Forecast, by Types 2020 & 2033
- Table 76: Global Smartphone Back Glass Volume K Forecast, by Types 2020 & 2033
- Table 77: Global Smartphone Back Glass Revenue million Forecast, by Country 2020 & 2033
- Table 78: Global Smartphone Back Glass Volume K Forecast, by Country 2020 & 2033
- Table 79: China Smartphone Back Glass Revenue (million) Forecast, by Application 2020 & 2033
- Table 80: China Smartphone Back Glass Volume (K) Forecast, by Application 2020 & 2033
- Table 81: India Smartphone Back Glass Revenue (million) Forecast, by Application 2020 & 2033
- Table 82: India Smartphone Back Glass Volume (K) Forecast, by Application 2020 & 2033
- Table 83: Japan Smartphone Back Glass Revenue (million) Forecast, by Application 2020 & 2033
- Table 84: Japan Smartphone Back Glass Volume (K) Forecast, by Application 2020 & 2033
- Table 85: South Korea Smartphone Back Glass Revenue (million) Forecast, by Application 2020 & 2033
- Table 86: South Korea Smartphone Back Glass Volume (K) Forecast, by Application 2020 & 2033
- Table 87: ASEAN Smartphone Back Glass Revenue (million) Forecast, by Application 2020 & 2033
- Table 88: ASEAN Smartphone Back Glass Volume (K) Forecast, by Application 2020 & 2033
- Table 89: Oceania Smartphone Back Glass Revenue (million) Forecast, by Application 2020 & 2033
- Table 90: Oceania Smartphone Back Glass Volume (K) Forecast, by Application 2020 & 2033
- Table 91: Rest of Asia Pacific Smartphone Back Glass Revenue (million) Forecast, by Application 2020 & 2033
- Table 92: Rest of Asia Pacific Smartphone Back Glass Volume (K) Forecast, by Application 2020 & 2033
Frequently Asked Questions
1. What is the projected Compound Annual Growth Rate (CAGR) of the Smartphone Back Glass?
The projected CAGR is approximately 1.3%.
2. Which companies are prominent players in the Smartphone Back Glass?
Key companies in the market include Corning Gorilla Glass, AGC Asahi, NEG, Schott, Lens Technology, Biel Crystal, TPK, Sichuan Xuhong Optoelectronic Technology Co., Shenzhen O-film, AvanStrate, Lens Technology, BIEL Crystal, Zhejiang Firstar Panel Technology Co., Ltd..
3. What are the main segments of the Smartphone Back Glass?
The market segments include Application, Types.
4. Can you provide details about the market size?
The market size is estimated to be USD 1507.2 million as of 2022.
5. What are some drivers contributing to market growth?
N/A
6. What are the notable trends driving market growth?
N/A
7. Are there any restraints impacting market growth?
N/A
8. Can you provide examples of recent developments in the market?
N/A
9. What pricing options are available for accessing the report?
Pricing options include single-user, multi-user, and enterprise licenses priced at USD 3950.00, USD 5925.00, and USD 7900.00 respectively.
10. Is the market size provided in terms of value or volume?
The market size is provided in terms of value, measured in million and volume, measured in K.
11. Are there any specific market keywords associated with the report?
Yes, the market keyword associated with the report is "Smartphone Back Glass," which aids in identifying and referencing the specific market segment covered.
12. How do I determine which pricing option suits my needs best?
The pricing options vary based on user requirements and access needs. Individual users may opt for single-user licenses, while businesses requiring broader access may choose multi-user or enterprise licenses for cost-effective access to the report.
13. Are there any additional resources or data provided in the Smartphone Back Glass report?
While the report offers comprehensive insights, it's advisable to review the specific contents or supplementary materials provided to ascertain if additional resources or data are available.
14. How can I stay updated on further developments or reports in the Smartphone Back Glass?
To stay informed about further developments, trends, and reports in the Smartphone Back Glass, consider subscribing to industry newsletters, following relevant companies and organizations, or regularly checking reputable industry news sources and publications.
Methodology
Step 1 - Identification of Relevant Samples Size from Population Database


Step 2 - Approaches for Defining Global Market Size (Value, Volume* & Price*)

Note*: In applicable scenarios
Step 3 - Data Sources
Primary Research
- Web Analytics
- Survey Reports
- Research Institute
- Latest Research Reports
- Opinion Leaders
Secondary Research
- Annual Reports
- White Paper
- Latest Press Release
- Industry Association
- Paid Database
- Investor Presentations

Step 4 - Data Triangulation
Involves using different sources of information in order to increase the validity of a study
These sources are likely to be stakeholders in a program - participants, other researchers, program staff, other community members, and so on.
Then we put all data in single framework & apply various statistical tools to find out the dynamic on the market.
During the analysis stage, feedback from the stakeholder groups would be compared to determine areas of agreement as well as areas of divergence