

Key Insights
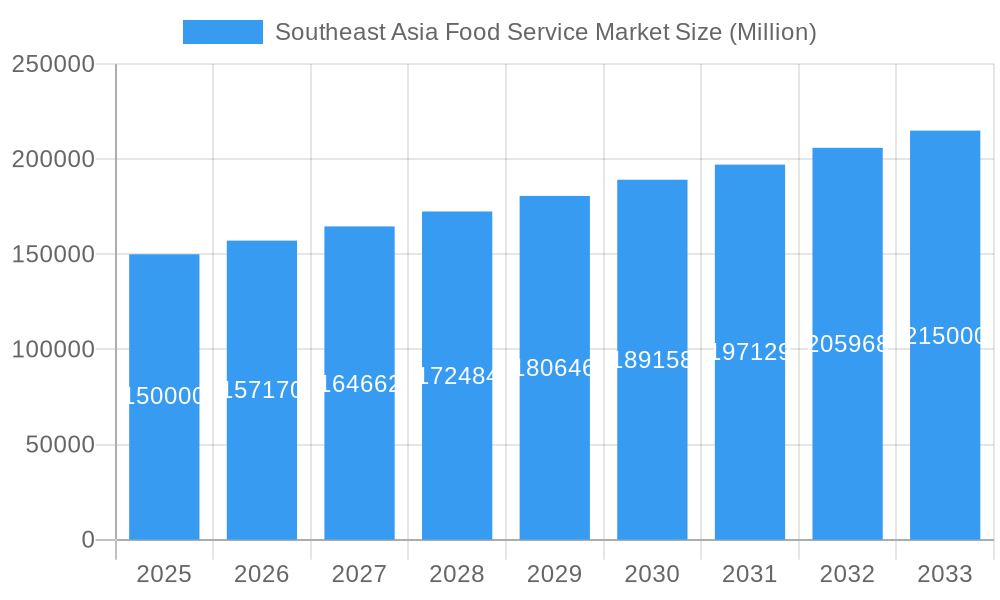
The Southeast Asia Food Service Market is poised for substantial expansion, driven by evolving consumer lifestyles, increasing disposable incomes, and a thriving tourism sector. This dynamic market, encompassing cafes, bars, and quick-service restaurants (QSRs), is projected to reach $223.8 billion by 2025, exhibiting a Compound Annual Growth Rate (CAGR) of 13.2%. Key growth drivers include rapid urbanization, a demand for convenience, and diverse culinary experiences. The market segmentation highlights strong potential within chained outlets due to brand recognition and economies of scale, alongside independent outlets that offer unique local flavors. Leisure, lodging, and travel segments are particularly promising, propelled by robust tourism growth.
Southeast Asia Food Service Market Market Size (In Billion)
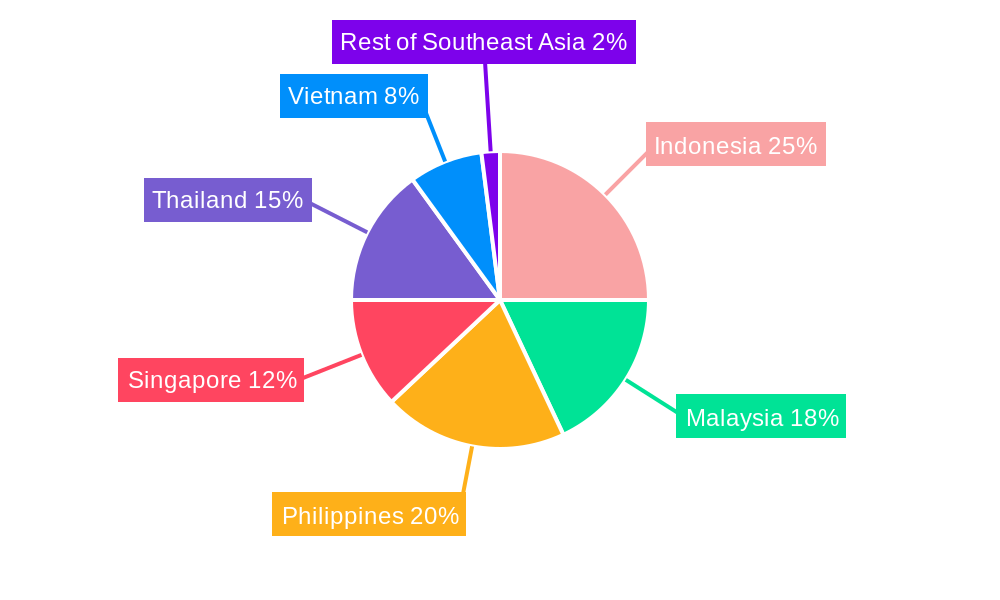
Indonesia, Malaysia, Philippines, Singapore, Thailand, and Vietnam are pivotal markets, each contributing unique culinary traditions and economic dynamics. Intense competition among international and local players fuels continuous innovation in menu development, service models, and technological adoption. While the outlook is positive for the forecast period (2025-2033), navigating fluctuating commodity prices and intense competition remains critical. Strategic decisions should consider regional variations, local culinary influences, and economic conditions to secure a competitive edge. Understanding consumer preferences for health-conscious options and sustainability initiatives will be paramount for sustained success in the evolving Southeast Asian food service landscape.
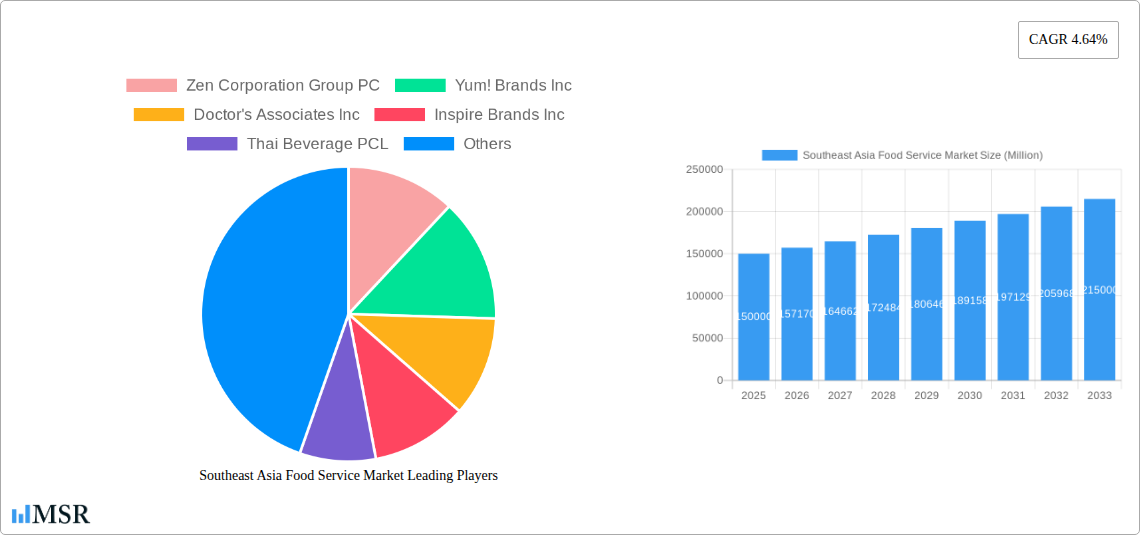
Southeast Asia Food Service Market Company Market Share
Southeast Asia Food Service Market: A Comprehensive Report (2019-2033)
This comprehensive report provides an in-depth analysis of the Southeast Asia food service market, offering invaluable insights for industry stakeholders, investors, and businesses looking to capitalize on this dynamic sector. The study period spans from 2019 to 2033, with a base year of 2025 and a forecast period from 2025 to 2033. The report uses 2024 as the historical period. The market is segmented by outlet type (chained and independent), location (leisure, lodging, retail, standalone, travel), country (Indonesia, Malaysia, Philippines, Singapore, Thailand, Vietnam, and Rest of Southeast Asia), and foodservice type (Cafes & Bars, Other QSR Cuisines). Key players analyzed include Jollibee Foods Corporation, McDonald's Corporation, Starbucks Corporation, and many more. The report projects a market size of xx Million by 2025, with a CAGR of xx% during the forecast period.
Southeast Asia Food Service Market Concentration & Dynamics
The Southeast Asia food service market exhibits a complex interplay of concentration, innovation, and regulatory dynamics. While multinational giants like McDonald's Corporation and Starbucks Corporation hold significant market share, a multitude of smaller, independent outlets and regional players contribute significantly to the overall market volume. Market share varies significantly by country and foodservice type. For example, local QSR chains often dominate specific national markets.
- Market Concentration: The market is moderately concentrated, with a Herfindahl-Hirschman Index (HHI) estimated at xx. The top 5 players command an estimated xx% of the market, while a substantial portion is held by numerous smaller players.
- Innovation Ecosystem: The region witnesses rapid innovation in food technology, delivery platforms, and service models, driven by a young and tech-savvy population. This fosters a dynamic competitive landscape.
- Regulatory Frameworks: Regulations vary across countries, impacting food safety, licensing, and operating costs. Streamlining regulations could foster growth.
- Substitute Products: The market faces competition from grocery stores and home-delivery services, especially for convenience food items.
- End-User Trends: Growing urbanization, rising disposable incomes, and changing lifestyles fuel demand for convenient, diverse, and value-for-money food service offerings.
- M&A Activities: The number of M&A deals in the Southeast Asia food service market has seen a significant increase in recent years, reaching approximately xx deals in 2024. This reflects the consolidation trends and expansion strategies of larger players.
Southeast Asia Food Service Market Industry Insights & Trends
The Southeast Asia food service market is experiencing robust growth, driven by several key factors. The market size reached xx Million in 2024 and is projected to reach xx Million by 2025, exhibiting a significant increase. This expansion is primarily fueled by rising disposable incomes, increasing urbanization, and the growing preference for convenient and diverse food options. Technological disruptions, such as online food delivery platforms and digital payment systems, are further accelerating market expansion. The evolving consumer preferences towards healthier and more sustainable food options are influencing menu innovations and operational strategies. The rising adoption of technology, particularly mobile applications and online ordering systems, is reshaping consumer behavior and market dynamics. Moreover, the changing demographics and lifestyle preferences are also contributing to the growth of the market.
Key Markets & Segments Leading Southeast Asia Food Service Market
The Philippines, Indonesia, and Thailand represent the largest national markets within Southeast Asia's food service sector, driven by population size and economic growth. Chained outlets dominate the market share due to their brand recognition and consistent service standards. Standalone locations, particularly in high-traffic areas, also demonstrate strong performance.
- Country Dominance: The Philippines demonstrates the highest market share, followed by Indonesia and Thailand. This reflects the combined effect of population density, economic growth, and robust consumer spending on food and beverages.
- Outlet Type Dominance: Chained outlets hold a substantial market share, exceeding xx%, while independent outlets still maintain a considerable presence, particularly in smaller towns and cities.
- Location Dominance: Retail locations, including shopping malls and commercial centers, show high market share, followed by standalone and travel locations.
- Foodservice Type Dominance: QSR (Quick Service Restaurants) and cafes hold a significant market share, reflecting consumer demand for quick, convenient, and affordable meal options.
Drivers of Market Growth:
- Economic Growth: Rising disposable incomes across Southeast Asia directly fuel spending on food services.
- Urbanization: Concentration of populations in urban areas increases demand for convenient food options.
- Tourism: Tourism boosts demand, particularly in key tourist destinations.
- Technological Advancements: Online food delivery platforms and digital payment systems expand market access.
Southeast Asia Food Service Market Product Developments
Recent product innovations focus on catering to evolving consumer preferences for healthier, more convenient, and customized food options. This includes the rise of plant-based menus, customized meal options through technology, and the use of delivery and pick-up options. Technology plays a significant role in this innovation, from automated kitchens to sophisticated point-of-sale systems. Companies are also focusing on value-added services like loyalty programs and personalized promotions.
Challenges in the Southeast Asia Food Service Market Market
The Southeast Asia food service market faces several challenges. Supply chain disruptions and rising food costs impact profitability. Intense competition necessitates continuous innovation and efficiency improvements. Varying regulatory standards across countries also complicate expansion. The impact of these challenges on profitability is estimated at a xx% decrease in profit margins for some businesses.
Forces Driving Southeast Asia Food Service Market Growth
Strong economic growth and rising middle classes are primary drivers. Rapid urbanization concentrates demand. Technological advancements, particularly in delivery and online ordering, enhance accessibility. Government initiatives promoting tourism and infrastructure development positively impact the market.
Long-Term Growth Catalysts in Southeast Asia Food Service Market
Long-term growth is fueled by increasing health consciousness, driving demand for healthier options. Strategic partnerships and market expansions into new territories, such as rural areas with emerging middle classes, create lucrative opportunities. Technological integration, including automation and data analytics, will enhance efficiency and customer experience.
Emerging Opportunities in Southeast Asia Food Service Market
Growing demand for personalized and customized dining experiences presents significant opportunities. The rise of ghost kitchens and cloud kitchens expands market reach. Expanding into underserved markets and introducing innovative service models, like subscription services, offer untapped potential. Focus on sustainability and ethically sourced ingredients caters to increasing consumer preferences.
Leading Players in the Southeast Asia Food Service Market Sector
- Jollibee Foods Corporation
- McDonald's Corporation
- Starbucks Corporation
- Zen Corporation Group PC
- Yum! Brands Inc
- Doctor's Associates Inc
- Inspire Brands Inc
- Thai Beverage PCL
- Nando's Group Holdings Limited
- The Wendy's Company
- Secret Recipe Cakes & Café Sdn Bhd
- Tung Lok Restaurants (2000) Ltd
- Domino's Pizza Enterprises Ltd
- Marrybrown Sdn Bhd
- Minor International PCL
- Restaurant Brands International Inc
Key Milestones in Southeast Asia Food Service Market Industry
- May 2023: Starbucks inaugurated a new store in Bird Paradise, Philippines, designed as a rustic wooden hut, showcasing innovative store design.
- May 2023: Inspire Brands, Inc. launched new butter variants (Plain, Choco Almond, Ube Cheese, Strawberry, Cheesy, Choco) for its Butternut portfolio, expanding product offerings.
- October 2023: Starbucks launched two new ice cream-based drinks in the Philippines, responding to local taste preferences and driving product innovation.
Strategic Outlook for Southeast Asia Food Service Market Market
The Southeast Asia food service market presents significant growth potential, driven by favorable demographics, increasing disposable incomes, and technological advancements. Strategic opportunities lie in adopting innovative technologies, expanding into underserved markets, and catering to evolving consumer preferences. Companies that can effectively adapt to these trends and leverage technological advancements are poised for success in this dynamic sector.
Southeast Asia Food Service Market Segmentation
-
1. Foodservice Type
-
1.1. Cafes & Bars
-
1.1.1. By Cuisine
- 1.1.1.1. Bars & Pubs
- 1.1.1.2. Juice/Smoothie/Desserts Bars
- 1.1.1.3. Specialist Coffee & Tea Shops
-
1.1.1. By Cuisine
- 1.2. Cloud Kitchen
-
1.3. Full Service Restaurants
- 1.3.1. Asian
- 1.3.2. European
- 1.3.3. Latin American
- 1.3.4. Middle Eastern
- 1.3.5. North American
- 1.3.6. Other FSR Cuisines
-
1.4. Quick Service Restaurants
- 1.4.1. Bakeries
- 1.4.2. Burger
- 1.4.3. Ice Cream
- 1.4.4. Meat-based Cuisines
- 1.4.5. Pizza
- 1.4.6. Other QSR Cuisines
-
1.1. Cafes & Bars
-
2. Outlet
- 2.1. Chained Outlets
- 2.2. Independent Outlets
-
3. Location
- 3.1. Leisure
- 3.2. Lodging
- 3.3. Retail
- 3.4. Standalone
- 3.5. Travel
Southeast Asia Food Service Market Segmentation By Geography
-
1. North America
- 1.1. United States
- 1.2. Canada
- 1.3. Mexico
-
2. South America
- 2.1. Brazil
- 2.2. Argentina
- 2.3. Rest of South America
-
3. Europe
- 3.1. United Kingdom
- 3.2. Germany
- 3.3. France
- 3.4. Italy
- 3.5. Spain
- 3.6. Russia
- 3.7. Benelux
- 3.8. Nordics
- 3.9. Rest of Europe
-
4. Middle East & Africa
- 4.1. Turkey
- 4.2. Israel
- 4.3. GCC
- 4.4. North Africa
- 4.5. South Africa
- 4.6. Rest of Middle East & Africa
-
5. Asia Pacific
- 5.1. China
- 5.2. India
- 5.3. Japan
- 5.4. South Korea
- 5.5. ASEAN
- 5.6. Oceania
- 5.7. Rest of Asia Pacific
Southeast Asia Food Service Market Regional Market Share
Geographic Coverage of Southeast Asia Food Service Market
Southeast Asia Food Service Market REPORT HIGHLIGHTS
| Aspects | Details |
|---|---|
| Study Period | 2020-2034 |
| Base Year | 2025 |
| Estimated Year | 2026 |
| Forecast Period | 2026-2034 |
| Historical Period | 2020-2025 |
| Growth Rate | CAGR of 13.2% from 2020-2034 |
| Segmentation |
|
Table of Contents
- 1. Introduction
- 1.1. Research Scope
- 1.2. Market Segmentation
- 1.3. Research Methodology
- 1.4. Definitions and Assumptions
- 2. Executive Summary
- 2.1. Introduction
- 3. Market Dynamics
- 3.1. Introduction
- 3.2. Market Drivers
- 3.2.1. Growing Awareness of Functional Benefits of Carotenoids; Consumption of Health and Wellness Products
- 3.3. Market Restrains
- 3.3.1. High Processing Cost and Low Yield of Natural Food Colors
- 3.4. Market Trends
- 3.4.1. OTHER KEY INDUSTRY TRENDS COVERED IN THE REPORT
- 4. Market Factor Analysis
- 4.1. Porters Five Forces
- 4.2. Supply/Value Chain
- 4.3. PESTEL analysis
- 4.4. Market Entropy
- 4.5. Patent/Trademark Analysis
- 5. Global Southeast Asia Food Service Market Analysis, Insights and Forecast, 2020-2032
- 5.1. Market Analysis, Insights and Forecast - by Foodservice Type
- 5.1.1. Cafes & Bars
- 5.1.1.1. By Cuisine
- 5.1.1.1.1. Bars & Pubs
- 5.1.1.1.2. Juice/Smoothie/Desserts Bars
- 5.1.1.1.3. Specialist Coffee & Tea Shops
- 5.1.1.1. By Cuisine
- 5.1.2. Cloud Kitchen
- 5.1.3. Full Service Restaurants
- 5.1.3.1. Asian
- 5.1.3.2. European
- 5.1.3.3. Latin American
- 5.1.3.4. Middle Eastern
- 5.1.3.5. North American
- 5.1.3.6. Other FSR Cuisines
- 5.1.4. Quick Service Restaurants
- 5.1.4.1. Bakeries
- 5.1.4.2. Burger
- 5.1.4.3. Ice Cream
- 5.1.4.4. Meat-based Cuisines
- 5.1.4.5. Pizza
- 5.1.4.6. Other QSR Cuisines
- 5.1.1. Cafes & Bars
- 5.2. Market Analysis, Insights and Forecast - by Outlet
- 5.2.1. Chained Outlets
- 5.2.2. Independent Outlets
- 5.3. Market Analysis, Insights and Forecast - by Location
- 5.3.1. Leisure
- 5.3.2. Lodging
- 5.3.3. Retail
- 5.3.4. Standalone
- 5.3.5. Travel
- 5.4. Market Analysis, Insights and Forecast - by Region
- 5.4.1. North America
- 5.4.2. South America
- 5.4.3. Europe
- 5.4.4. Middle East & Africa
- 5.4.5. Asia Pacific
- 5.1. Market Analysis, Insights and Forecast - by Foodservice Type
- 6. North America Southeast Asia Food Service Market Analysis, Insights and Forecast, 2020-2032
- 6.1. Market Analysis, Insights and Forecast - by Foodservice Type
- 6.1.1. Cafes & Bars
- 6.1.1.1. By Cuisine
- 6.1.1.1.1. Bars & Pubs
- 6.1.1.1.2. Juice/Smoothie/Desserts Bars
- 6.1.1.1.3. Specialist Coffee & Tea Shops
- 6.1.1.1. By Cuisine
- 6.1.2. Cloud Kitchen
- 6.1.3. Full Service Restaurants
- 6.1.3.1. Asian
- 6.1.3.2. European
- 6.1.3.3. Latin American
- 6.1.3.4. Middle Eastern
- 6.1.3.5. North American
- 6.1.3.6. Other FSR Cuisines
- 6.1.4. Quick Service Restaurants
- 6.1.4.1. Bakeries
- 6.1.4.2. Burger
- 6.1.4.3. Ice Cream
- 6.1.4.4. Meat-based Cuisines
- 6.1.4.5. Pizza
- 6.1.4.6. Other QSR Cuisines
- 6.1.1. Cafes & Bars
- 6.2. Market Analysis, Insights and Forecast - by Outlet
- 6.2.1. Chained Outlets
- 6.2.2. Independent Outlets
- 6.3. Market Analysis, Insights and Forecast - by Location
- 6.3.1. Leisure
- 6.3.2. Lodging
- 6.3.3. Retail
- 6.3.4. Standalone
- 6.3.5. Travel
- 6.1. Market Analysis, Insights and Forecast - by Foodservice Type
- 7. South America Southeast Asia Food Service Market Analysis, Insights and Forecast, 2020-2032
- 7.1. Market Analysis, Insights and Forecast - by Foodservice Type
- 7.1.1. Cafes & Bars
- 7.1.1.1. By Cuisine
- 7.1.1.1.1. Bars & Pubs
- 7.1.1.1.2. Juice/Smoothie/Desserts Bars
- 7.1.1.1.3. Specialist Coffee & Tea Shops
- 7.1.1.1. By Cuisine
- 7.1.2. Cloud Kitchen
- 7.1.3. Full Service Restaurants
- 7.1.3.1. Asian
- 7.1.3.2. European
- 7.1.3.3. Latin American
- 7.1.3.4. Middle Eastern
- 7.1.3.5. North American
- 7.1.3.6. Other FSR Cuisines
- 7.1.4. Quick Service Restaurants
- 7.1.4.1. Bakeries
- 7.1.4.2. Burger
- 7.1.4.3. Ice Cream
- 7.1.4.4. Meat-based Cuisines
- 7.1.4.5. Pizza
- 7.1.4.6. Other QSR Cuisines
- 7.1.1. Cafes & Bars
- 7.2. Market Analysis, Insights and Forecast - by Outlet
- 7.2.1. Chained Outlets
- 7.2.2. Independent Outlets
- 7.3. Market Analysis, Insights and Forecast - by Location
- 7.3.1. Leisure
- 7.3.2. Lodging
- 7.3.3. Retail
- 7.3.4. Standalone
- 7.3.5. Travel
- 7.1. Market Analysis, Insights and Forecast - by Foodservice Type
- 8. Europe Southeast Asia Food Service Market Analysis, Insights and Forecast, 2020-2032
- 8.1. Market Analysis, Insights and Forecast - by Foodservice Type
- 8.1.1. Cafes & Bars
- 8.1.1.1. By Cuisine
- 8.1.1.1.1. Bars & Pubs
- 8.1.1.1.2. Juice/Smoothie/Desserts Bars
- 8.1.1.1.3. Specialist Coffee & Tea Shops
- 8.1.1.1. By Cuisine
- 8.1.2. Cloud Kitchen
- 8.1.3. Full Service Restaurants
- 8.1.3.1. Asian
- 8.1.3.2. European
- 8.1.3.3. Latin American
- 8.1.3.4. Middle Eastern
- 8.1.3.5. North American
- 8.1.3.6. Other FSR Cuisines
- 8.1.4. Quick Service Restaurants
- 8.1.4.1. Bakeries
- 8.1.4.2. Burger
- 8.1.4.3. Ice Cream
- 8.1.4.4. Meat-based Cuisines
- 8.1.4.5. Pizza
- 8.1.4.6. Other QSR Cuisines
- 8.1.1. Cafes & Bars
- 8.2. Market Analysis, Insights and Forecast - by Outlet
- 8.2.1. Chained Outlets
- 8.2.2. Independent Outlets
- 8.3. Market Analysis, Insights and Forecast - by Location
- 8.3.1. Leisure
- 8.3.2. Lodging
- 8.3.3. Retail
- 8.3.4. Standalone
- 8.3.5. Travel
- 8.1. Market Analysis, Insights and Forecast - by Foodservice Type
- 9. Middle East & Africa Southeast Asia Food Service Market Analysis, Insights and Forecast, 2020-2032
- 9.1. Market Analysis, Insights and Forecast - by Foodservice Type
- 9.1.1. Cafes & Bars
- 9.1.1.1. By Cuisine
- 9.1.1.1.1. Bars & Pubs
- 9.1.1.1.2. Juice/Smoothie/Desserts Bars
- 9.1.1.1.3. Specialist Coffee & Tea Shops
- 9.1.1.1. By Cuisine
- 9.1.2. Cloud Kitchen
- 9.1.3. Full Service Restaurants
- 9.1.3.1. Asian
- 9.1.3.2. European
- 9.1.3.3. Latin American
- 9.1.3.4. Middle Eastern
- 9.1.3.5. North American
- 9.1.3.6. Other FSR Cuisines
- 9.1.4. Quick Service Restaurants
- 9.1.4.1. Bakeries
- 9.1.4.2. Burger
- 9.1.4.3. Ice Cream
- 9.1.4.4. Meat-based Cuisines
- 9.1.4.5. Pizza
- 9.1.4.6. Other QSR Cuisines
- 9.1.1. Cafes & Bars
- 9.2. Market Analysis, Insights and Forecast - by Outlet
- 9.2.1. Chained Outlets
- 9.2.2. Independent Outlets
- 9.3. Market Analysis, Insights and Forecast - by Location
- 9.3.1. Leisure
- 9.3.2. Lodging
- 9.3.3. Retail
- 9.3.4. Standalone
- 9.3.5. Travel
- 9.1. Market Analysis, Insights and Forecast - by Foodservice Type
- 10. Asia Pacific Southeast Asia Food Service Market Analysis, Insights and Forecast, 2020-2032
- 10.1. Market Analysis, Insights and Forecast - by Foodservice Type
- 10.1.1. Cafes & Bars
- 10.1.1.1. By Cuisine
- 10.1.1.1.1. Bars & Pubs
- 10.1.1.1.2. Juice/Smoothie/Desserts Bars
- 10.1.1.1.3. Specialist Coffee & Tea Shops
- 10.1.1.1. By Cuisine
- 10.1.2. Cloud Kitchen
- 10.1.3. Full Service Restaurants
- 10.1.3.1. Asian
- 10.1.3.2. European
- 10.1.3.3. Latin American
- 10.1.3.4. Middle Eastern
- 10.1.3.5. North American
- 10.1.3.6. Other FSR Cuisines
- 10.1.4. Quick Service Restaurants
- 10.1.4.1. Bakeries
- 10.1.4.2. Burger
- 10.1.4.3. Ice Cream
- 10.1.4.4. Meat-based Cuisines
- 10.1.4.5. Pizza
- 10.1.4.6. Other QSR Cuisines
- 10.1.1. Cafes & Bars
- 10.2. Market Analysis, Insights and Forecast - by Outlet
- 10.2.1. Chained Outlets
- 10.2.2. Independent Outlets
- 10.3. Market Analysis, Insights and Forecast - by Location
- 10.3.1. Leisure
- 10.3.2. Lodging
- 10.3.3. Retail
- 10.3.4. Standalone
- 10.3.5. Travel
- 10.1. Market Analysis, Insights and Forecast - by Foodservice Type
- 11. Competitive Analysis
- 11.1. Global Market Share Analysis 2025
- 11.2. Company Profiles
- 11.2.1 Zen Corporation Group PC
- 11.2.1.1. Overview
- 11.2.1.2. Products
- 11.2.1.3. SWOT Analysis
- 11.2.1.4. Recent Developments
- 11.2.1.5. Financials (Based on Availability)
- 11.2.2 Yum! Brands Inc
- 11.2.2.1. Overview
- 11.2.2.2. Products
- 11.2.2.3. SWOT Analysis
- 11.2.2.4. Recent Developments
- 11.2.2.5. Financials (Based on Availability)
- 11.2.3 Doctor's Associates Inc
- 11.2.3.1. Overview
- 11.2.3.2. Products
- 11.2.3.3. SWOT Analysis
- 11.2.3.4. Recent Developments
- 11.2.3.5. Financials (Based on Availability)
- 11.2.4 Inspire Brands Inc
- 11.2.4.1. Overview
- 11.2.4.2. Products
- 11.2.4.3. SWOT Analysis
- 11.2.4.4. Recent Developments
- 11.2.4.5. Financials (Based on Availability)
- 11.2.5 Thai Beverage PCL
- 11.2.5.1. Overview
- 11.2.5.2. Products
- 11.2.5.3. SWOT Analysis
- 11.2.5.4. Recent Developments
- 11.2.5.5. Financials (Based on Availability)
- 11.2.6 Nando's Group Holdings Limited
- 11.2.6.1. Overview
- 11.2.6.2. Products
- 11.2.6.3. SWOT Analysis
- 11.2.6.4. Recent Developments
- 11.2.6.5. Financials (Based on Availability)
- 11.2.7 Jollibee Foods Corporation
- 11.2.7.1. Overview
- 11.2.7.2. Products
- 11.2.7.3. SWOT Analysis
- 11.2.7.4. Recent Developments
- 11.2.7.5. Financials (Based on Availability)
- 11.2.8 The Wendy's Company
- 11.2.8.1. Overview
- 11.2.8.2. Products
- 11.2.8.3. SWOT Analysis
- 11.2.8.4. Recent Developments
- 11.2.8.5. Financials (Based on Availability)
- 11.2.9 Secret Recipe Cakes & Café Sdn Bhd
- 11.2.9.1. Overview
- 11.2.9.2. Products
- 11.2.9.3. SWOT Analysis
- 11.2.9.4. Recent Developments
- 11.2.9.5. Financials (Based on Availability)
- 11.2.10 Tung Lok Restaurants (2000) Ltd
- 11.2.10.1. Overview
- 11.2.10.2. Products
- 11.2.10.3. SWOT Analysis
- 11.2.10.4. Recent Developments
- 11.2.10.5. Financials (Based on Availability)
- 11.2.11 Domino's Pizza Enterprises Ltd
- 11.2.11.1. Overview
- 11.2.11.2. Products
- 11.2.11.3. SWOT Analysis
- 11.2.11.4. Recent Developments
- 11.2.11.5. Financials (Based on Availability)
- 11.2.12 Starbucks Corporation
- 11.2.12.1. Overview
- 11.2.12.2. Products
- 11.2.12.3. SWOT Analysis
- 11.2.12.4. Recent Developments
- 11.2.12.5. Financials (Based on Availability)
- 11.2.13 Marrybrown Sdn Bhd
- 11.2.13.1. Overview
- 11.2.13.2. Products
- 11.2.13.3. SWOT Analysis
- 11.2.13.4. Recent Developments
- 11.2.13.5. Financials (Based on Availability)
- 11.2.14 Minor International PCL
- 11.2.14.1. Overview
- 11.2.14.2. Products
- 11.2.14.3. SWOT Analysis
- 11.2.14.4. Recent Developments
- 11.2.14.5. Financials (Based on Availability)
- 11.2.15 Restaurant Brands International Inc
- 11.2.15.1. Overview
- 11.2.15.2. Products
- 11.2.15.3. SWOT Analysis
- 11.2.15.4. Recent Developments
- 11.2.15.5. Financials (Based on Availability)
- 11.2.16 McDonald's Corporation
- 11.2.16.1. Overview
- 11.2.16.2. Products
- 11.2.16.3. SWOT Analysis
- 11.2.16.4. Recent Developments
- 11.2.16.5. Financials (Based on Availability)
- 11.2.1 Zen Corporation Group PC
List of Figures
- Figure 1: Global Southeast Asia Food Service Market Revenue Breakdown (billion, %) by Region 2025 & 2033
- Figure 2: North America Southeast Asia Food Service Market Revenue (billion), by Foodservice Type 2025 & 2033
- Figure 3: North America Southeast Asia Food Service Market Revenue Share (%), by Foodservice Type 2025 & 2033
- Figure 4: North America Southeast Asia Food Service Market Revenue (billion), by Outlet 2025 & 2033
- Figure 5: North America Southeast Asia Food Service Market Revenue Share (%), by Outlet 2025 & 2033
- Figure 6: North America Southeast Asia Food Service Market Revenue (billion), by Location 2025 & 2033
- Figure 7: North America Southeast Asia Food Service Market Revenue Share (%), by Location 2025 & 2033
- Figure 8: North America Southeast Asia Food Service Market Revenue (billion), by Country 2025 & 2033
- Figure 9: North America Southeast Asia Food Service Market Revenue Share (%), by Country 2025 & 2033
- Figure 10: South America Southeast Asia Food Service Market Revenue (billion), by Foodservice Type 2025 & 2033
- Figure 11: South America Southeast Asia Food Service Market Revenue Share (%), by Foodservice Type 2025 & 2033
- Figure 12: South America Southeast Asia Food Service Market Revenue (billion), by Outlet 2025 & 2033
- Figure 13: South America Southeast Asia Food Service Market Revenue Share (%), by Outlet 2025 & 2033
- Figure 14: South America Southeast Asia Food Service Market Revenue (billion), by Location 2025 & 2033
- Figure 15: South America Southeast Asia Food Service Market Revenue Share (%), by Location 2025 & 2033
- Figure 16: South America Southeast Asia Food Service Market Revenue (billion), by Country 2025 & 2033
- Figure 17: South America Southeast Asia Food Service Market Revenue Share (%), by Country 2025 & 2033
- Figure 18: Europe Southeast Asia Food Service Market Revenue (billion), by Foodservice Type 2025 & 2033
- Figure 19: Europe Southeast Asia Food Service Market Revenue Share (%), by Foodservice Type 2025 & 2033
- Figure 20: Europe Southeast Asia Food Service Market Revenue (billion), by Outlet 2025 & 2033
- Figure 21: Europe Southeast Asia Food Service Market Revenue Share (%), by Outlet 2025 & 2033
- Figure 22: Europe Southeast Asia Food Service Market Revenue (billion), by Location 2025 & 2033
- Figure 23: Europe Southeast Asia Food Service Market Revenue Share (%), by Location 2025 & 2033
- Figure 24: Europe Southeast Asia Food Service Market Revenue (billion), by Country 2025 & 2033
- Figure 25: Europe Southeast Asia Food Service Market Revenue Share (%), by Country 2025 & 2033
- Figure 26: Middle East & Africa Southeast Asia Food Service Market Revenue (billion), by Foodservice Type 2025 & 2033
- Figure 27: Middle East & Africa Southeast Asia Food Service Market Revenue Share (%), by Foodservice Type 2025 & 2033
- Figure 28: Middle East & Africa Southeast Asia Food Service Market Revenue (billion), by Outlet 2025 & 2033
- Figure 29: Middle East & Africa Southeast Asia Food Service Market Revenue Share (%), by Outlet 2025 & 2033
- Figure 30: Middle East & Africa Southeast Asia Food Service Market Revenue (billion), by Location 2025 & 2033
- Figure 31: Middle East & Africa Southeast Asia Food Service Market Revenue Share (%), by Location 2025 & 2033
- Figure 32: Middle East & Africa Southeast Asia Food Service Market Revenue (billion), by Country 2025 & 2033
- Figure 33: Middle East & Africa Southeast Asia Food Service Market Revenue Share (%), by Country 2025 & 2033
- Figure 34: Asia Pacific Southeast Asia Food Service Market Revenue (billion), by Foodservice Type 2025 & 2033
- Figure 35: Asia Pacific Southeast Asia Food Service Market Revenue Share (%), by Foodservice Type 2025 & 2033
- Figure 36: Asia Pacific Southeast Asia Food Service Market Revenue (billion), by Outlet 2025 & 2033
- Figure 37: Asia Pacific Southeast Asia Food Service Market Revenue Share (%), by Outlet 2025 & 2033
- Figure 38: Asia Pacific Southeast Asia Food Service Market Revenue (billion), by Location 2025 & 2033
- Figure 39: Asia Pacific Southeast Asia Food Service Market Revenue Share (%), by Location 2025 & 2033
- Figure 40: Asia Pacific Southeast Asia Food Service Market Revenue (billion), by Country 2025 & 2033
- Figure 41: Asia Pacific Southeast Asia Food Service Market Revenue Share (%), by Country 2025 & 2033
List of Tables
- Table 1: Global Southeast Asia Food Service Market Revenue billion Forecast, by Foodservice Type 2020 & 2033
- Table 2: Global Southeast Asia Food Service Market Revenue billion Forecast, by Outlet 2020 & 2033
- Table 3: Global Southeast Asia Food Service Market Revenue billion Forecast, by Location 2020 & 2033
- Table 4: Global Southeast Asia Food Service Market Revenue billion Forecast, by Region 2020 & 2033
- Table 5: Global Southeast Asia Food Service Market Revenue billion Forecast, by Foodservice Type 2020 & 2033
- Table 6: Global Southeast Asia Food Service Market Revenue billion Forecast, by Outlet 2020 & 2033
- Table 7: Global Southeast Asia Food Service Market Revenue billion Forecast, by Location 2020 & 2033
- Table 8: Global Southeast Asia Food Service Market Revenue billion Forecast, by Country 2020 & 2033
- Table 9: United States Southeast Asia Food Service Market Revenue (billion) Forecast, by Application 2020 & 2033
- Table 10: Canada Southeast Asia Food Service Market Revenue (billion) Forecast, by Application 2020 & 2033
- Table 11: Mexico Southeast Asia Food Service Market Revenue (billion) Forecast, by Application 2020 & 2033
- Table 12: Global Southeast Asia Food Service Market Revenue billion Forecast, by Foodservice Type 2020 & 2033
- Table 13: Global Southeast Asia Food Service Market Revenue billion Forecast, by Outlet 2020 & 2033
- Table 14: Global Southeast Asia Food Service Market Revenue billion Forecast, by Location 2020 & 2033
- Table 15: Global Southeast Asia Food Service Market Revenue billion Forecast, by Country 2020 & 2033
- Table 16: Brazil Southeast Asia Food Service Market Revenue (billion) Forecast, by Application 2020 & 2033
- Table 17: Argentina Southeast Asia Food Service Market Revenue (billion) Forecast, by Application 2020 & 2033
- Table 18: Rest of South America Southeast Asia Food Service Market Revenue (billion) Forecast, by Application 2020 & 2033
- Table 19: Global Southeast Asia Food Service Market Revenue billion Forecast, by Foodservice Type 2020 & 2033
- Table 20: Global Southeast Asia Food Service Market Revenue billion Forecast, by Outlet 2020 & 2033
- Table 21: Global Southeast Asia Food Service Market Revenue billion Forecast, by Location 2020 & 2033
- Table 22: Global Southeast Asia Food Service Market Revenue billion Forecast, by Country 2020 & 2033
- Table 23: United Kingdom Southeast Asia Food Service Market Revenue (billion) Forecast, by Application 2020 & 2033
- Table 24: Germany Southeast Asia Food Service Market Revenue (billion) Forecast, by Application 2020 & 2033
- Table 25: France Southeast Asia Food Service Market Revenue (billion) Forecast, by Application 2020 & 2033
- Table 26: Italy Southeast Asia Food Service Market Revenue (billion) Forecast, by Application 2020 & 2033
- Table 27: Spain Southeast Asia Food Service Market Revenue (billion) Forecast, by Application 2020 & 2033
- Table 28: Russia Southeast Asia Food Service Market Revenue (billion) Forecast, by Application 2020 & 2033
- Table 29: Benelux Southeast Asia Food Service Market Revenue (billion) Forecast, by Application 2020 & 2033
- Table 30: Nordics Southeast Asia Food Service Market Revenue (billion) Forecast, by Application 2020 & 2033
- Table 31: Rest of Europe Southeast Asia Food Service Market Revenue (billion) Forecast, by Application 2020 & 2033
- Table 32: Global Southeast Asia Food Service Market Revenue billion Forecast, by Foodservice Type 2020 & 2033
- Table 33: Global Southeast Asia Food Service Market Revenue billion Forecast, by Outlet 2020 & 2033
- Table 34: Global Southeast Asia Food Service Market Revenue billion Forecast, by Location 2020 & 2033
- Table 35: Global Southeast Asia Food Service Market Revenue billion Forecast, by Country 2020 & 2033
- Table 36: Turkey Southeast Asia Food Service Market Revenue (billion) Forecast, by Application 2020 & 2033
- Table 37: Israel Southeast Asia Food Service Market Revenue (billion) Forecast, by Application 2020 & 2033
- Table 38: GCC Southeast Asia Food Service Market Revenue (billion) Forecast, by Application 2020 & 2033
- Table 39: North Africa Southeast Asia Food Service Market Revenue (billion) Forecast, by Application 2020 & 2033
- Table 40: South Africa Southeast Asia Food Service Market Revenue (billion) Forecast, by Application 2020 & 2033
- Table 41: Rest of Middle East & Africa Southeast Asia Food Service Market Revenue (billion) Forecast, by Application 2020 & 2033
- Table 42: Global Southeast Asia Food Service Market Revenue billion Forecast, by Foodservice Type 2020 & 2033
- Table 43: Global Southeast Asia Food Service Market Revenue billion Forecast, by Outlet 2020 & 2033
- Table 44: Global Southeast Asia Food Service Market Revenue billion Forecast, by Location 2020 & 2033
- Table 45: Global Southeast Asia Food Service Market Revenue billion Forecast, by Country 2020 & 2033
- Table 46: China Southeast Asia Food Service Market Revenue (billion) Forecast, by Application 2020 & 2033
- Table 47: India Southeast Asia Food Service Market Revenue (billion) Forecast, by Application 2020 & 2033
- Table 48: Japan Southeast Asia Food Service Market Revenue (billion) Forecast, by Application 2020 & 2033
- Table 49: South Korea Southeast Asia Food Service Market Revenue (billion) Forecast, by Application 2020 & 2033
- Table 50: ASEAN Southeast Asia Food Service Market Revenue (billion) Forecast, by Application 2020 & 2033
- Table 51: Oceania Southeast Asia Food Service Market Revenue (billion) Forecast, by Application 2020 & 2033
- Table 52: Rest of Asia Pacific Southeast Asia Food Service Market Revenue (billion) Forecast, by Application 2020 & 2033
Frequently Asked Questions
1. What is the projected Compound Annual Growth Rate (CAGR) of the Southeast Asia Food Service Market?
The projected CAGR is approximately 13.2%.
2. Which companies are prominent players in the Southeast Asia Food Service Market?
Key companies in the market include Zen Corporation Group PC, Yum! Brands Inc, Doctor's Associates Inc, Inspire Brands Inc, Thai Beverage PCL, Nando's Group Holdings Limited, Jollibee Foods Corporation, The Wendy's Company, Secret Recipe Cakes & Café Sdn Bhd, Tung Lok Restaurants (2000) Ltd, Domino's Pizza Enterprises Ltd, Starbucks Corporation, Marrybrown Sdn Bhd, Minor International PCL, Restaurant Brands International Inc, McDonald's Corporation.
3. What are the main segments of the Southeast Asia Food Service Market?
The market segments include Foodservice Type, Outlet, Location.
4. Can you provide details about the market size?
The market size is estimated to be USD 223.8 billion as of 2022.
5. What are some drivers contributing to market growth?
Growing Awareness of Functional Benefits of Carotenoids; Consumption of Health and Wellness Products.
6. What are the notable trends driving market growth?
OTHER KEY INDUSTRY TRENDS COVERED IN THE REPORT.
7. Are there any restraints impacting market growth?
High Processing Cost and Low Yield of Natural Food Colors.
8. Can you provide examples of recent developments in the market?
October 2023: Starbucks launched two new drinks with the addition of ice cream in the Philippines.May 2023: Starbucks inaugurated the latest rustic finish store in Bird Paradise, and the structure of the store is designed like a wooden hut.May 2023: Inspire Brands, Inc. launched new butter variants to its Butternut portfolio. These variants include the Plain Butternut, Choco Almond Butternut, Ube Cheese Butternut, Strawberry Butternut, Cheesy Butternut, and Choco Butternut.
9. What pricing options are available for accessing the report?
Pricing options include single-user, multi-user, and enterprise licenses priced at USD 3800, USD 4500, and USD 5800 respectively.
10. Is the market size provided in terms of value or volume?
The market size is provided in terms of value, measured in billion.
11. Are there any specific market keywords associated with the report?
Yes, the market keyword associated with the report is "Southeast Asia Food Service Market," which aids in identifying and referencing the specific market segment covered.
12. How do I determine which pricing option suits my needs best?
The pricing options vary based on user requirements and access needs. Individual users may opt for single-user licenses, while businesses requiring broader access may choose multi-user or enterprise licenses for cost-effective access to the report.
13. Are there any additional resources or data provided in the Southeast Asia Food Service Market report?
While the report offers comprehensive insights, it's advisable to review the specific contents or supplementary materials provided to ascertain if additional resources or data are available.
14. How can I stay updated on further developments or reports in the Southeast Asia Food Service Market?
To stay informed about further developments, trends, and reports in the Southeast Asia Food Service Market, consider subscribing to industry newsletters, following relevant companies and organizations, or regularly checking reputable industry news sources and publications.
Methodology
Step 1 - Identification of Relevant Samples Size from Population Database


Step 2 - Approaches for Defining Global Market Size (Value, Volume* & Price*)

Note*: In applicable scenarios
Step 3 - Data Sources
Primary Research
- Web Analytics
- Survey Reports
- Research Institute
- Latest Research Reports
- Opinion Leaders
Secondary Research
- Annual Reports
- White Paper
- Latest Press Release
- Industry Association
- Paid Database
- Investor Presentations

Step 4 - Data Triangulation
Involves using different sources of information in order to increase the validity of a study
These sources are likely to be stakeholders in a program - participants, other researchers, program staff, other community members, and so on.
Then we put all data in single framework & apply various statistical tools to find out the dynamic on the market.
During the analysis stage, feedback from the stakeholder groups would be compared to determine areas of agreement as well as areas of divergence