

Key Insights
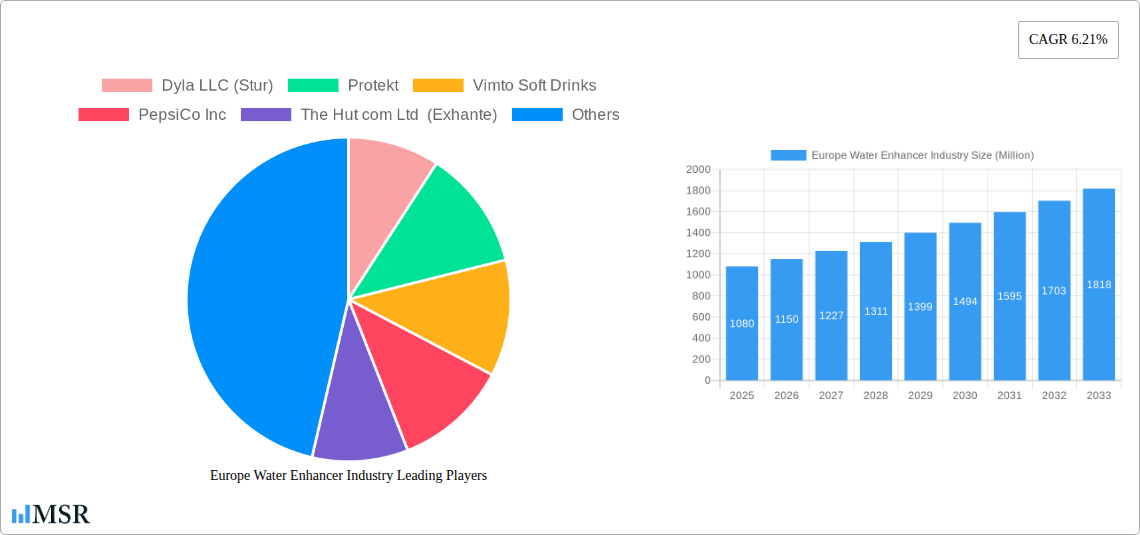
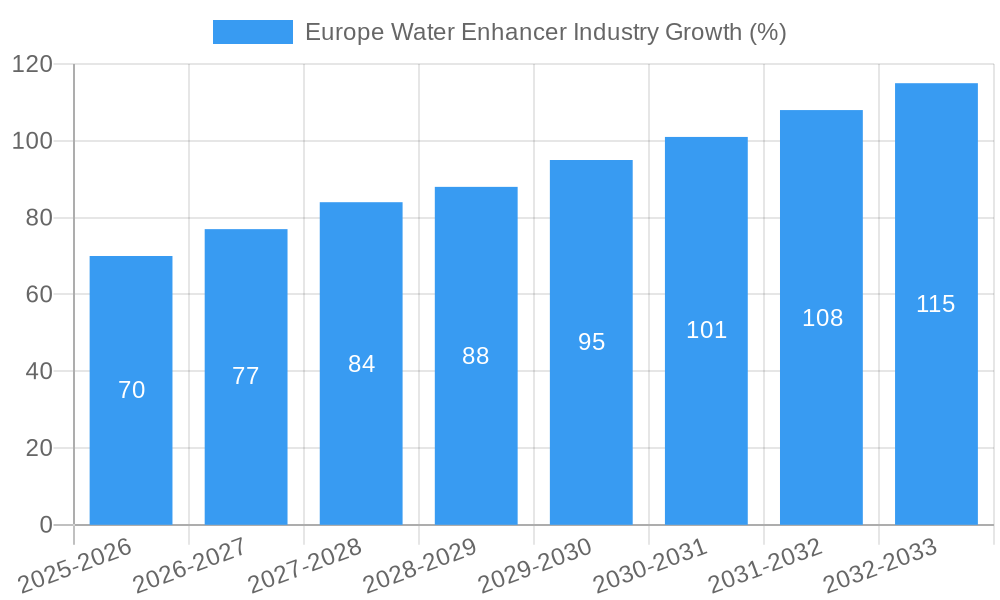
The European water enhancer market, valued at €1.08 billion in 2025, is projected to experience robust growth, driven by increasing health consciousness among consumers and a preference for healthier beverage options. The market's Compound Annual Growth Rate (CAGR) of 6.21% from 2025 to 2033 indicates significant expansion opportunities. Key drivers include the rising prevalence of obesity and related health concerns, prompting consumers to seek low-calorie alternatives to sugary drinks. Furthermore, the growing popularity of personalized hydration and the increasing availability of water enhancers in diverse flavors and functional formulations contribute to market expansion. The convenience of water enhancers, offering a simple and effective way to add flavor and nutrients to water, aligns well with modern lifestyles. While precise figures for segment breakdown are unavailable, we can infer that supermarkets/hypermarkets and online retail stores are likely the dominant distribution channels, given the rise of e-commerce and the established presence of water enhancers in major retail outlets. Germany, the UK, France, and Italy are expected to be the largest national markets, reflecting higher consumer spending power and greater health awareness in these regions. Competitive intensity is moderate, with established players like PepsiCo and Coca-Cola competing alongside smaller, specialized brands focusing on natural and organic ingredients. The market's growth may be tempered by fluctuating raw material prices and potential consumer concerns about artificial sweeteners or additives. However, the overall outlook remains positive, driven by strong consumer demand for healthier, more flavorful hydration options.
The forecast period (2025-2033) will see continued growth fueled by innovation in flavor profiles, functional ingredients (e.g., vitamins, electrolytes), and sustainable packaging. Emerging trends suggest a focus on natural and organic ingredients, as well as the incorporation of functional benefits beyond simple flavor enhancement. Companies are likely to invest in marketing and product diversification to capture consumer attention and cater to specific dietary needs and preferences. The expansion of e-commerce channels will further facilitate market accessibility and growth, particularly in regions with strong online retail penetration. Successful players will need to effectively address consumer concerns about ingredients and sustainability while maintaining competitive pricing strategies.
Europe Water Enhancer Industry Market Report: 2019-2033
This comprehensive report provides a detailed analysis of the Europe water enhancer industry, covering market size, growth drivers, key players, and future trends. With a study period spanning 2019-2033, a base year of 2025, and a forecast period of 2025-2033, this report offers invaluable insights for industry stakeholders, investors, and businesses seeking to navigate this dynamic market. The report is meticulously structured to deliver actionable intelligence, incorporating key market indicators and data points. The total market size in 2025 is estimated at €XX Million.
Europe Water Enhancer Industry Market Concentration & Dynamics
The Europe water enhancer market exhibits a moderately concentrated landscape, with a few major players holding significant market share. However, the presence of numerous smaller, specialized players fosters a competitive and innovative environment. The market share held by the top 5 players is estimated to be xx%. Mergers and acquisitions (M&A) activity has been moderate in recent years, with an estimated xx M&A deals concluded between 2019 and 2024.
- Market Concentration: Top 5 players hold approximately xx% of the market share.
- Innovation Ecosystems: Active development of novel flavors, functional benefits (e.g., vitamins, antioxidants), and sustainable packaging solutions.
- Regulatory Frameworks: EU regulations on food additives and labeling significantly influence product development and marketing strategies.
- Substitute Products: Other beverages (e.g., juices, sports drinks, ready-to-drink teas) pose a competitive threat.
- End-User Trends: Growing health consciousness, preference for natural ingredients, and increasing demand for convenient hydration solutions drive market growth.
- M&A Activity: A moderate level of consolidation, with xx M&A deals in the period 2019-2024, indicating potential for further market concentration.
Europe Water Enhancer Industry Industry Insights & Trends
The European water enhancer market is experiencing robust growth, driven by increasing health awareness, shifting consumer preferences towards healthier beverages, and the rising popularity of customized hydration. The market size was valued at €XX Million in 2024 and is projected to reach €XX Million by 2033, exhibiting a CAGR of xx% during the forecast period (2025-2033). Technological disruptions, such as the introduction of innovative flavor delivery systems and sustainable packaging options, are shaping market dynamics. Changing consumer behaviors, including a greater demand for natural and functional ingredients, further fuel market expansion. The surge in online retail channels and the increasing penetration of e-commerce platforms also play a pivotal role.
Key Markets & Segments Leading Europe Water Enhancer Industry
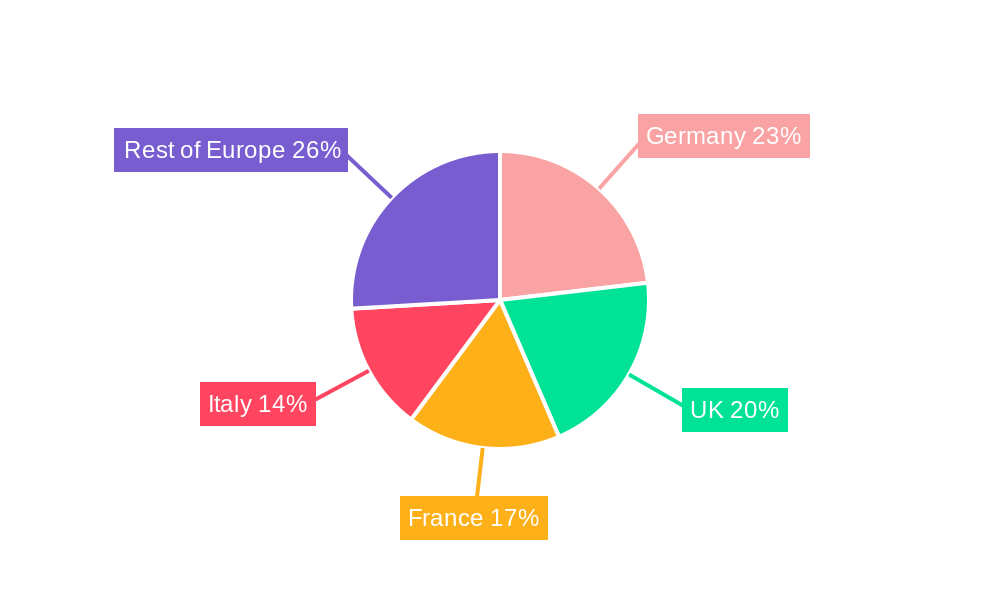
The United Kingdom and Germany represent the largest national markets within Europe for water enhancers, driven by robust consumer demand and established distribution networks. The supermarkets/hypermarkets segment dominates the distribution channel landscape, owing to its extensive reach and established presence across Europe.
By Country:
- United Kingdom: High per capita consumption, strong retail infrastructure.
- Germany: Large population base, growing health consciousness.
- France, Spain, Italy: Significant markets with potential for future growth.
- Russia and Rest of Europe: Emerging markets with varying growth trajectories.
By Distribution Channel:
- Supermarkets/Hypermarkets: Largest market share due to wide reach and established presence.
- Convenience Stores: Growing segment due to increasing consumer preference for on-the-go solutions.
- Online Retail Stores: Rapidly expanding segment fueled by increasing e-commerce penetration.
- Pharmacy & Health Stores: Significant segment for functional and health-focused water enhancers.
Europe Water Enhancer Industry Product Developments
Recent years have witnessed significant product innovation in the European water enhancer market. Companies are focusing on introducing new flavors, functional benefits (e.g., vitamins, antioxidants), and sustainable packaging. The launch of Robinsons Benefit Drops by Britvic, DreamPak's Enhanca Hydrate, and Protekt's liquid supplements showcases this trend. These developments cater to the growing demand for healthier and more convenient beverage options.
Challenges in the Europe Water Enhancer Industry Market
The Europe water enhancer industry faces challenges such as intense competition, fluctuating raw material prices, and evolving consumer preferences. Strict regulatory requirements regarding labeling and food additives also pose a challenge for manufacturers. Supply chain disruptions, particularly in sourcing natural ingredients, can impact production and pricing. These factors can create significant price volatility and impact market growth.
Forces Driving Europe Water Enhancer Industry Growth
Key growth drivers include increasing health consciousness among consumers, growing preference for natural and functional ingredients, and the rising demand for convenient hydration solutions. Technological advancements in flavor delivery systems and sustainable packaging are also contributing to market expansion. Favorable economic conditions in certain European countries are further boosting demand.
Long-Term Growth Catalysts in Europe Water Enhancer Industry
Long-term growth in the European water enhancer market will be fueled by ongoing product innovation, strategic partnerships between established brands and emerging players, and market expansion into new geographical regions. The development of novel functional water enhancers with targeted health benefits will further drive growth.
Emerging Opportunities in Europe Water Enhancer Industry
Emerging opportunities include the development of personalized water enhancers catering to specific dietary needs and preferences. The rise of subscription-based models for regular delivery offers further potential. Expanding into untapped markets within Europe and exploring new flavor profiles and functional benefits will create growth opportunities.
Leading Players in the Europe Water Enhancer Industry Sector
- Dyla LLC (Stur)
- Protekt
- Vimto Soft Drinks
- PepsiCo Inc
- The Hut com Ltd (Exhante)
- The Kraft Heinz Company
- The Coca-Cola Company
- Pure Flavour GmbH
- DreamPak
- Wisdom Natural Brands
Key Milestones in Europe Water Enhancer Industry Industry
- 2022: Robinsons launches new Benefit Drops with added functional benefits.
- 2022: DreamPak launches Enhanca Hydrate water flavor enhancers in various flavors.
- 2022: Protekt launches liquid supplements and beverage enhancers with high-impact antioxidants.
Strategic Outlook for Europe Water Enhancer Industry Market
The European water enhancer market presents significant growth potential driven by evolving consumer preferences, innovation in product development, and expanding distribution channels. Strategic partnerships, focusing on product diversification and geographical expansion, will be crucial for companies seeking to capture significant market share. The focus on sustainability and health-conscious formulations will be critical for long-term success.
Europe Water Enhancer Industry Segmentation
-
1. Distribution Channel
- 1.1. Supermarkets/Hypermarkets
- 1.2. Convenience Stores
- 1.3. Online Retail Stores
- 1.4. Pharmacy & Health Store
- 1.5. Other Distribution Channels
Europe Water Enhancer Industry Segmentation By Geography
-
1. Europe
- 1.1. United Kingdom
- 1.2. Germany
- 1.3. France
- 1.4. Italy
- 1.5. Spain
- 1.6. Netherlands
- 1.7. Belgium
- 1.8. Sweden
- 1.9. Norway
- 1.10. Poland
- 1.11. Denmark
Europe Water Enhancer Industry REPORT HIGHLIGHTS
| Aspects | Details |
|---|---|
| Study Period | 2019-2033 |
| Base Year | 2024 |
| Estimated Year | 2025 |
| Forecast Period | 2025-2033 |
| Historical Period | 2019-2024 |
| Growth Rate | CAGR of 6.21% from 2019-2033 |
| Segmentation |
|
Table of Contents
- 1. Introduction
- 1.1. Research Scope
- 1.2. Market Segmentation
- 1.3. Research Methodology
- 1.4. Definitions and Assumptions
- 2. Executive Summary
- 2.1. Introduction
- 3. Market Dynamics
- 3.1. Introduction
- 3.2. Market Drivers
- 3.2.1. Increasing Sports Participation; Increasing Awareness about Health and Fitness
- 3.3. Market Restrains
- 3.3.1. Adverse Effects of Overconsumption of Products
- 3.4. Market Trends
- 3.4.1. Rising Demand for Non-Carbonated Beverages
- 4. Market Factor Analysis
- 4.1. Porters Five Forces
- 4.2. Supply/Value Chain
- 4.3. PESTEL analysis
- 4.4. Market Entropy
- 4.5. Patent/Trademark Analysis
- 5. Europe Water Enhancer Industry Analysis, Insights and Forecast, 2019-2031
- 5.1. Market Analysis, Insights and Forecast - by Distribution Channel
- 5.1.1. Supermarkets/Hypermarkets
- 5.1.2. Convenience Stores
- 5.1.3. Online Retail Stores
- 5.1.4. Pharmacy & Health Store
- 5.1.5. Other Distribution Channels
- 5.2. Market Analysis, Insights and Forecast - by Region
- 5.2.1. Europe
- 5.1. Market Analysis, Insights and Forecast - by Distribution Channel
- 6. Germany Europe Water Enhancer Industry Analysis, Insights and Forecast, 2019-2031
- 7. France Europe Water Enhancer Industry Analysis, Insights and Forecast, 2019-2031
- 8. Italy Europe Water Enhancer Industry Analysis, Insights and Forecast, 2019-2031
- 9. United Kingdom Europe Water Enhancer Industry Analysis, Insights and Forecast, 2019-2031
- 10. Netherlands Europe Water Enhancer Industry Analysis, Insights and Forecast, 2019-2031
- 11. Sweden Europe Water Enhancer Industry Analysis, Insights and Forecast, 2019-2031
- 12. Rest of Europe Europe Water Enhancer Industry Analysis, Insights and Forecast, 2019-2031
- 13. Competitive Analysis
- 13.1. Market Share Analysis 2024
- 13.2. Company Profiles
- 13.2.1 Dyla LLC (Stur)
- 13.2.1.1. Overview
- 13.2.1.2. Products
- 13.2.1.3. SWOT Analysis
- 13.2.1.4. Recent Developments
- 13.2.1.5. Financials (Based on Availability)
- 13.2.2 Protekt
- 13.2.2.1. Overview
- 13.2.2.2. Products
- 13.2.2.3. SWOT Analysis
- 13.2.2.4. Recent Developments
- 13.2.2.5. Financials (Based on Availability)
- 13.2.3 Vimto Soft Drinks
- 13.2.3.1. Overview
- 13.2.3.2. Products
- 13.2.3.3. SWOT Analysis
- 13.2.3.4. Recent Developments
- 13.2.3.5. Financials (Based on Availability)
- 13.2.4 PepsiCo Inc
- 13.2.4.1. Overview
- 13.2.4.2. Products
- 13.2.4.3. SWOT Analysis
- 13.2.4.4. Recent Developments
- 13.2.4.5. Financials (Based on Availability)
- 13.2.5 The Hut com Ltd (Exhante)
- 13.2.5.1. Overview
- 13.2.5.2. Products
- 13.2.5.3. SWOT Analysis
- 13.2.5.4. Recent Developments
- 13.2.5.5. Financials (Based on Availability)
- 13.2.6 The Kraft Heinz Company
- 13.2.6.1. Overview
- 13.2.6.2. Products
- 13.2.6.3. SWOT Analysis
- 13.2.6.4. Recent Developments
- 13.2.6.5. Financials (Based on Availability)
- 13.2.7 The Coca-Cola Company
- 13.2.7.1. Overview
- 13.2.7.2. Products
- 13.2.7.3. SWOT Analysis
- 13.2.7.4. Recent Developments
- 13.2.7.5. Financials (Based on Availability)
- 13.2.8 Pure Flavour GmbH
- 13.2.8.1. Overview
- 13.2.8.2. Products
- 13.2.8.3. SWOT Analysis
- 13.2.8.4. Recent Developments
- 13.2.8.5. Financials (Based on Availability)
- 13.2.9 DreamPak*List Not Exhaustive
- 13.2.9.1. Overview
- 13.2.9.2. Products
- 13.2.9.3. SWOT Analysis
- 13.2.9.4. Recent Developments
- 13.2.9.5. Financials (Based on Availability)
- 13.2.10 Wisdom Natural Brands
- 13.2.10.1. Overview
- 13.2.10.2. Products
- 13.2.10.3. SWOT Analysis
- 13.2.10.4. Recent Developments
- 13.2.10.5. Financials (Based on Availability)
- 13.2.1 Dyla LLC (Stur)
List of Figures
- Figure 1: Europe Water Enhancer Industry Revenue Breakdown (Million, %) by Product 2024 & 2032
- Figure 2: Europe Water Enhancer Industry Share (%) by Company 2024
List of Tables
- Table 1: Europe Water Enhancer Industry Revenue Million Forecast, by Region 2019 & 2032
- Table 2: Europe Water Enhancer Industry Volume K Litres Forecast, by Region 2019 & 2032
- Table 3: Europe Water Enhancer Industry Revenue Million Forecast, by Distribution Channel 2019 & 2032
- Table 4: Europe Water Enhancer Industry Volume K Litres Forecast, by Distribution Channel 2019 & 2032
- Table 5: Europe Water Enhancer Industry Revenue Million Forecast, by Region 2019 & 2032
- Table 6: Europe Water Enhancer Industry Volume K Litres Forecast, by Region 2019 & 2032
- Table 7: Europe Water Enhancer Industry Revenue Million Forecast, by Country 2019 & 2032
- Table 8: Europe Water Enhancer Industry Volume K Litres Forecast, by Country 2019 & 2032
- Table 9: Germany Europe Water Enhancer Industry Revenue (Million) Forecast, by Application 2019 & 2032
- Table 10: Germany Europe Water Enhancer Industry Volume (K Litres) Forecast, by Application 2019 & 2032
- Table 11: France Europe Water Enhancer Industry Revenue (Million) Forecast, by Application 2019 & 2032
- Table 12: France Europe Water Enhancer Industry Volume (K Litres) Forecast, by Application 2019 & 2032
- Table 13: Italy Europe Water Enhancer Industry Revenue (Million) Forecast, by Application 2019 & 2032
- Table 14: Italy Europe Water Enhancer Industry Volume (K Litres) Forecast, by Application 2019 & 2032
- Table 15: United Kingdom Europe Water Enhancer Industry Revenue (Million) Forecast, by Application 2019 & 2032
- Table 16: United Kingdom Europe Water Enhancer Industry Volume (K Litres) Forecast, by Application 2019 & 2032
- Table 17: Netherlands Europe Water Enhancer Industry Revenue (Million) Forecast, by Application 2019 & 2032
- Table 18: Netherlands Europe Water Enhancer Industry Volume (K Litres) Forecast, by Application 2019 & 2032
- Table 19: Sweden Europe Water Enhancer Industry Revenue (Million) Forecast, by Application 2019 & 2032
- Table 20: Sweden Europe Water Enhancer Industry Volume (K Litres) Forecast, by Application 2019 & 2032
- Table 21: Rest of Europe Europe Water Enhancer Industry Revenue (Million) Forecast, by Application 2019 & 2032
- Table 22: Rest of Europe Europe Water Enhancer Industry Volume (K Litres) Forecast, by Application 2019 & 2032
- Table 23: Europe Water Enhancer Industry Revenue Million Forecast, by Distribution Channel 2019 & 2032
- Table 24: Europe Water Enhancer Industry Volume K Litres Forecast, by Distribution Channel 2019 & 2032
- Table 25: Europe Water Enhancer Industry Revenue Million Forecast, by Country 2019 & 2032
- Table 26: Europe Water Enhancer Industry Volume K Litres Forecast, by Country 2019 & 2032
- Table 27: United Kingdom Europe Water Enhancer Industry Revenue (Million) Forecast, by Application 2019 & 2032
- Table 28: United Kingdom Europe Water Enhancer Industry Volume (K Litres) Forecast, by Application 2019 & 2032
- Table 29: Germany Europe Water Enhancer Industry Revenue (Million) Forecast, by Application 2019 & 2032
- Table 30: Germany Europe Water Enhancer Industry Volume (K Litres) Forecast, by Application 2019 & 2032
- Table 31: France Europe Water Enhancer Industry Revenue (Million) Forecast, by Application 2019 & 2032
- Table 32: France Europe Water Enhancer Industry Volume (K Litres) Forecast, by Application 2019 & 2032
- Table 33: Italy Europe Water Enhancer Industry Revenue (Million) Forecast, by Application 2019 & 2032
- Table 34: Italy Europe Water Enhancer Industry Volume (K Litres) Forecast, by Application 2019 & 2032
- Table 35: Spain Europe Water Enhancer Industry Revenue (Million) Forecast, by Application 2019 & 2032
- Table 36: Spain Europe Water Enhancer Industry Volume (K Litres) Forecast, by Application 2019 & 2032
- Table 37: Netherlands Europe Water Enhancer Industry Revenue (Million) Forecast, by Application 2019 & 2032
- Table 38: Netherlands Europe Water Enhancer Industry Volume (K Litres) Forecast, by Application 2019 & 2032
- Table 39: Belgium Europe Water Enhancer Industry Revenue (Million) Forecast, by Application 2019 & 2032
- Table 40: Belgium Europe Water Enhancer Industry Volume (K Litres) Forecast, by Application 2019 & 2032
- Table 41: Sweden Europe Water Enhancer Industry Revenue (Million) Forecast, by Application 2019 & 2032
- Table 42: Sweden Europe Water Enhancer Industry Volume (K Litres) Forecast, by Application 2019 & 2032
- Table 43: Norway Europe Water Enhancer Industry Revenue (Million) Forecast, by Application 2019 & 2032
- Table 44: Norway Europe Water Enhancer Industry Volume (K Litres) Forecast, by Application 2019 & 2032
- Table 45: Poland Europe Water Enhancer Industry Revenue (Million) Forecast, by Application 2019 & 2032
- Table 46: Poland Europe Water Enhancer Industry Volume (K Litres) Forecast, by Application 2019 & 2032
- Table 47: Denmark Europe Water Enhancer Industry Revenue (Million) Forecast, by Application 2019 & 2032
- Table 48: Denmark Europe Water Enhancer Industry Volume (K Litres) Forecast, by Application 2019 & 2032
Frequently Asked Questions
1. What is the projected Compound Annual Growth Rate (CAGR) of the Europe Water Enhancer Industry?
The projected CAGR is approximately 6.21%.
2. Which companies are prominent players in the Europe Water Enhancer Industry?
Key companies in the market include Dyla LLC (Stur), Protekt, Vimto Soft Drinks, PepsiCo Inc, The Hut com Ltd (Exhante), The Kraft Heinz Company, The Coca-Cola Company, Pure Flavour GmbH, DreamPak*List Not Exhaustive, Wisdom Natural Brands.
3. What are the main segments of the Europe Water Enhancer Industry?
The market segments include Distribution Channel.
4. Can you provide details about the market size?
The market size is estimated to be USD 1.08 Million as of 2022.
5. What are some drivers contributing to market growth?
Increasing Sports Participation; Increasing Awareness about Health and Fitness.
6. What are the notable trends driving market growth?
Rising Demand for Non-Carbonated Beverages.
7. Are there any restraints impacting market growth?
Adverse Effects of Overconsumption of Products.
8. Can you provide examples of recent developments in the market?
In 2022, Robinsons launched new Benefit Drops in four flavors. Each with a different added functional benefit, the Britvic-owned range offers shoppers a convenient and tasty way to gain additional vitamins while on the move. It helps consumers make tastier, healthier choices in line with Britvic’s long-term Healthier People strategy.
9. What pricing options are available for accessing the report?
Pricing options include single-user, multi-user, and enterprise licenses priced at USD 4750, USD 5250, and USD 8750 respectively.
10. Is the market size provided in terms of value or volume?
The market size is provided in terms of value, measured in Million and volume, measured in K Litres.
11. Are there any specific market keywords associated with the report?
Yes, the market keyword associated with the report is "Europe Water Enhancer Industry," which aids in identifying and referencing the specific market segment covered.
12. How do I determine which pricing option suits my needs best?
The pricing options vary based on user requirements and access needs. Individual users may opt for single-user licenses, while businesses requiring broader access may choose multi-user or enterprise licenses for cost-effective access to the report.
13. Are there any additional resources or data provided in the Europe Water Enhancer Industry report?
While the report offers comprehensive insights, it's advisable to review the specific contents or supplementary materials provided to ascertain if additional resources or data are available.
14. How can I stay updated on further developments or reports in the Europe Water Enhancer Industry?
To stay informed about further developments, trends, and reports in the Europe Water Enhancer Industry, consider subscribing to industry newsletters, following relevant companies and organizations, or regularly checking reputable industry news sources and publications.
Methodology
Step 1 - Identification of Relevant Samples Size from Population Database


Step 2 - Approaches for Defining Global Market Size (Value, Volume* & Price*)

Note*: In applicable scenarios
Step 3 - Data Sources
Primary Research
- Web Analytics
- Survey Reports
- Research Institute
- Latest Research Reports
- Opinion Leaders
Secondary Research
- Annual Reports
- White Paper
- Latest Press Release
- Industry Association
- Paid Database
- Investor Presentations

Step 4 - Data Triangulation
Involves using different sources of information in order to increase the validity of a study
These sources are likely to be stakeholders in a program - participants, other researchers, program staff, other community members, and so on.
Then we put all data in single framework & apply various statistical tools to find out the dynamic on the market.
During the analysis stage, feedback from the stakeholder groups would be compared to determine areas of agreement as well as areas of divergence
